1. Introduction: The Strategic Reset of Ratnakar
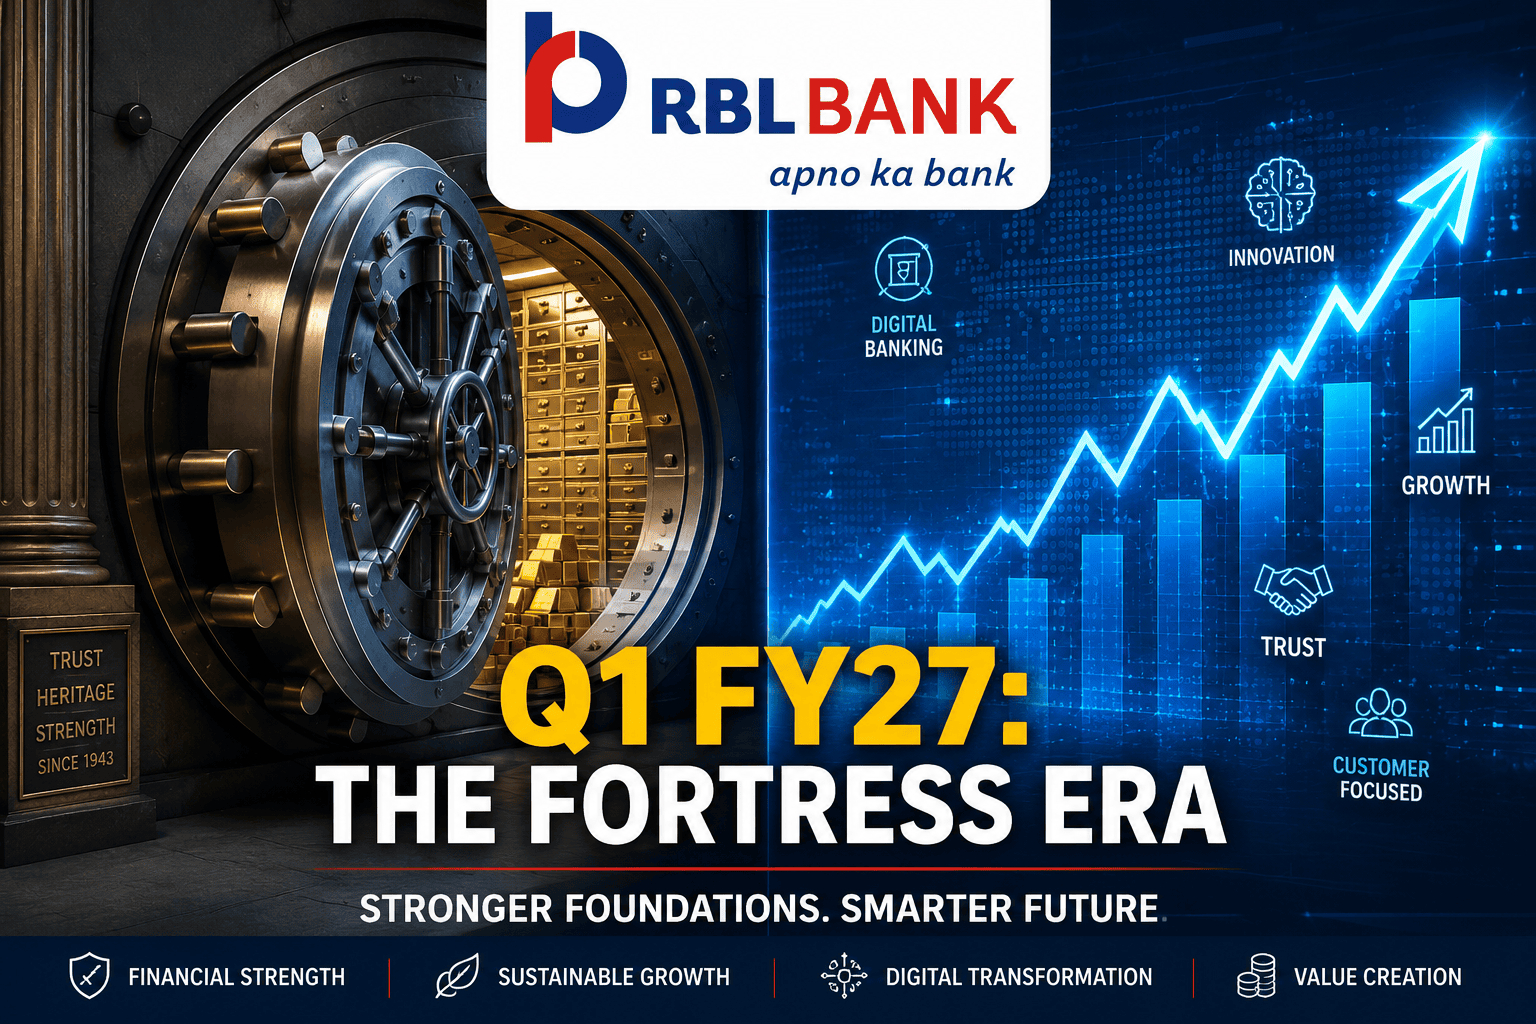
For Indian banking sector observers, the structural evolution of RBL Bank Limited has entered its most decisive chapter. On July 17, 2026, the Board of Directors of RBL Bank approved its unaudited standalone and consolidated financial results for the quarter ended June 30, 2026 (Q1 FY27). The headline data reflects a bank operating across two distinct dimensions: a highly stable operational performance showing steady growth, and an extraordinary, capital-defining strategic pivot that fundamentally transforms its balance sheet architecture.
The defining development of the quarter is the official completion of the mega-preferential allotment to Emirates NBD Bank (P.J.S.C.). Backed by an investment of ₹26,015.77 crore, Emirates NBD acquired 929,134,820 equity shares at ₹280 per share, taking a commanding 60% controlling stake and becoming the official promoter of the bank. This influx of capital has pushed RBL Bank’s standalone Capital Adequacy Ratio (CRAR) to an astonishing 33.28%. This structural shift alters the risk profile, credit capacity, and competitive positioning of the institution within the Indian banking landscape.
2. Executive Summary
Net Profit Growth: Standalone Net Profit after tax stood at ₹253.70 crore, marking a steady year-on-year (YoY) expansion of 26.64% compared to ₹200.33 crore in the corresponding quarter of the previous fiscal year.
Core Income Resilience: Total Interest Earned reached ₹3,840.25 crore, up 11.60% YoY from ₹3,441.09 crore, driven primarily by robust loan and bill discounting interest income.
Asset Quality Improvements: Gross Non-Performing Assets (GNPA) decreased substantially to 1.30%, down from 2.78% in Q1 FY26 and 1.45% in Q4 FY26. Net Non-Performing Assets (NNPA) dropped to 0.37%.
Unprecedented Capital Buffer: Backed by the Emirates NBD transaction, the standalone Capital Adequacy Ratio spiked to 33.28% from 14.25% in the previous quarter, establishing an institutional fortress value.
Balance Sheet De-risking: Net worth surged to ₹42,078.97 crore, bringing the Debt-Equity ratio down to 0.23 (from 1.01 in March 2026), and total debts to total assets down to 5.28%.
Operational Control: Operating profit before provisions and contingencies advanced by 31.27% to ₹922.79 crore, aided by a structural drop in other operating expenses.
Stressed Asset Cleanup: The bank executed a cash-basis transfer of 130,437 technically written-off credit card accounts worth ₹712.27 crore to an Asset Reconstruction Company (ARC) for a consideration of ₹23.15 crore.
Corporate Restructuring: The proposed Scheme of Amalgamation of Emirates NBD Bank India Branch into RBL Bank remains actively under RBI review, following shareholder approval.
3. Key Numbers at a Glance (Standalone Financials)
The financial table below provides a comprehensive comparison of the quarterly performance metrics, compiled directly from RBL Bank’s regulatory filings.
| Financial Metric | Q1 FY27 (Ended 30-Jun-2026) (₹ in Crore) | Q4 FY26 (Ended 31-Mar-2026) (₹ in Crore) | Q1 FY26 (Ended 30-Jun-2025) (₹ in Crore) | YoY Growth (%) | QoQ Growth (%) |
Interest Earned | 3,840.25 | 3,720.25 | 3,441.09 | 11.60% | 3.23% |
Interest Expended | 2,185.80 | 2,049.29 | 1960.43 | 11.50% | 6.66% |
Other Income | 959.43 | 1,068.96 | 1,069.48 | -10.29% | -10.25% |
Total Income | 4,799.68 | 4,789.21 | 4,510.57 | 6.41% | 0.22% |
Employee Costs | 516.13 | 482.17 | 474.64 | 8.74% | 7.04% |
Other Operating Expenses | 1,174.96 | 1,302.37 | 1,372.55 | -14.40% | -9.78% |
Operating Profit (PPOP) | 922.79 | 955.38 | 702.95 | 31.27% | -3.41% |
Provisions & Contingencies | 599.28 | 678.32 | 442.32 | 35.49% | -11.65% |
Profit Before Tax (PBT) | 323.51 | 277.06 | 260.63 | 24.13% | 16.77% |
Net Profit After Tax (PAT) | 253.70 | 229.71 | 200.33 | 26.64% | 10.44% |
Gross NPA (%) | 1.30% | 1.45% | 2.78% | -148 bps | -15 bps |
Net NPA (%) | 0.37% | 0.39% | 0.45% | -8 bps | -2 bps |
Capital Adequacy Ratio (CRAR) | 33.28% | 14.25% | 15.42% | +1786 bps | +1903 bps |
Return on Assets (RoA) (Annualized) | 0.57% | 0.55% | 0.56% | +1 bps | +2 bps |
Net Worth | 42,078.97 | 16,013.70 | 14,957.47 | 181.32% | 162.77% |
Debt-Equity Ratio | 0.23 | 1.01 | 0.94 | -75.53% | -77.23% |
Did You Know? A Capital Adequacy Ratio of 33.28% is nearly triple the minimum statutory requirement mandated by the Reserve Bank of India (RBI) under Basel III norms. This places RBL Bank among the most well-capitalized commercial banking institutions in the developing world, paving the way for aggressive corporate and retail lending expansion over the next decade.
4. Quarterly Performance Analysis
Income Dynamics and Core Spreads
RBL Bank’s core engine exhibited high levels of resilience, with interest income generated from advances and bill discounting growing to ₹3,107.14 crore compared to ₹2,772.25 crore in Q1 FY26. Interest earned on investments remained stable at ₹538.39 crore, while interest income generated via interbank funds and balances with the RBI experienced a sharp spike of 112.57% YoY to ₹144.42 crore. This reflects the temporary deployment of the new capital injection into highly liquid, low-risk options prior to long-term credit deployment.
However, the cost of funds presented intermediate pressure. Interest expended rose to ₹2,185.80 crore, expanding 6.66% sequentially from Q4 FY26. This compression was countered by disciplined cost management on the operating expenditure front.
The Operational Efficiency Pivot
While other income dipped slightly by 10.29% YoY to ₹959.43 crore due to normalized treasury gains and investment adjustments, the real operational victory came from cost containments. Other operating expenses fell significantly to ₹1,174.96 crore, down from ₹1,372.55 crore in the year-ago quarter. Consequently, the Core Pre-Provision Operating Profit (PPOP) climbed by 31.27% YoY to ₹922.79 crore.
Operating Efficiency Visualized (Standalone YoY):
Total Income:     ₹4,510.57 cr ──> ₹4,799.68 cr (+6.41%)
Total Opex:       ₹1,847.19 cr ──> ₹1,691.09 cr (-8.45%)
Operating Profit:   ₹702.95 cr ──>   ₹922.79 cr (+31.27%)
Asset Quality and Portfolio De-risking
Asset quality metrics highlights a structural normalization. The Gross NPA ratio improved to a multi-quarter low of 1.30%. Total standalone Gross NPAs fell in absolute terms to ₹1,521.59 crore relative to ₹2,685.86 crore YoY. Net NPAs absolute exposure reduced to ₹426.10 crore, achieving a lean NNPA print of 0.37%.
This clean-up was accelerated by the management’s tactical resolution of its legacy retail book. During the quarter, the bank offloaded 130,437 technically written-off credit card accounts, holding a total principal outstanding of ₹712.27 crore, to an ARC on a pure cash basis for ₹23.15 crore. The entire amount was utilized to reverse excess provisions directly into the profit and loss ledger, limiting net credit costs.
5. Segment-Wise Analysis: Institutional Growth vs. Retail Transitions
A look at RBL Bank’s standalone segment reporting yields critical insights into where asset expansion is generating yields and where restructuring continues to weigh on profitability.
Segment Share of Total Revenue (Q1 FY27 Standalone):
┌──────────────────────────────┬──────────────────┐
│ Retail Banking: 45.75%       │ Corporate:23.71% │
├──────────────────────────────┴──────────────────┤
│ Treasury: 29.95%             │ Other: 0.59%     │
└─────────────────────────────────────────────────┘
*Percentages calculated prior to Inter-Segment Revenue deductions.
Corporate/Wholesale Banking: The Engine Room
The Corporate Banking unit capitalized on macro-economic infrastructure rollouts and high-grade working capital demand.
Revenue: Expanded to ₹2,175.26 crore, up 25.44% YoY from ₹1,734.11 crore.
Segment Results: Net profit for the segment reached ₹218.55 crore, an increase of 87.13% from the ₹116.79 crore posted in Q1 FY26.
Assets Allocated: Corporate assets climbed sharply to ₹62,975.16 crore, highlighting where the initial drafts of Emirates NBD capital are being productively deployed.
Retail Banking: Structural Challenges and Provisioning Drags
The retail franchise remains a primary top-line contributor but faces near-term profitability headwinds.
Revenue: Stood robust at ₹4,197.77 crore.
Segment Results: Registered a net loss of -₹81.28 crore. While this represents a sequential improvement over the ₹178.09 crore loss in Q4 FY26, it highlights ongoing provisioning requirements in unsecured personal lines.
Assets Allocated: Dropped to ₹55,546.66 crore from ₹60,567.37 crore sequentially, as the management intentionally rationalized high-risk portfolios to maintain systemic underwriting health.
Treasury Operations: Liquidity Balancing Act
Revenue: Reached ₹2,748.32 crore.
Segment Results: Advanced to ₹131.28 crore from a lower base of ₹22.80 crore in the sequential quarter, benefiting from optimization under the new investment portfolio rules. Note 6 reveals that the bank structurally shifted ₹320.00 crore from its Investment Fluctuation Reserve (IFR) into its General Reserve during the period.
6. Financial Ratios Analysis: What They Mean for Investors
Evaluating RBL Bank requires mapping standard banking performance templates across a highly unusual capital expansion environment. Below is a breakdown of the key structural indicators:
Return on Assets (RoA) (0.57%): Annualized RoA edged upward by 2 basis points sequentially. While a sub-1% RoA indicates room for asset-sweeping improvements, the denominator (Total Assets) is currently expanded by unutilized capital cash equivalents. As this cash shifts into high-yield advances, RoA expansion is expected to accelerate.
Debt-Equity Ratio (0.23): Falling from 1.01 year-on-year, this ratio highlights that the bank is now equity-heavy. It provides institutional security against localized macro disruptions and matches global standards for systemic financial institutions.
Total Debts to Total Assets (5.28%): A contraction from 9.29% demonstrates reduced institutional reliance on wholesale market borrowings and expensive short-term interbank refinancing certificates, lowering structural liquidity risk.
7. Strategic Risks & Tailwinds: The Road Ahead
Key Material Opportunities
Emirates NBD Synergies & Cross-Border Flows: As a direct subsidiary of one of the Middle East’s largest financial groups, RBL Bank can capture major market share in Indo-UAE trade corridors, remittance channels, and foreign currency non-resident (FCNR) deposit flows.
Aggressive Loan Expansion Runway: Armed with a 33.28% CRAR and a standalone net worth of ₹42,078.97 crore, the bank has the capacity to expand its corporate balance sheet without requiring dilutive equity fundraising for the next five to seven years.
Imminent Amalgamation Tailwinds: The ongoing merger execution of Emirates NBD’s local Indian corporate branches into RBL Bank (pending final RBI sign-off) will onboard highly profitable, multi-national corporate accounts directly onto the bank’s books.
Key Risks to Monitor
Retail Segment Underperformance: The retail division’s loss of ₹81.28 crore shows that stabilizing the unsecured retail and credit card portfolios remains a work in progress.
Denominator Drag on Ratios: Near-term Return on Equity (RoE) and Net Interest Margin (NIM) may experience compression because the massive capital infusion significantly inflates the equity base before it can be fully deployed into interest-generating assets.