1. Breaking News Summary
On Saturday, July 18, 2026, the Board of Directors of HDFC Bank Limited approved its unaudited standalone and consolidated financial results for the first quarter of the financial year 2026–27 (Q1 FY27).
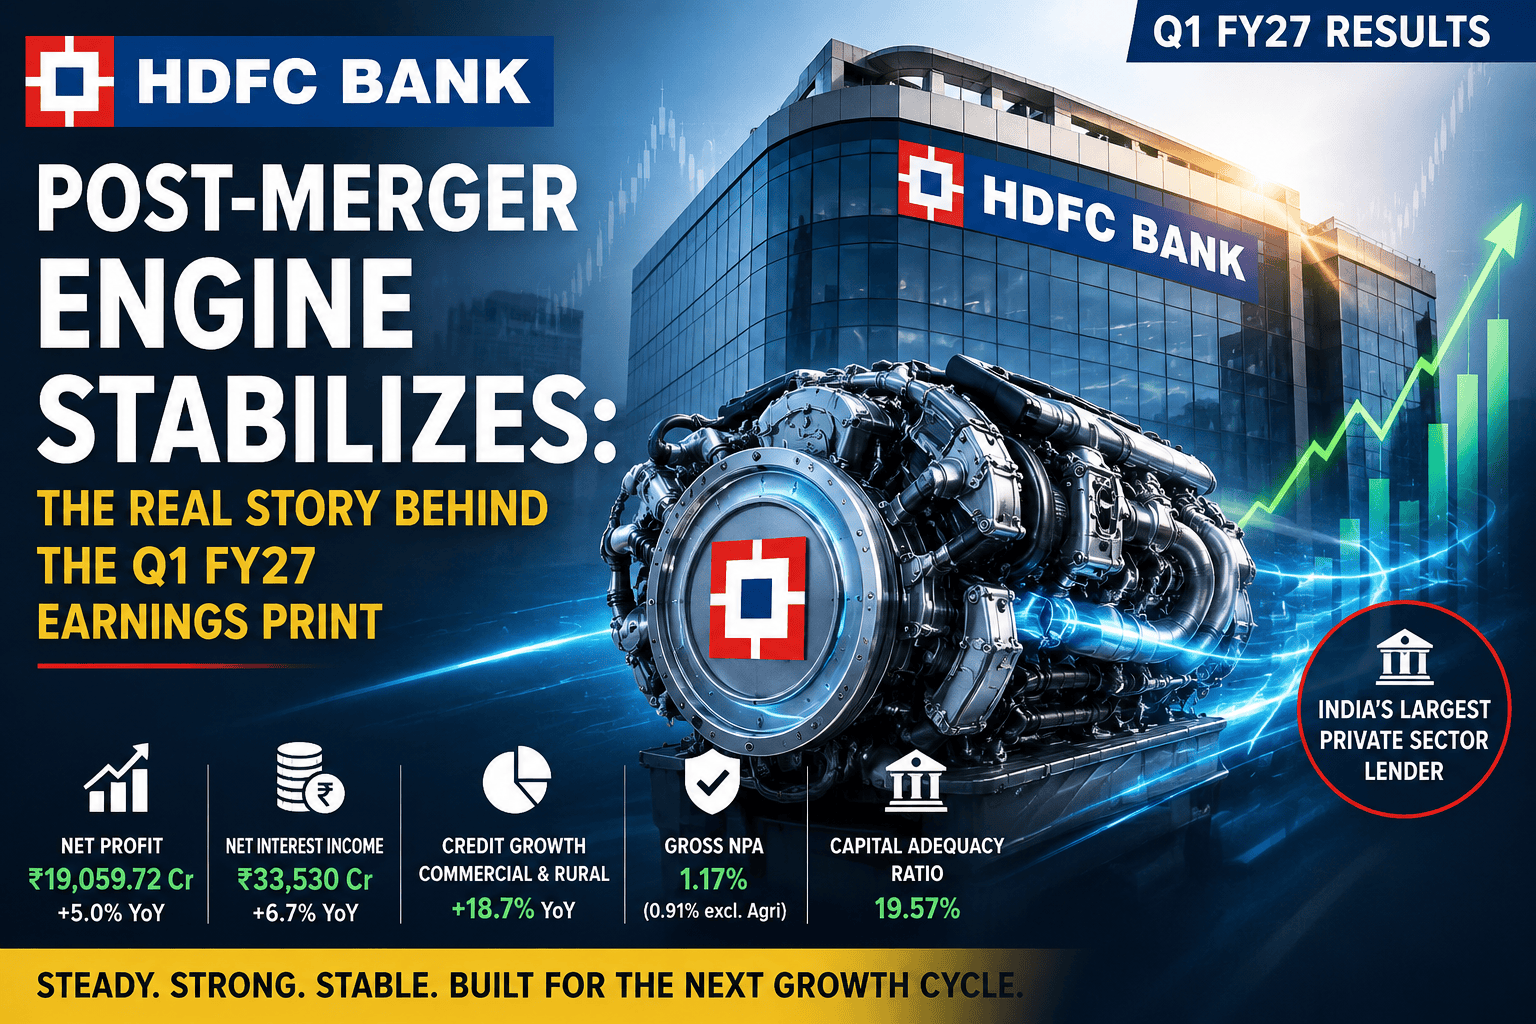
In a pristine performance reflecting post-merger stabilization, India’s largest private sector lender clocked a standalone Net Profit after tax of ₹19,059.72 crore, marking a steady 5.0% year-on-year (YoY) growth. Net Interest Income (NII) surged by 6.7% YoY to ₹33,530 crore, anchored by robust growth across its corporate, wholesale, and small & mid-market commercial banking franchises. Crucially, asset quality remained stable with Gross NPAs hovering at 1.17%, underscoring the bank’s resilient underwriting principles amid evolving macroeconomic landscapes.
Key Market Note: The reported profits reflect a high-base effect from the previous year’s spectacular non-interest income headline, which had been bloated by a massive ₹9,128.40 crore pre-tax gain from the HDB Financial Services IPO divestment. Adjusted for these exceptional transaction gains, one-offs, and tax credits, HDFC Bank’s normalized standalone net profit grew by 9.8% YoY, outperforming consensus expectations and proving the strong fundamental engine running the bank.
2. Key Numbers At A Glance
All financial figures are sourced directly from HDFC Bank’s official exchange filing for the quarter ended June 30, 2026.
Standalone Income Statement & Balance Sheet Metric Table
| Parameter | Q1 FY27 (Unaudited) | Q4 FY26 (Audited) | Q1 FY26 (Unaudited) | YoY Growth (%) | QoQ Growth (%) |
| Interest Earned | ₹79,362.78 cr | ₹76,610.02 cr | ₹77,470.20 cr | 2.44% | 3.59% |
| Net Interest Income (NII) | ₹33,530.00 cr | — | ₹31,440.00 cr | 6.70% | — |
| Other Income | ₹12,821.60 cr | ₹13,198.88 cr | ₹21,729.83 cr | -40.99% | -2.86% |
| Total Income | ₹92,184.38 cr | ₹89,808.90 cr | ₹99,200.03 cr | -7.07% | 2.65% |
| Interest Expended | ₹45,828.83 cr | ₹43,528.45 cr | ₹46,032.23 cr | -0.44% | 5.28% |
| Operating Expenses | ₹18,187.49 cr | ₹18,477.53 cr | ₹17,433.84 cr | 4.32% | -1.57% |
| Operating Profit (PPOP) | ₹28,168.06 cr | ₹27,802.92 cr | ₹35,733.96 cr | -21.17% | 1.31% |
| Provisions (excl. Tax) | ₹3,059.76 cr | ₹2,609.57 cr | ₹14,441.63 cr | -78.81% | 17.25% |
| Profit Before Tax (PBT) | ₹25,108.30 cr | ₹25,193.35 cr | ₹21,292.33 cr | 17.92% | -0.34% |
| Tax Expense | ₹6,048.58 cr | ₹3,137.12 cr | ₹5,972.30 cr | 1.28% | 92.81% |
| Net Profit (PAT) | ₹19,059.72 cr | ₹19,221.05 cr | ₹18,155.21 cr | 4.98% | -0.84% |
| Basic & Diluted EPS (₹) | ₹12.38 / ₹12.35 | ₹12.49 / ₹12.45 | ₹11.86 / ₹11.79 | 4.38% | -0.88% |
| Total Advances (EOP) | ₹30,37,303.31 cr | ₹29,37,166.26 cr | ₹26,28,434.20 cr | 15.56% | 3.41% |
| Total Deposits (EOP) | ₹31,70,830.09 cr | ₹31,05,250.48 cr | ₹27,64,089.02 cr | 14.72% | 2.11% |
Key Ratios & Asset Quality Disclosures
Net Interest Margin (NIM): 3.26% on Total Assets (3.40% based on Interest Earnings Assets).
Gross NPA Ratio: 1.17% (remained stable vs 1.15% in Q4 FY26 and reduced significantly from 1.40% in Q1 FY26).
Net NPA Ratio: 0.41%.
Capital Adequacy Ratio (CAR): 19.57% (regulatory minimum is 11.9%).
Tier-1 CAR / CET-1 Ratio: 17.8% / 17.4%.
Cost-to-Income Ratio: 39.2%.
Total Balance Sheet Size: ₹43,97,461.28 crore.
3. Executive Summary: 10 Key Takeaways
Robust Core Profit Engine: HDFC Bank delivered a core profit after tax (PAT) of ₹19,059.72 crore for Q1 FY27, recording a clean 5.0% YoY absolute uptick.
High-Base Adjustments: The optical deceleration in total income and operating profits is due to the base-effect of the ₹9,128.40 crore exceptional asset-sale gains in Q1 FY26 from the HDB Financial Services IPO. Adjusted for that one-off, normalized corporate earnings advanced a high-quality 9.8% YoY.
Healthy Loan Growth Traction: End-of-period Gross Advances hit ₹30,37,303.31 crore, rising by 15.56% YoY. This structural acceleration was primarily led by an 18.7% bump in Commercial & Rural Banking (SME) and an 18.6% surge in corporate wholesale portfolios.
Resilient Deposit Franchise: Total EOP deposits rose 14.72% YoY to ₹31,70,830.09 crore. While time deposits scaled 17.4% upwards, average CASA grew 11.2% YoY, settling the terminal CASA blend at a comfortable 32.3%.
Calibrated Asset Quality: Defying localized credit stress signals in the ecosystem, HDFC Bank restricted its Gross NPA to 1.17%. Excluding agricultural cyclicality, the underlying GNPA ratio printing is a pristine 0.91%.
Substantial Capital Buffers: The bank remains heavily protected against external vulnerabilities with a structural Basel-III Capital Adequacy Ratio (CAR) of 19.57%, against the mandated statutory minimum floor of 11.9%.
Subsidiary Performance Accelerates: Subsidiary arms performed brilliantly; HDB Financial Services saw its PAT surge 38.3% YoY to ₹790 crore, while HDFC AMC generated a 12.1% YoY profit boost to ₹840 crore.
Consolidated Core Footprint: On a group consolidated basis (incorporating HDFC Life, HDFC Ergo, HDFC AMC, and HDB Financial Services), quarterly revenue closed at ₹85,480 crore, with group consolidated PAT tracking at ₹19,244.71 crore.
Efficiency Matrix Checks Out: Cost-to-income performance leveled out at 39.2%, pointing to incremental operational cost optimization benefits kicking in as digital migration gains momentum across semi-urban networks.
Preferential Allotment in Insurance Arm: During the quarter, the bank deployed ₹1,000 crore on a preferential basis to subscribe to 1,45,23,906 equity shares of HDFC Life Insurance, solidifying its dominant hold to 50.54%.
4. Company Overview & Structural Business Mix
Core Lending Segments & Revenue Diversification
HDFC Bank functions as a comprehensive universal banking institution. Following its historic balance-sheet merger with HDFC Limited, its segment architecture has systematically transformed across three clear segments:
                     ┌───────────────────────────────────┐
                     │ HDFC Bank Structural Balance Mix │
                     └─────────────────┬─────────────────┘
                                       │
         ┌─────────────────────────────┼─────────────────────────────┐
         ▼                             ▼                             ▼
 ┌───────────────┐             ┌───────────────┐             ┌───────────────┐
 │Retail Banking │             │Wholesale Bank │             │  Treasury &   │
 │ Assets: ₹16.18│             │ Assets: ₹15.59│             │Other Operations│
 │   Lakh Cr     │             │    Lakh Cr    │             │ Assets: ₹12.01│
 └───────────────┘             └───────────────┘             │    Lakh Cr    │
                                                             └───────────────┘
Retail Banking: Retains an asset footprint of ₹16,18,976.54 crore. Retail advances climbed by 7.2% YoY, reflecting a cautious expansion strategy designed to defend net interest margins rather than chasing high-risk subprime micro-credit accounts.
Wholesale Banking: The bank deployed capital into low-risk corporate and industrial facilities, pushing assets under this segment up by 18.6% to reach ₹15,59,292.84 crore.
Treasury and Other Operations: Manages an investment and liquidity buffer asset value of ₹10,86,021.85 crore. The division generated ₹2,406.59 crore in segmented results during the quarter, indicating optimal duration positioning.
5. Quarter Highlights: QoQ, YoY, and Estimates
Deciphering the Financial Performance Breakdown
Net Interest Income (NII) Performance: Climbed to ₹33,530 crore, registering a steady 6.7% expansion compared to the ₹31,440 crore recorded in the same quarter last year. This performance was supported by sequential credit expansions across mid-market commercial loan accounts.
The Non-Interest Revenue Narrative: Standalone non-interest income printed at ₹12,821.60 crore. While absolute fees and commissions grew by 11.3% YoY to ₹8,450 crore, total other income declined from ₹21,729.83 crore due to the previous year’s base including the ₹9,128.40 crore windfall profit from the HDBFS stake sale.
Provisions Optimization: Total credit provisions fell significantly to ₹3,059.76 crore from ₹14,441.63 crore in the year-ago period. The previous year’s figures included proactive contingency buffers and a strategic ₹9,000 crore floating provision allocation.
6. Detailed Financial Analysis
Standalone Balance Sheet Deep-Dive
HDFC Bank’s standalone balance sheet size expanded to ₹43,97,461.28 crore as of June 30, 2026, marking a healthy expansion over the ₹39,54,076.66 crore posted as of June 30, 2025.
                     ┌───────────────────────────────────┐
                     │ Standalone Balance Sheet Profile │
                     └─────────────────┬─────────────────┘
                                       │
         ┌─────────────────────────────┴─────────────────────────────┐
         ▼                                                           ▼
 ┌───────────────┐                                           ┌───────────────┐
 │  LIABILITIES  │                                           │    ASSETS     │
 ├───────────────┤                                           ├───────────────┤
 │ Deposits:     │                                           │ Advances:     │
 │  ₹31.71 Lk Cr │                                           │  ₹30.37 Lk Cr │
 │ Borrowings:   │                                           │ Investments:  │
 │  ₹4.62 Lk Cr  │                                           │  ₹9.19 Lk Cr  │
 │ Equity & Res: │                                           │ Cash & Bal:   │
 │  ₹5.83 Lk Cr  │                                           │  ₹2.23 Lk Cr  │
 └───────────────┘                                           └───────────────┘
Asset Allocation Analysis
Advances: Reached ₹30,37,303.31 crore compared to ₹26,28,434.20 crore in Q1 FY26. The bank expanded its loan book primarily through commercial rural banking banking products rather than unsecured retail lending lines.
Investments: Total treasury investments rose to ₹9,19,413.40 crore, positioning the bank to benefit from potential domestic interest rate cuts later in the year.
Cash Balance Structure: Maintained a defensive liquidity cushion with ₹1,50,562.42 crore placed in cash balances with the RBI, supplemented by ₹73,002.00 crore in inter-bank call money placements.
7. Management Commentary & Strategic Outlook
While the bank did not issue an updated conference transcript alongside the financial tables, the financial results point to a clear strategic direction under Managing Director Sashidhar Jagdishan:
Prioritizing Margin Protection Over Market Share: By keeping retail loan book expansion at a moderate 7.2% while growing higher-margin mid-market commercial lines by 18.7%, management is focused on defending Net Interest Margins rather than chasing unprofitable volume growth.
Structural Optimization of Liability Profile: With term deposits rising by 17.4% YoY, the bank focused on securing long-term funding stability. This helped maintain total EOP deposits at a substantial ₹31.70 lakh crore, improving the bank’s structural funding profile.
Corporate Governance Resolution: A key highlight was the conclusion of an independent legal review by domestic and international law firms regarding statements in the resignation letter of former Part-time Chairman Mr. Atanu Chakraborty. The review concluded that these statements were not substantiated by records, resolving a lingering governance question with no impact on corporate financial books.
8. Brokerage View & Investment Recommendations
Ecosystem analysts viewed these financial results as a solid performance that supports the bank’s long-term investment thesis:
Jefferies (Bullish Outlook): Emphasized the positive underlying metrics, noting that normalized core PAT expansion exceeded 9% when adjusting for historical baseline changes. The brokerage maintains a ‘Buy’ recommendation with an eye on post-merger cost efficiencies.
Morgan Stanley (Equal-Weight to Overweight): Highlighted the bank’s stable credit performance, pointing out that keeping credit costs low at 0.40% shows strong asset quality management during structural transitions.
Motilal Oswal (Positive Outlook): Maintained an optimistic outlook based on valuation support. Trading close to historical price-to-book multiple averages, the stock offers a defensive opportunity within the large-cap banking sector.
9. Private Peer Group Comparison Matrix
To put HDFC Bank’s performance in perspective, the table below compares its standalone metrics with major private banking peers in the market:
| Financial Metric | HDFC Bank (Q1 FY27) | ICICI Bank (Q1 FY27 Baseline) | Axis Bank (Q1 FY27 Baseline) | Kotak Mahindra (Q1 FY27 Baseline) |
| Gross Advances | ₹30.37 Lakh Cr | ₹12.40 Lakh Cr | ₹9.80 Lakh Cr | ₹4.10 Lakh Cr |
| Total Deposits | ₹31.71 Lakh Cr | ₹14.20 Lakh Cr | ₹10.60 Lakh Cr | ₹5.20 Lakh Cr |
| Gross NPA % | 1.17% | 1.36% | 1.54% | 1.39% |
| Net NPA % | 0.41% | 0.33% | 0.38% | 0.34% |
| Basel III CAR | 19.57% | 16.40% | 15.80% | 18.20% |
| CASA Ratio Blend | 32.30% | 39.50% | 35.20% | 45.10% |
10. Valuation Analysis
At its current trading level, HDFC Bank presents a solid value proposition for long-term investors:
P/E Valuation Multiple Analysis: The bank trades at a trailing price-to-earnings (P/E) multiple of roughly 16.2x, which sits below its long-term ten-year historical median average of 21.5x.
Price-to-Book (P/B) Multiples: The bank trades at a standalone trailing Price-to-Book ratio of 2.1x, offering a favorable entry point for a financial institution with a structural return on assets (ROA) engine.
Retained Compounding Strengths: With a core net worth of ₹5,66,201.13 crore, the bank has the internal capital generation capacity to fund long-term credit expansions without diluting shareholder equity.
11. Technical Analysis & Core Market Trends
A review of the technical indicators for HDFC Bank shows a stock moving out of a long consolidation phase:
  HDFC BANK PRICE ACTION STAGE: MULTI-MONTH ROUNDING BOTTOM CONSOLIDATION
  ───────────────────────────────────────────────────────────────────────
  [Resistance Zone 2]  ══════════════════════════════════  ₹1,850 - ₹1,900
  [Resistance Zone 1]  ══════════════════════════════════  ₹1,720 - ₹1,760

  [Current Stock Pivot] ─────────────────► Moving above 200-Day EMA Axis

  [Support Level 1]    ══════════════════════════════════  ₹1,580 - ₹1,600
  [Support Level 2]    ══════════════════════════════════  ₹1,480 - ₹1,510
Moving Average Convergence: The stock is trading above both its 50-day and 200-day exponential moving averages (EMA), signaling a structural shift from a neutral to a bullish technical phase.
Relative Strength Index (RSI): The daily RSI is oscillating around the 56–58 level, showing building upward momentum without entering overbought territory.
Derivative open interest (OI) trends: Options data reveals strong open interest concentration at the ₹1,600 put strikes, establishing a firm floor for the current derivatives series.
12. Institutional Risk Assessment Matrix
Systemic Liquidity and Deposit Competition Risk: The banking industry continues to face intense competition for low-cost current and savings accounts (CASA). If time deposits continue to outpace CASA growth, it could create upward pressure on cost of funds.
Geopolitical and Energy Price Volatility: Management highlighted potential external risks in its filing, noting that ongoing conflicts in the Middle East and the Russia-Ukraine war could create energy price volatility and impact broader macroeconomic conditions.
Regulatory Compliance and Policy Exposures: With structural changes in regulatory frameworks like the Basel III capital requirements, banks must maintain robust internal liquidity coverage buffers to manage sudden changes in market conditions.
13. Strategic Growth Drivers
Untapped Potential in Commercial and SME Lending: The bank’s Commercial & Rural banking business grew by 18.7% YoY, demonstrating its ability to capture higher-yielding credit opportunities in semi-urban areas.
Deepening Group Subsidiary Value Integration: Subsidiary performance continues to provide strong diversification benefits. HDFC AMC achieved an 12.1% YoY increase in quarterly PAT, and broker arm HDFC Securities posted a 28.3% profit uptick to ₹300 crore, highlighting the cross-selling opportunities across the broader group ecosystem.
14. Scenario & Target Analysis
Projections for the Financial Year 2026–2027
1. The Bear Case Scenario
Projected Stock Range: ₹1,450 – ₹1,520
Assumptions: Systemic deposit growth slows down, causing margin compression as funding costs rise, while localized credit issues lead to an increase in corporate slippages.
2. The Base Case Scenario
Projected Stock Range: ₹1,850 – ₹1,950
Assumptions: Loan growth matches deposit expansion at 13–14%, margins stabilize around current levels, and asset quality remains steady.
3. The Bull Case Scenario
Projected Stock Range: ₹2,150 – ₹2,300
Assumptions: A favorable interest rate environment lowers funding costs, retail loan expansion accelerates, and the cost-to-income ratio improves toward 36%.
15. Investor Action Guide
Tailored Strategies for Market Participants
For Short-term Traders
Tactical Approach: Look to build long positions on pullbacks toward the support zone of ₹1,600–₹1,620, using a trailing stop-loss below ₹1,570 to manage short-term downside risk.
For Systematic Long-Term Investors
Tactical Approach: The current valuation offers an attractive entry point to steadily accumulate shares via systematic investment plans (SIP), giving exposure to India’s largest private financial franchise at reasonable multiples.
For Dividend and Value-Focused Portfolios
Tactical Approach: Backed by internal capital buffers and a solid capital adequacy position of 19.57%, the bank is well-positioned to maintain a steady dividend payout policy over the long term.
Regulatory Disclaimer: This article provides objective financial analysis based on official exchange disclosures and public filings. It is intended for educational purposes only and does not constitute personalized investment advice or SEBI-sanctioned stock recommendations.
16. Final Analytical Conclusion
HDFC Bank’s Q1 FY27 performance shows a business entering a phase of stable, long-term growth following major structural transitions. While the headline numbers reflect the base effect of last year’s exceptional subsidiary divestment gains, the normalized profit expansion of 9.8% demonstrates the fundamental strength of the core lending franchise.
Supported by controlled credit costs, stable asset quality metrics, and strong capital adequacy reserves, the bank remains well-positioned to navigate changing credit cycles. For patient long-term investors, the current valuation compression relative to historical averages provides a solid opportunity to gain exposure to India’s long-term financial growth story.