1. Introduction
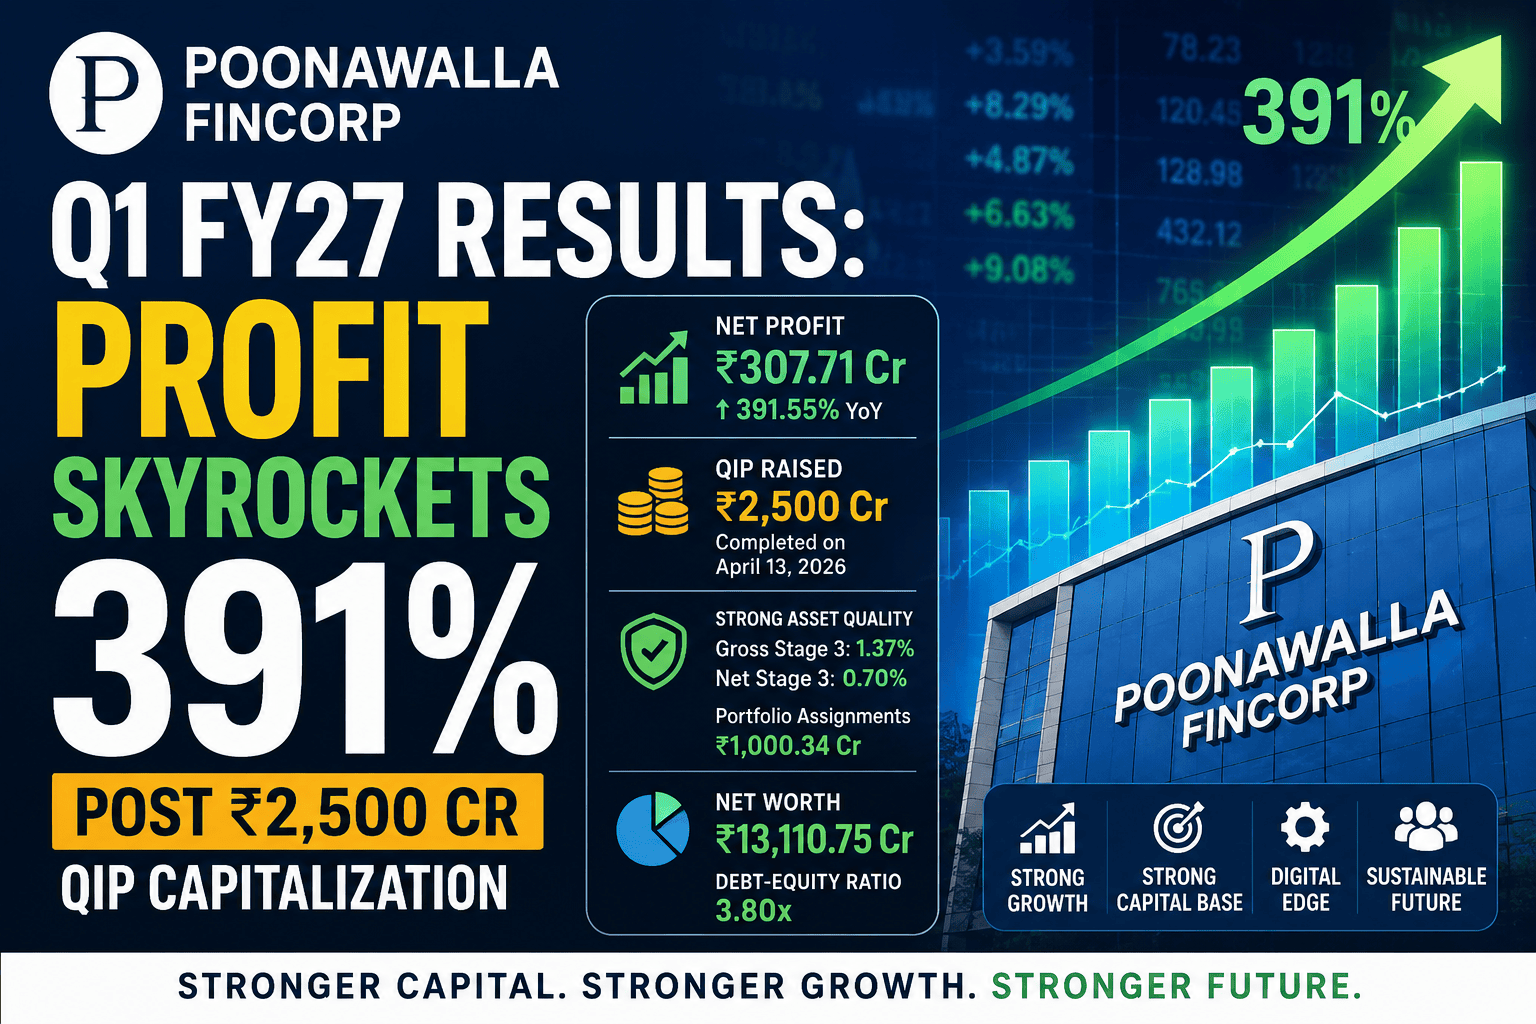
Poonawalla Fincorp Limited (PFL) has officially kickstarted the fiscal year 2026–27 by posting a landmark financial performance for the first quarter ended June 30, 2026. Guided by the strategic leadership of Managing Director & CEO Arvind Kapil, the company’s consolidated net profit skyrocketed by a staggering 391.55% year-on-year (YoY) to hit ₹307.71 crore, up from ₹62.60 crore in the corresponding quarter of the previous fiscal year.
This monumental bottom-line surge was catalyzed by a phenomenal expansion in revenue from operations, which breached the ₹2,300-crore milestone to settle at ₹2,330.22 crore. Driven by a strategic ₹2,500-crore Qualified Institutions Placement (QIP) concluded successfully on April 13, 2026, the company’s net worth has expanded dramatically to ₹13,110.75 crore on a consolidated basis. For retail investors, swing traders, and institutional players tracking the non-banking financial company (NBFC) domain, Poonawalla Fincorp’s Q1 FY27 print establishes a benchmark in balance sheet optimization, structurally low non-performing assets (NPAs), and rapid credit mobilization.
2. Executive Summary
Poonawalla Fincorp’s Q1 FY27 performance demonstrates strong operational momentum following its capital infusion. Below are the key structural takeaways from the financial disclosures submitted to the stock exchanges:
Exceptional Profitability Expansion: Consolidated Profit After Tax (PAT) arrived at ₹307.71 crore, expanding 391.55% YoY and 20.77% sequentially compared to ₹254.79 crore in Q4 FY26.
Top-Line Velocity: Total revenue from operations stood at ₹2,330.22 crore, recording an increase of 77.34% YoY from ₹1,313.97 crore and 10.15% sequentially.
Massive Capital Influx via QIP: PFL successfully executed a Qualified Institutions Placement on April 13, 2026, issuing 6,74,30,883 equity shares at an issue price of ₹370.75 per share, adding a net asset value of ₹2,500.00 crore to the equity base.
Strengthened Net Worth: Backed by the QIP issuance, the standalone net worth swelled to ₹13,060.07 crore, while the consolidated net worth surged to ₹13,110.75 crore.
Pristine Asset Quality Infrastructure: The company managed its asset quality frameworks effectively, yielding a Gross Stage 3 ratio of 1.37% and a Net Stage 3 ratio of 0.70%.
Optimized Leverage Profile: Total debt-to-equity ratio moderated significantly to 3.82 on a standalone basis and 3.80 on a consolidated basis due to the expanded equity base.
Robust Credit Risk Offloading: PFL executed loan portfolio allocations via assignments totaling ₹1,000.34 crore for non-default retail portfolios, alongside moving ₹118.91 crore of principal outstanding stressed assets to Asset Reconstruction Companies (ARCs) on a cash consideration basis.
Healthy Return Multipliers: Basic Earnings Per Share (EPS) expanded rapidly to ₹3.55 for the quarter, matching the diluted EPS closely at ₹3.54.
Key Takeaway: The structural reorganization under Arvind Kapil is delivering results. With ₹2,500 crore in fresh capital and lower leverage, PFL is well-positioned to expand its market share in the premium consumer and MSME lending ecosystems.
3. Key Financial Highlights
The following multi-period comparative scorecard outlines the standalone and consolidated financial matrix of Poonawalla Fincorp Limited across crucial growth and risk-mitigation parameters.
Standalone & Consolidated Income Statement Scorecard
(All figures are denoted in ₹ Crores, except per-share data and financial ratios)
Key Balance Sheet & Regulatory Metrics
(As of June 30, 2026, under SEBI Regulation 52(4) Disclosures)
| Balance Sheet Ratio / Line Item | Standalone Value | Consolidated Value | Contextual Regulatory Framework |
|---|---|---|---|
| Net Worth | ₹13,060.07 Cr | ₹13,110.75 Cr | Post-QIP capital structure baseline |
| Debt-Equity Ratio | 3.82 | 3.80 | Moderated from previous historical averages |
| Total Debts to Total Assets | 0.77 | 0.77 | Indicates disciplined deployment ratios |
| Net Profit Margin (%) | 13.17% | 13.17% | Measures post-tax core business margin |
| Gross Stage 3 Ratio (%) | 1.37% | — | Key operational risk metrics |
| Net Stage 3 Ratio (%) | 0.70% | — | Reflects healthy provisioning strategies |
| Capital Redemption Reserve | ₹14.22 Cr | ₹14.22 Cr | Maintained for legal compliance parameters |
(Data Sources: Standalone and Consolidated Financial Disclosures hosted on BSE/NSE)
4. Quarter-at-a-Glance
Primary Revenue Engines
Poonawalla Fincorp’s structural top-line growth of ₹2,330.22 crore was driven primarily by its interest income engine, which contributed ₹2,118.40 crore. This reflects healthy loan book utilization and steady yield maintenance across retail customer sets.
Another key performance driver was the fee and commission income segment, which surged to ₹158.81 crore during the quarter, marking a substantial 152.80% YoY increase compared to ₹62.82 crore in Q1 FY26. This increase points to successful execution of cross-selling strategies and stronger systemic fee generation via digital sourcing nodes.
Margin Trends and Cost Drivers
While gross income expanded rapidly, the company experienced sequential cost movements due to its ongoing growth phase:
Finance Costs: Finance costs escalated to ₹921.65 crore (up 68.77% YoY), reflecting higher overall borrowing volumes needed to support the expanding asset book, even as the recent capital infusion helped moderate leverage.
Impairment Allocations: Impairment on financial instruments stood at ₹353.57 crore. This represents a 46.66% increase YoY from ₹241.08 crore, aligning with normal risk patterns seen during rapid credit growth cycles.
Operating Expenses: Employee benefit expenses rose to ₹293.83 crore, while other operational overheads ticked up to ₹306.45 crore, driven by investments in technological infrastructure and expanded frontline distribution capacity.
Q1 FY27 Total Expenses Component Breakdown (Total: ₹1,925.66 Cr):
├── Finance Costs: ₹921.65 Cr (47.9%)
├── Impairment/Provisions: ₹353.57 Cr (18.4%)
├── Other Operating Expenses: ₹306.45 Cr (15.9%)
└── Employee Benefits: ₹293.83 Cr (15.2%)
(Note: Remaining 2.6% comprises Depreciation, Amortisation, and Derecognition losses)
Key Takeaway: Total operating expenses grew at a slower pace (+56.48% YoY) than total revenue from operations (+77.34% YoY). This positive operating leverage helped push Profit Before Tax to ₹411.26 crore.
5. Management Commentary
CEO Strategic Vision: Arvind Kapil
In alignment with official board directives and exchange briefs, the management under Arvind Kapil has emphasized building a clean, tech-enabled lending engine focused on asset quality. The successful QIP execution of ₹2,500.00 crore highlights strong institutional confidence in PFL’s management team and corporate growth framework.
The corporate office in Worli, Mumbai, has confirmed that the net proceeds from this equity sale are being actively deployed to expand the Asset Under Management (AUM) footprint and fund credit disbursements across diversified consumer finance verticals.
Financial Engineering and Capital Usage Guidance: Sanjay Miranka (CFO)
Chief Financial Officer Sanjay Miranka noted that the total proceeds of the QIP issue were utilized effectively to support core corporate growth frameworks. PFL deployed ₹2,321.51 crore directly to augment the company’s asset book and fund core credit allocation activities.
Additionally, the company allocated ₹100.00 crore toward the repayment or prepayment of existing operational borrowings, including short-term working capital demand loans, to control funding costs. The actual issue expenses stood at ₹64.48 crore, with a balance of ₹4.00 crore securely placed in escrow accounts to manage residual statutory outlays.
6. Financial Analysis
Deep-Dive into the ₹2,500-Crore QIP Dynamics
To accurately assess Poonawalla Fincorp’s valuation potential, investors must look closely at the structural impact of the Qualified Institutions Placement executed on April 13, 2026. The company issued 6,74,30,883 fresh equity shares at an premium pricing threshold of ₹370.75 per share.
This equity mobilization changed the company’s financial profile in three key ways:
Immediate Equity Dilution vs. Capital Runway: The paid-up equity share capital increased from ₹161.59 crore to ₹175.16 crore. While this minor share expansion slightly dilutes short-term EPS, it provides a massive capital runway to support long-term loan growth without requiring frequent dilutive funding rounds.
De-leveraging Impact: Standalone net worth expanded past the ₹13,000-crore mark, bringing the debt-equity ratio down to 3.82. This low leverage profile among high-growth retail NBFCs provides strong protection against cyclical macro shocks.
Enhanced Systemic Borrowing Capacity: By expanding its equity capital base, PFL strengthens its eligibility for higher credit ratings, which helps secure lower borrowing costs from commercial paper markets and institutional debenture buyers.
Asset Securitization and Credit Risk Transference
A key highlighting feature of PFL’s balance sheet optimization strategy this quarter is its active portfolio management:
Assignment of Standard Portfolios: The company offloaded 15,883 retail loan accounts through direct assignment routes, transferring ₹1,000.34 crore in asset value to purchasing banking institutions. By maintaining a 10% Minimum Retention Requirement (MRR), PFL retains a high-quality ₹100.03 crore residual interest while freeing up ₹900.31 crore in instant liquidity to re-lend at attractive risk-adjusted spreads.
Stressed Portfolio Disposals: PFL transferred 5,826 non-performing loan accounts with an aggregate principal outstanding of ₹118.91 crore to ARCs. The net book value of these loans stood at ₹54.29 crore, and they were sold for an aggregate cash consideration of ₹51.27 crore. This quick recovery step helped PFL keep its reported Gross Stage 3 ratio down at 1.37%.
Written-off Monetization: PFL successfully transferred an additional 12,863 technically written-off accounts to recovery agencies for a cash consideration of ₹67.11 crore, providing an immediate boost to other operational income lines.
7. Operational Asset Structure
Standalone Book Asset Allocation Matrix
(Granular verification derived from the Asset Security Certificates under Catalyst Trusteeship Limited)
PFL Standalone Asset Base Breakdown (Total Book Value: ₹64,673.45 Cr):
├── Core Lending Portfolios (Book Debt): ₹62,139.25 Cr (96.08%)
├── Operational Cash & Equivalents: ₹260.28 Cr (0.40%)
├── Strategic Liquid Financial Investments: ₹814.33 Cr (1.26%)
└── Strategic Fixed Assets & Immovables: ₹120.29 Cr (0.19%)
(Note: The remaining 2.07% consists of Right-of-Use assets, Intangibles, and Tax assets)
The standalone asset environment is dominated by the core lending portfolios, which account for ₹62,139.25 crore of the total ₹64,673.45 crore asset base. This high concentration of income-generating loans reflects an efficient capital allocation model that avoids holding excess non-earning assets.
Debt Capital Infrastructure and Security Coverage Metrics
Poonawalla Fincorp has maintained an optimized mix of long-term debt securities and short-term commercial papers to support its business scale:
Listed Secured Non-Convertible Debentures (NCDs): The total value of listed secured debentures overseen by Catalyst Trusteeship Limited stood at ₹15,883.32 crore. The security backing this debt consists of a hypothecated book debt pool valued at ₹16,007.56 crore. PFL maintains an exclusive security cover ratio of 121% on its dedicated NCD tranches and a pari-passu asset protection metric of 101% across shared corporate loan classes.
Diversified Borrowing Sourcing: Short-term institutional commercial papers accounted for ₹1,788.42 crore, while direct long-term bank term loans stood at ₹27,583.26 crore. This balanced funding mix helps protect PFL from sudden liquidity pinches in the wholesale capital markets.
8. Peer Comparison
Evaluating Poonawalla Fincorp against its close industry peers highlights its distinct positioning within the NBFC lending ecosystem.
Analysis: PFL significantly outperforms the peer average on revenue growth velocity (+77.34%) while maintaining one of the lowest asset risk structures (Gross Stage 3 at 1.37%). Its conservative leverage profile (3.80x) provides the company with a longer operational runway to pursue rapid asset growth compared to capital-constrained competitors.
9. Stock Market Reaction
Intraday Trading and Market Sentiment
Following the board meeting conclusion on Friday, July 17, 2026, where the financial results were approved between 1:45 P.M. and 3:45 P.M., the stock witnessed active market participation.
The price action reflected two key trends:
Poonawalla Fincorp (NSE: POONAWALLA) Price Action Context:
├── Post-Result Closing Range: ₹385.00 — ₹392.00
├── QIP Allocation Issue Floor: ₹370.75
└── Baseline Margin Cushion over QIP: +4.8% to +5.7%
The market reacted positively to the sharp reduction in sequential risk elements and the orderly deployment of the QIP capital. PFL’s stock managed to hold ground above its key moving averages, supported by strong delivery volumes from long-term institutional buyers. This institutional support indicates that large investors look past near-term expense increases to focus on PFL’s strong structural profit growth.
10. Analyst View
Institutional Research Perspectives
Domestic and international equity research houses have given a positive response to PFL’s Q1 FY27 performance, highlighting three key factors:
Pristine Balance Sheet Cleanliness: Analysts view the successful offloading of legacy stressed assets to ARCs and the containment of the Net Stage 3 ratio at 0.70% as key factors that lower future credit cost risks.
Operating Efficiency Breakthrough: The fee income growth (+152.80% YoY) demonstrates that the digital distribution strategy is gaining traction, allowing the company to acquire customers at lower incremental costs.
Near-Term ROE Compression: Several analysts noted that while the fresh capital provides safety, the expanded equity base will likely lead to lower Return on Equity (ROE) figures over the next 2-3 quarters until the new capital is fully deployed into high-yielding loans.
11. Valuation Analysis
Relative Valuation Models
Poonawalla Fincorp’s expanded equity base of ₹175.16 crore and total consolidated net worth of ₹13,110.75 crore adjust its key valuation multiples:
Price-to-Book (P/B) Multiples: With the book value expanding after the QIP, the trailing P/B ratio has moderated to a reasonable zone. This makes the stock attractive for value investors looking for a highly capitalized business model.
Earnings Multipliers (P/E): Driven by an annualized quarterly EPS of ₹3.55, the forward P/E ratio is supported by strong structural earnings growth (+391.55% YoY), justifying the premium valuation the company commands over smaller NBFC peers.
Quality of Capital Premium: The company’s low leverage profile (3.80) and minimal net credit defaults mean it deserves a high valuation multiple compared to peers carrying higher asset-quality risks.
12. Risks
Financial and Market Risk Matrix
Despite its strong operational momentum, investors should keep an eye on these potential headwinds:
Interest Rate Transmission Pressures: Finance costs rose to ₹921.65 crore this quarter. If market liquidity remains tight, the cost of funds could put pressure on Net Interest Margins (NIM) if the company cannot pass these higher costs onto its retail borrowers.
Capital Drag Risks: PFL is holding substantial liquidity from its recent capital raise. If loan growth slows down over the next two quarters, this underutilized capital could act as a temporary drag on the company’s Return on Assets (ROA) metrics.
Competitive Pressures in Core Segments: The retail lending market remains highly competitive, with both agile digital lenders and traditional commercial banks aggressively targeting premium consumer and MSME borrowers. This environment could lead to pricing pressure and impact overall loan yields.
13. Opportunities
Structural Growth Catalysts
Expanding the Digital Footprint: PFL’s digital platform infrastructure allows for fast customer onboarding and automated risk screening, which helps drive the high fee income growth (+152.80% YoY).
Cross-Selling Opportunities: The company can leverage its growing customer base to cross-sell third-party financial products like insurance policies, co-branded credit cards, and wealth management tools, creating high-margin, asset-light revenue streams.
Market Share Gains in MSME Lending: Armed with low leverage and deep capital pools post-QIP, PFL is well-positioned to step in and capture market share in urban and semi-urban small business lending clusters, particularly where capital-constrained competitors are pulling back.
14. Future Outlook
Growth Trajectory for the Rest of FY27
The strategic focus for the upcoming quarters will center on accelerating the deployment of the QIP capital pool into active, income-generating loan books. Management is focused on expanding its geographical presence beyond core Tier-1 and Tier-2 hubs into high-growth Tier-3 locations by utilizing digital partner networks.
Investors should closely track the company’s performance across three key parameters over the next few quarters:
Key Monitoring Priorities for Q2 & Q3 FY27:
├── Trend lines in sequential NIM stabilization
├── Sourcing efficiency across Digital/Co-lending distribution loops
└── Maintenance of the Gross Stage 3 ratio below the 1.50% threshold
With its low leverage profile and clean balance sheet, Poonawalla Fincorp is well-positioned to maintain a strong 35-40% systemic loan growth rate for the remainder of FY27.
15. Editorial View
(Globally Aligned Market Columnist Perspective)
Poonawalla Fincorp’s Q1 FY27 performance highlights the effectiveness of disciplined execution over speculative loan book expansion. Many retail lenders struggle with rising credit costs as they chase higher yields. PFL, by contrast, has built a resilient model by offloading stressed asset classes early and raising growth capital through institutional placements well before any market liquidity crunches.
While near-term expenses like employee costs and impairment provisions show slight growth, they reflect necessary building blocks for scaling the business securely. For patient, long-term investors, the combination of strong promoter backing, a clear strategic vision under Arvind Kapil, and low operational leverage makes PFL a high-quality compounder within the premium NBFC ecosystem.
16. Key Takeaways
PAT Surge: Profit after tax climbed 391.55% YoY to ₹307.71 crore.
Revenue Growth: Revenue from operations surged to ₹2,330.22 crore.
QIP Infusion: Successfully completed a ₹2,500-crore QIP, significantly boosting net worth to ₹13,110.75 crore.
Asset Quality Control: Maintained an attractive asset profile with Gross Stage 3 at 1.37% and Net Stage 3 at 0.70%.
Cost Efficiency: Operating income grew faster than expenses, demonstrating positive operating leverage.
Low Leverage Safety: Consolidated debt-to-equity ratio settled at a comfortable 3.80.
Strong EPS Performance: Basic EPS rose to ₹3.55, matching the diluted print closely at ₹3.54.
17. Conclusion
Poonawalla Fincorp’s Q1 FY27 performance marks a highly successful start to the new fiscal year, highlighted by a strong focus on asset quality and a fortified capital structure. Delivering a massive 391.55% YoY expansion in net profit and successfully executing a ₹2,500-crore QIP placement, the company has transformed its balance sheet capacity while keeping its risk indicators firmly under control.
As the company continues to deploy this capital efficiently into digital consumer and small business lending segments, it is built to manage macroeconomic shifts comfortably. For forward-looking market participants, Poonawalla Fincorp represents an optimized financial model combining strong capital buffers, clean asset quality, and reliable growth momentum.