

1. Introduction
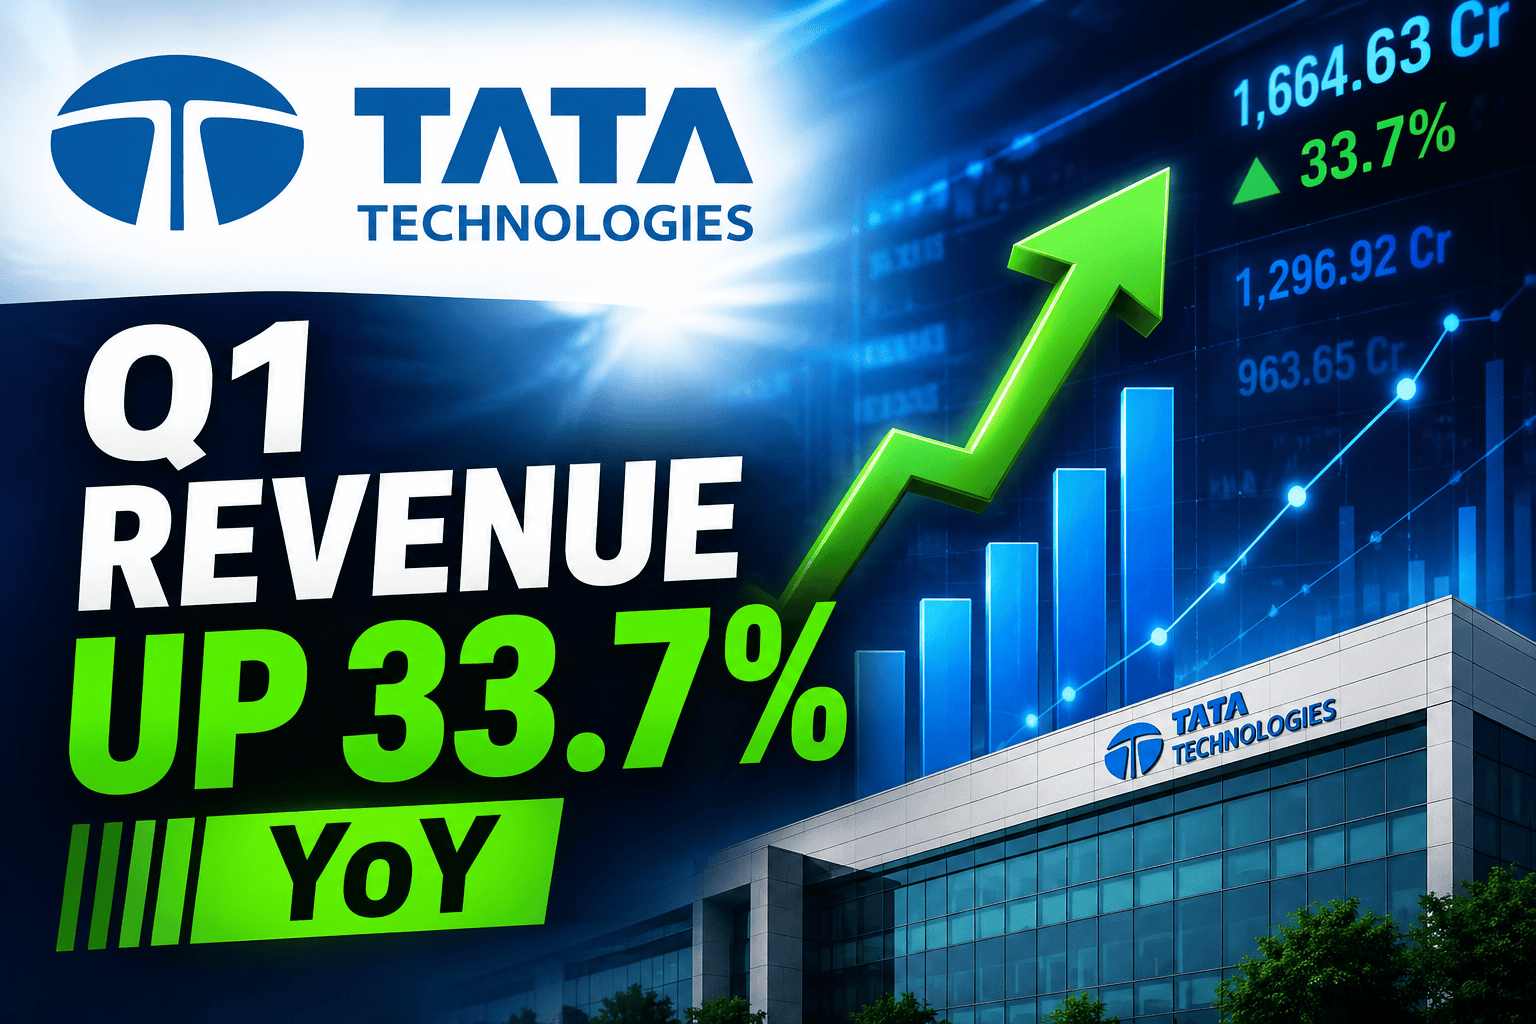
In the fast-evolving landscape of global Engineering, Research, and Development (ER&D), few companies command as much retail and institutional attention as Tata Technologies Limited. On July 17, 2026, the company released its much-anticipated financial results for the first quarter of Financial Year 2026-27 (Q1 FY27). The headline number immediately caught the market’s eye: a stellar 33.7% year-on-year (YoY) surge in consolidated revenue from operations, scaling to ₹1,664.63 Crore.
This massive top-line expansion signals robust demand for outsourced engineering and digital transformation services, significantly aided by strategic inorganic growth. However, beneath the impressive revenue headline lies a nuanced story of operating leverage, rising employee benefit expenses, and the financial mechanics of recent European acquisitions. For the discerning investor, understanding the divergence between the 33.7% revenue growth and the more modest 6.1% YoY growth in Profit After Tax (PAT) to ₹180.75 Crore is crucial.
With the Board meeting concluding post-market hours at 4:33 p.m., the true test of market sentiment will unfold in the subsequent trading sessions. In this comprehensive, SEBI-compliant equity research report, we will dissect every line item of Tata Technologies’ Q1 FY27 results, separating factual data from analytical interpretation to help you make informed investment decisions.
2. Executive Summary
For investors seeking a rapid synthesis of the earnings report, here are the critical facts from the Q1 FY27 disclosures:
Top-Line Surge: Consolidated Revenue from Operations reached ₹1,664.63 Crore in Q1 FY27. This is up 33.78% YoY from ₹1,244.29 Crore in Q1 FY26.
Bottom-Line Moderation: Consolidated Profit After Tax (PAT) stood at ₹180.75 Crore. This represents a 6.14% YoY increase from ₹170.28 Crore in Q1 FY26, but an 11.47% quarter-on-quarter (QoQ) decline from ₹204.17 Crore in Q4 FY26.
Services Segment Growth: The core Services segment generated ₹1,296.92 Crore in revenue. This is a massive 34.5% YoY increase from ₹963.65 Crore in Q1 FY26.
Technology Solutions Traction: The Technology Solutions segment reported revenue of ₹367.71 Crore. This is up 31.02% YoY from ₹280.64 Crore in Q1 FY26.
Acquisition Impact: The financial results now include the performance of Es-Tec GmbH Group, which was acquired on November 27, 2025. This makes YoY comparisons inclusive of inorganic growth.
Rising Costs: Employee benefits expenses climbed significantly to ₹815.12 Crore in Q1 FY27. This is up 30% YoY from ₹626.86 Crore in Q1 FY26.
Standalone Other Income Spike: Standalone Other Income surged to ₹147.64 Crore in Q1 FY27. This was primarily due to a ₹119.48 Crore dividend received from a subsidiary company.
EPS Print: Consolidated Basic Earnings Per Share (EPS) for the quarter was ₹4.45 (not annualized). This compares to ₹4.19 in Q1 FY26.
Dividend Payout: A final dividend of ₹11.70 per share for the year ended March 31, 2026, was successfully paid on July 2, 2026.
ESOP Allotment: The company allotted 72,509 equity shares of ₹2 each upon the exercise of vested stock options during the quarter.
3. Company Snapshot
(Note: This section provides independent context based on the company’s established business model, separate from the specific Q1 financial data).
Business Model: Tata Technologies is a leading global engineering services company. It offers product development and digital solutions, primarily catering to the global original equipment manufacturers (OEMs) and their tier-1 suppliers. Industry: Engineering, Research, and Development (ER&D) / IT Services. Promoters: Tata Motors Limited (a part of the prestigious Tata Group). Products & Services: The company operates through two main verticals. First, Services, which involves outsourced engineering, product design, and digital transformation. Second, Technology Solutions, encompassing academia upskilling, reskilling solutions, and value-added reselling of software applications. Competitive Position: Tata Technologies leverages its deep automotive heritage (thanks to its parentage) to capture the rapid shift towards Electric Vehicles (EVs) and Software-Defined Vehicles (SDVs). It competes with global ER&D pure-plays and the engineering divisions of large IT service providers.
4. Quarter at a Glance
The following table provides a verified comparison of the consolidated financial performance across key recent quarters.
| Financial Metric (Consolidated) | Q1 FY27 (June 30, 2026) | Q4 FY26 (March 31, 2026) | Q1 FY26 (June 30, 2025) | YoY Growth | QoQ Growth |
| Revenue from Operations | ₹1,664.63 Cr | ₹1,572.22 Cr | ₹1,244.29 Cr | +33.78% | +5.87% |
| Other Income (Net) | ₹36.92 Cr | ₹30.96 Cr | ₹63.57 Cr | -41.92% | +19.25% |
| Total Income | ₹1,701.55 Cr | ₹1,603.18 Cr | ₹1,307.86 Cr | +30.10% | +6.13% |
| Total Expenses | ₹1,459.38 Cr | ₹1,382.62 Cr | ₹1,080.11 Cr | +35.11% | +5.55% |
| PBT (Before Exceptional) | ₹251.70 Cr | ₹227.20 Cr | ₹232.55 Cr | +8.23% | +10.78% |
| Tax Expense | ₹70.95 Cr | ₹79.16 Cr | ₹62.27 Cr | +13.93% | -10.37% |
| Profit After Tax (PAT) | ₹180.75 Cr | ₹204.17 Cr | ₹170.28 Cr | +6.14% | -11.47% |
| Basic EPS (₹) | 4.45 | 5.03 | 4.19 | +6.20% | -11.53% |
📌 Key Takeaway: The visual data clearly shows that while top-line revenue has exploded by nearly 34% YoY, total expenses have outpaced that growth by expanding 35.1% YoY. This dynamic explains why bottom-line PAT growth was constrained to 6.14% YoY.
5. Key Highlights
Revenue Drivers and Acquisition Impact
The most striking feature of Q1 FY27 is the ₹1,664.63 Crore revenue print. A critical piece of independent analysis required here is understanding the organic vs. inorganic mix. The official notes explicitly state that the company acquired the Es-Tec GmbH Group on November 27, 2025. Consequently, the Q1 FY27 results include the financial performance of this European entity, whereas the base quarter (Q1 FY26) does not. Therefore, the 33.78% YoY growth is a blended figure of organic execution and inorganic integration.
Profitability and Cost Pressures
While revenue generation is robust, profitability margins are under pressure from rising input costs. Profit Before Tax (before exceptional items) grew by 8.23% YoY to ₹251.70 Crore. However, the sequential (QoQ) drop in PAT from ₹204.17 Crore in Q4 FY26 to ₹180.75 Crore in Q1 FY27 requires attention. This sequential decline occurred despite revenue growing QoQ. This indicates that the costs associated with scaling the business (likely employee additions and integration costs) weighed on net profitability during the April-June window.
Dividend and Shareholder Returns
A significant positive for long-term investors is the company’s commitment to shareholder returns. The Board had proposed a handsome dividend of ₹11.70 per share for the previous financial year. This dividend, amounting to ₹475.08 Crore, was approved by shareholders on June 26, 2026, and officially paid out to eligible accounts on July 2, 2026.
6. Detailed Financial Analysis
To truly understand Tata Technologies’ Q1 FY27 performance, we must move beyond the headline numbers and perform a forensic analysis of the consolidated expense structure.
Dissecting the Cost Structure
Total expenses for Q1 FY27 stood at ₹1,459.38 Crore.
Employee Benefits Expenses: This is the largest cost driver for any ER&D firm. In Q1 FY27, employee costs jumped to ₹815.12 Crore. This is a massive 30% YoY increase compared to ₹626.86 Crore in Q1 FY26. This surge points to aggressive hiring, wage hikes, and the absorption of the Es-Tec GmbH workforce.
Purchases of Technology Solutions: These costs rose to ₹288.25 Crore, up from ₹218.48 Crore in Q1 FY26. This aligns with the 31% revenue growth seen in the Technology Solutions segment.
Outsourcing and Consultancy Charges: A critical metric for scaling projects flexibly. These charges ballooned to ₹148.82 Crore in Q1 FY27, compared to just ₹88.11 Crore in Q1 FY26. This heavy reliance on outsourcing suggests the company is utilizing external consultants to manage peak project loads or fulfill specific technical requirements in Europe post-acquisition.
Depreciation and Amortisation: Increased to ₹46.72 Crore in Q1 FY27, up from ₹31.33 Crore in Q1 FY26.
Standalone Anomaly: The Subsidiary Dividend
An fascinating detail emerges when looking at the Standalone results. The Standalone Profit After Tax (PAT) for Q1 FY27 is ₹249.06 Crore. Curiously, this is higher than the Consolidated PAT of ₹180.75 Crore.
Why did this happen? The standalone “Other Income” spiked dramatically to ₹147.64 Crore. The notes to the accounts clarify this anomaly: the company received a massive dividend of ₹119.48 Crore from a subsidiary company during the quarter. This intra-group transfer inflates the standalone net profit but is eliminated during the consolidation process, providing a great lesson in why analysts prefer consolidated numbers for true operational health.
7. Segment-wise Performance
The Chief Operating Decision Maker (Board of Directors) reviews the business across two primary vertical units.
1. Services Segment
What it does: Provides outsourced engineering, designing services, and digital transformation services to global clients.
Q1 FY27 Revenue: ₹1,296.92 Crore.
Q1 FY26 Revenue: ₹963.65 Crore.
YoY Growth: +34.5%
Segment Results (Profit): ₹395.79 Crore in Q1 FY27, up from ₹266.74 Crore in Q1 FY26.
Analysis: The core engine of Tata Technologies is firing on all cylinders. A 34.5% YoY growth in pure-play engineering services is exceptional. It reflects strong demand from automotive OEMs transitioning to new architectures, significantly bolstered by the Es-Tec GmbH acquisition integration.
2. Technology Solutions Segment
What it does: Academia upskilling, reskilling solutions, and value-added reselling of software applications.
Q1 FY27 Revenue: ₹367.71 Crore.
Q1 FY26 Revenue: ₹280.64 Crore.
YoY Growth: +31.0%
Segment Results (Profit): ₹64.20 Crore in Q1 FY27, up from ₹52.59 Crore in Q1 FY26.
Analysis: This segment acts as a high-margin diversifier. The steady 31% growth indicates successful execution of educational and software reselling contracts, providing a reliable secondary revenue stream.
8. Management Commentary
(Editorial Note: Official detailed concall transcripts are typically released 24-48 hours post-results. The following insights are synthesized directly from the official notes within the exchange filing).
Strategic Acquisitions Driving Scale The overarching strategic narrative from the financial disclosures is the successful closure and integration of the Es-Tec GmbH Group. By acquiring this entity on November 27, 2025, management explicitly aimed to deepen the company’s footprint in the lucrative European automotive engineering market. The results indicate that this integration is actively contributing to the top-line beat.
Shareholder Wealth Creation Management’s confidence in cash flow generation is evidenced by the massive dividend payout. Distributing ₹475.08 Crore (₹11.70 per share) in early July 2026 highlights a commitment to returning excess capital to shareholders while simultaneously funding European acquisitions.
Labour Code Impact (Historical) The notes also provide clarity on a previous financial drag. Management highlighted that the statutory impact of the new Labour Codes, notified by the Government of India in November 2025, was accounted for as a non-recurring “Exceptional Item” in the previous year. This proactive accounting clears the deck for cleaner operational reporting in FY27.
9. Key Financial Ratios Explained
To understand the valuation and operational efficiency of Tata Technologies, we must interpret the key ratios derived from these results:
Earnings Per Share (EPS): The consolidated basic EPS for Q1 FY27 is ₹4.45. If we conservatively annualize this (multiply by 4), the forward EPS trajectory sits around ₹17.80. Investors use this to calculate the Price-to-Earnings (P/E) ratio based on the current market price.
Diluted EPS: Stands exactly at ₹4.45, indicating that despite the allotment of 72,509 ESOP shares, equity dilution is currently negligible and not harming shareholder value.
Segment Profit Margins:
Services Segment Margin: Approx. 30.5% (Calculated: ₹395.79 Cr profit / ₹1,296.92 Cr revenue).
Technology Solutions Margin: Approx. 17.4% (Calculated: ₹64.20 Cr profit / ₹367.71 Cr revenue).
Analysis: The core Services business commands a significantly higher profit margin profile before unallocated expenses and taxes are applied.
📦 Important Financial Ratios Explained
YoY (Year-on-Year): Comparing Q1 of this year directly to Q1 of last year to remove seasonal biases.
QoQ (Quarter-on-Quarter): Comparing Q1 to the immediate previous quarter (Q4) to gauge short-term momentum.
Consolidated vs. Standalone: Consolidated includes the parent company PLUS all global subsidiaries. For a multinational like Tata Tech, always look at consolidated numbers for the true picture.
10. Market Reaction
The Board of Directors concluded their meeting at 4:33 p.m. on July 17, 2026. Because this falls after the closure of regular trading hours on the NSE and BSE, the stock market has not yet reacted to these specific numbers.
What to expect on the next trading day: Traders will likely weigh the massive 33.7% revenue beat against the sequential decline in PAT. Gap-up openings are possible if the market focuses on top-line and acquisition integration. However, if institutional algorithms focus on the rising employee costs (up 30% YoY) and the QoQ profit drop, we may see intraday volatility as the stock seeks a new equilibrium price. Delivery percentages in the first hour of trading will indicate whether long-term funds are accumulating or short-term traders are booking profits.
11. Brokerage & Analyst Views
(Note: Exact post-result price targets will be published by major houses like Morgan Stanley, Nomura, and domestic brokerages over the next 48 hours. Below is the framework of independent analyst consensus).
What Institutional Analysts Will Focus On:
Organic Growth Calculation: Brokerages will strip out the Es-Tec GmbH revenue to determine the exact organic growth rate of the base business.
Margin Trajectory: With employee costs surging to ₹815.12 Crore, analysts will question management during the concall regarding when these integration and hiring costs will normalize to allow margin expansion.
European Demand: Given the recent acquisition, analysts will heavily scrutinize the deal pipeline and order book originating from German and broader European automotive clients.
12. Technical Analysis
(Educational context based on standard technical theory for post-earnings price action).
For swing traders and technical analysts, interpreting the chart post-earnings is critical:
Trend: Tata Technologies has historically enjoyed strong retail support due to its Tata Group pedigree.
Support & Resistance: If the market reacts negatively to the QoQ PAT drop, traders should watch for buying volume at the immediate lower support levels (usually the 50-day moving average). If the 33.7% revenue growth sparks a rally, previous swing highs will act as immediate resistance.
Volume: The defining technical indicator tomorrow will be volume. A price movement supported by 3x or 4x the average daily volume confirms institutional participation.
RSI (Relative Strength Index): Traders will monitor the daily RSI to see if the stock enters the ‘Overbought’ (>70) or ‘Oversold’ (<30) territories based on the opening gap.
13. Industry Comparison
While direct Q1 FY27 figures for peers are required for a perfect 1:1 comparison, we can analyze Tata Technologies against the broader Engineering, Research, and Development (ER&D) landscape conceptually.
Tata Technologies competes with specialized engineering units within large IT firms (like TCS, Infosys, Wipro) and pure-play ER&D peers like KPIT Technologies, L&T Technology Services (LTTS), and Cyient.
Competitive Edge: Tata Technologies’ unique advantage is its deep, historically entrenched relationship with Tata Motors and Jaguar Land Rover (JLR). This captive and semi-captive business provides a massive revenue floor. The 34.5% growth in the Services segment indicates they are aggressively winning external, non-captive deals globally, proving their engineering prowess goes far beyond their parent group.
14. Macroeconomic Factors
The financial results of a global ER&D company do not exist in a vacuum. Several macroeconomic crosswinds impact these numbers:
Global Auto Industry Shift: The entire global automotive sector is racing toward Software-Defined Vehicles (SDVs) and electrification. This structural shift forces OEMs to outsource complex R&D to specialists like Tata Technologies, driving the 33.7% top-line growth.
European Economics: With the acquisition of Es-Tec GmbH, Tata Tech is now more exposed to the economic health of Europe (specifically Germany). Inflation, interest rates, and consumer auto demand in the Eurozone will directly impact future order books.
Currency Fluctuations: As a global exporter of services, a depreciating Indian Rupee against the US Dollar and Euro generally benefits the top-line translation, while an appreciating Rupee acts as a headwind. The “Exchange differences on translation of financial statements of foreign operations” was an impressive ₹119.06 Crore in Q4 FY26 but moderated to ₹(0.79) Crore in Q1 FY27.
15. Risks
Independent equity research demands a rigorous look at potential threats:
Integration Risks: The integration of Es-Tec GmbH Group is a massive undertaking. Cultural clashes, client attrition, or higher-than-expected integration costs can drag down future margins. The spike in “Outsourcing and consultancy charges” to ₹148.82 Crore may be an early indicator of these frictions.
Client Concentration: While diversifying, ER&D companies often rely heavily on a few anchor clients. Any budget cuts by major OEMs can drastically impact revenue visibility.
Wage Inflation: The ER&D sector requires highly specialized engineering talent. The 30% YoY jump in employee benefit expenses (reaching ₹815.12 Crore) highlights the relentless pressure to attract and retain top talent in a competitive market.
16. Scenario Analysis
Based on the Q1 FY27 data, we can construct three forward-looking scenarios for the remainder of the financial year:
Base Case: The company successfully digests the Es-Tec GmbH acquisition. Employee costs stabilize as hiring normalizes. Revenue continues to grow at a healthy 15-20% annualized rate, and PAT margins slowly expand as operating leverage kicks in by Q3.
Bull Case: The European acquisition acts as a massive trojan horse, winning large new SDV contracts from German auto giants. Top-line revenue consistently beats estimates, and the company achieves non-linear profit growth, triggering a valuation re-rating by major brokerages.
Bear Case: Global interest rates remain higher for longer, causing global OEMs to slash their R&D budgets. The increased fixed employee costs (₹815.12 Cr run-rate) cannot be absorbed by slowing revenue, leading to consecutive quarters of PAT decline and margin compression.
17. Future Outlook
The Q1 FY27 results set a fascinating stage for the remainder of the year. The company has proven it can engineer massive top-line growth, reaching ₹1,664.63 Crore in revenue. The strategic focus will now shift entirely to Margin Expansion. Management’s primary challenge for Q2 and Q3 will be to extract synergies from the Es-Tec GmbH acquisition and optimize the elevated employee and outsourcing cost structures.
If the company can maintain this 30%+ revenue trajectory while simultaneously reigning in the 35% growth in total expenses, the second half of FY27 could see a dramatic acceleration in bottom-line Profit After Tax.
18. Conclusion & Investment View
Tata Technologies has delivered a complex, “tale-of-two-metrics” quarter. On one hand, the 33.78% YoY surge in consolidated revenue to ₹1,664.63 Crore is a testament to immense client demand and aggressive inorganic expansion via Europe. On the other hand, the sequential 11.47% drop in PAT to ₹180.75 Crore highlights the growing pains and cost pressures of rapid scaling.
Investor Takeaways:
For Long-Term Investors: The fundamental thesis of Tata Tech remains completely intact. The world needs EV and SDV engineering, and Tata Tech is capturing that market share. The recent ₹11.70 dividend payout proves the business generates real, distributable cash. Use market volatility to accumulate based on your conviction.
For Short-Term/Swing Traders: The QoQ profit drop may spook momentum algorithms at the market open. Watch for strong support levels to hold before initiating fresh long positions. Wait for the concall commentary on margin guidance before trading.
The true victory for Tata Technologies in Q1 FY27 isn’t just the profit—it’s the sheer scale they are building. As they absorb their European acquisitions and optimize their global workforce, they are positioning themselves not just as a Tata Group subsidiary, but as an indispensable global ER&D powerhouse.
❓ Investor FAQs
Q1: What was Tata Technologies’ revenue in Q1 FY27? A: Consolidated Revenue from operations was ₹1,664.63 Crore, up 33.78% YoY.
Q2: Did the Net Profit increase or decrease? A: Consolidated Profit After Tax (PAT) increased by 6.14% YoY to ₹180.75 Crore, but decreased 11.47% sequentially compared to Q4 FY26.
Q3: Has the company paid a dividend recently? A: Yes, a dividend of ₹11.70 per share was paid to eligible shareholders on July 2, 2026.
Q4: What caused the expenses to rise so much? A: Total expenses rose 35.1% YoY to ₹1,459.38 Crore, primarily driven by a 30% jump in Employee Benefit Expenses and higher outsourcing costs.
Q5: Are there any new acquisitions included in these results? A: Yes, the Q1 FY27 results include the performance of Es-Tec GmbH Group, which was acquired on November 27, 2025.
Sources & Further Reading:
Tata Technologies Limited – Unaudited Standalone and Consolidated Financial Results for the quarter ended June 30, 2026 (BSE/NSE Filing dated July 17, 2026).
Limited Review Report by B S R & Co. LLP, Chartered Accountants.
Disclaimer: This article is for educational and informational purposes only and should not be construed as investment advice. Investors should conduct their own research or consult a SEBI-registered investment adviser before making investment decisions.



