

1. Introduction
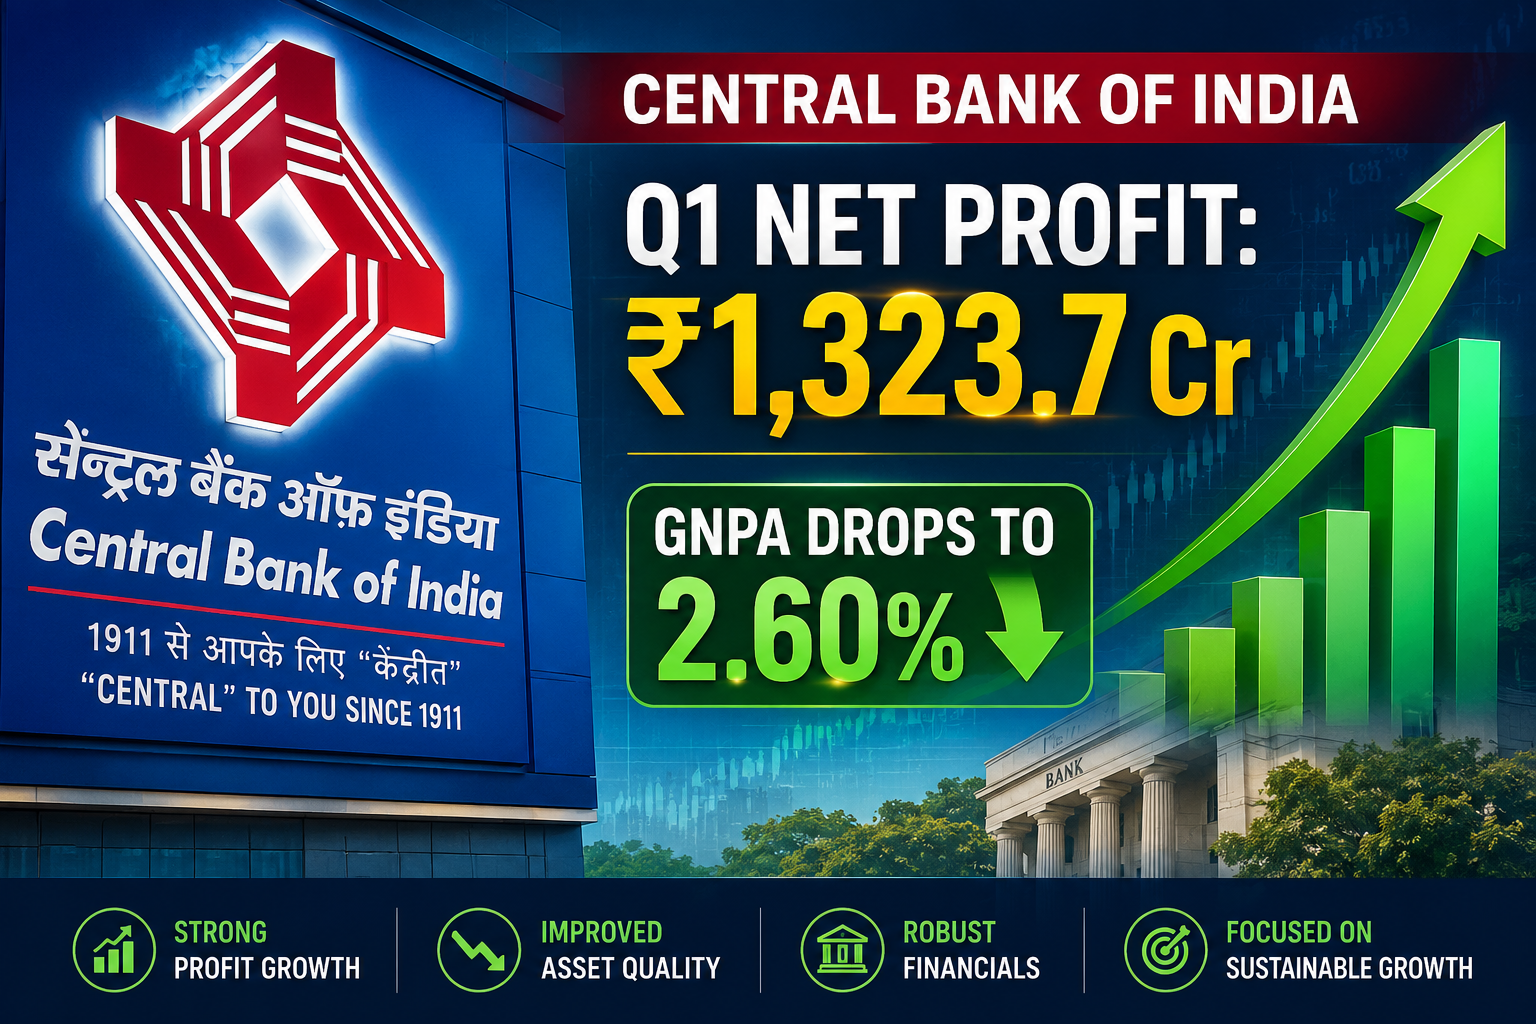
The Central Bank of India has commenced its fiscal year 2026–27 with a robust declaration of financial health, reporting a Standalone Net Profit of ₹1,32,370 lakh for the quarter ended June 30, 2026. In a macroeconomic environment demanding stringent asset quality and operational efficiency, the state-owned lender demonstrated resilient structural cash generation and a significant improvement in core asset health parameters. Most notably, the bank’s Gross Non-Performing Assets (GNPA) ratio improved to a highly manageable 2.60%, accompanied by a Net NPA ratio of just 0.49%. As public sector banks (PSBs) continue to reclaim market share through aggressive retail expansion and digital co-lending partnerships, this earnings report serves as a critical barometer for the sector’s trajectory in FY27.
2. Executive Summary
For investors and market participants seeking a rapid synthesis of the earnings report, here are the most critical takeaways from the Q1 FY27 financial disclosures:
Net Profit Surge: The bank posted a Standalone Net Profit of ₹1,32,370 lakh for Q1 FY27.
Topline Revenue: Total Income for the quarter reached ₹10,67,799 lakh.
Asset Quality Milestone: Gross Non-Performing Assets (GNPA) stood at 2.60%.
Net NPA: Net Non-Performing Assets (NNPA) remained stable and low at 0.49%.
Robust Provisioning: The Provision Coverage Ratio (PCR) was reported at a strong 95.86%.
Operating Margin: The bank achieved an Operating Margin of 20.47% during the quarter.
Capital Adequacy: Basel III CET 1 Ratio stood at a healthy 18.28%.
Retail Banking Dominance: The Retail Banking Operations segment generated a substantial profit of ₹1,37,710 lakh.
Wholesale Banking Headwinds: The Wholesale Banking Operations segment reported a loss of ₹13,914 lakh.
Government Holding: The Government of India’s shareholding in the bank was reported at 81.19%.
3. Company Snapshot
Business Overview: Central Bank of India, “Central to you since 1911”, is one of the oldest and most prominent commercial public sector banks in India. With a massive geographical footprint across the country, the bank provides a comprehensive suite of financial services, catering to individuals, agricultural enterprises, MSMEs, and large corporate entities.
Major Business Segments: As per regulatory filings, the bank classifies its core operations into distinct primary segments. These include Treasury Operations, Retail Banking Operations, and Wholesale Banking Operations. This segmentation allows for targeted capital allocation and risk management across different borrower profiles.
Market Position & Recent Strategic Developments: The bank operates with a massive standalone asset base of ₹5,57,01,115 lakh as of June 30, 2026. In recent quarters, the institution has aggressively pursued digital transformation and partnership models. A key strategic development is its aggressive participation in Co-Lending Arrangements (CLAs). During the first quarter of FY27 alone, the bank purchased 41,268 accounts under revised co-lending arrangements, with an outstanding amount of ₹35,014 lakh. This pivot towards co-lending, particularly in the retail and agriculture sectors, highlights the management’s strategy to expand credit reach while optimizing risk weightages.
4. Q1 FY27 Results at a Glance
The following table provides a clear, quarter-on-quarter (QoQ) and year-on-year (YoY) comparison of Central Bank of India’s standalone financial metrics. (Note: Financial figures are presented in ₹ Lakhs as per the official SEBI filing).
| Financial Metric | Q1 FY27 (June 30, 2026) | Q4 FY26 (Mar 31, 2026) | Q1 FY26 (June 30, 2025) |
| Total Income | ₹10,67,799 lakh | ₹10,81,049 lakh | ₹10,35,952 lakh |
| Interest Earned | ₹9,69,090 lakh | ₹9,66,067 lakh | ₹8,58,854 lakh |
| Other Income | ₹98,709 lakh | ₹1,14,982 lakh | ₹1,77,098 lakh |
| Operating Profit | ₹2,18,607 lakh | ₹2,09,612 lakh | ₹2,30,398 lakh |
| Net Profit | ₹1,32,370 lakh | ₹72,443 lakh | ₹1,16,869 lakh |
| Basic EPS (₹) | ₹1.46 | ₹0.80 | ₹1.29 |
| Gross NPA (%) | 2.60% | 2.67% | 3.13% |
| Net NPA (%) | 0.49% | 0.49% | 0.49% |
| Return on Assets (ROA) | 1.00% | 0.56% | 1.02% |
| Operating Margin (%) | 20.47% | 19.39% | 22.24% |
| Net Profit Margin (%) | 12.40% | 6.70% | 11.28% |
Key Takeaway: The bank demonstrated exceptional sequential growth in bottom-line profitability, with Net Profit surging from ₹72,443 lakh in Q4 FY26 to ₹1,32,370 lakh in Q1 FY27.
5. Detailed Financial Analysis
Revenue Growth & Income Drivers
The bank’s total income for the quarter stood at ₹10,67,799 lakh. The primary engine of this revenue was Interest Earned, which reached ₹9,69,090 lakh. This marks a strong year-on-year growth trajectory when compared to the ₹8,58,854 lakh recorded in the corresponding quarter of the previous year (Q1 FY26).
Digging deeper into the interest components, Interest/discount on advances/bills contributed ₹6,75,604 lakh. Income on investments also provided a robust cushion, bringing in ₹2,64,531 lakh during the quarter. However, Other Income saw a notable contraction, falling to ₹98,709 lakh in Q1 FY27 from ₹1,77,098 lakh in Q1 FY26. This segment includes critical non-interest revenues such as fees, foreign exchange earnings, and recovery in written-off accounts. Specifically, recovery in written-off accounts accounted for ₹17,926.96 lakh, representing 1.68% of the total income.
Expenditure & Operating Efficiency
On the expenditure side, Total Expenditure (excluding provisions and contingencies) was contained at ₹8,49,192 lakh. Interest Expended was the largest outflow, amounting to ₹5,77,660 lakh.
Operating Expenses, a key metric for banking efficiency, stood at ₹2,71,532 lakh. Within this, employee costs accounted for ₹1,75,869 lakh, while other operating expenses consumed ₹95,663 lakh. The bank’s ability to manage its operating expenses effectively resulted in a solid Operating Profit (profit before provisions & contingencies) of ₹2,18,607 lakh. The Operating Margin for the quarter was a healthy 20.47%.
Asset Quality & Provisioning
Asset quality remains the cornerstone of any banking analysis. Central Bank of India has shown commendable discipline in cleaning up its balance sheet. The Gross Non-Performing Assets (GNPA) amount stood at ₹9,22,545 lakh. As a percentage of total advances, GNPA improved to 2.60%, down from 2.67% in the previous quarter and a significant drop from 3.13% a year ago.
The Net Non-Performing Assets (NNPA) amount was strictly controlled at ₹1,71,482 lakh. The NNPA ratio remained flat at an impressive 0.49%. This low NNPA reflects the bank’s aggressive provisioning strategy. The bank holds a formidable Provision Coverage Ratio (PCR) of 95.86% as of June 30, 2026. Total provisions (other than tax) and contingencies for the quarter were ₹40,162 lakh, of which provisions for Non-Performing Assets specifically constituted ₹34,639 lakh.
Balance Sheet Strength & Capital Adequacy
The bank’s overall Networth (excluding Revaluation Reserve) expanded to ₹36,57,258 lakh. To support future growth and absorb potential macroeconomic shocks, the bank maintains a fortress balance sheet with a Capital Adequacy Ratio (Basel III) CET 1 Ratio of 18.28%. The Debt Equity Ratio is extremely conservative at 0.06.
Furthermore, the bank’s total standalone assets scaled to ₹5,57,01,114 lakh. Within this, total advances amounted to ₹3,46,83,721 lakh, and investments stood at ₹1,54,57,862 lakh.
6. Management Commentary & Regulatory Notes
An analysis of the Notes to Accounts provides critical context regarding management’s strategic priorities, regulatory compliance, and hidden balance sheet dynamics.
Strategic Co-Lending Initiatives
Management is aggressively expanding its loan book through Co-Lending Arrangements (CLAs). During Q1 FY27, the bank partnered with 2 Co-Lending Partners and purchased 41,268 accounts. The outstanding amount of these purchased accounts is ₹35,014 lakh. Impressively, the entirety of this co-lending portfolio is performing well, with zero NPA reported in this specific segment. The retail sector dominates this initiative, accounting for 41,100 of these accounts and ₹34,694 lakh of the amount.
Fraud Reporting and Provisioning
Transparency in asset health extends to fraud reporting. During the quarter, the bank reported 8 fraud cases (5 borrowal and 3 non-borrowal) involving a total amount of ₹14,487 lakh. Demonstrating prudent risk management, the management immediately made provisions amounting to ₹14,432 lakh to cover these specific cases.
Deferred Tax Assets (DTA) & Regulatory Policy Shifts
The bank’s profitability is partially supported by its tax strategy. Based on management’s assessment of recoverability against future taxable income, a Net Deferred Tax Asset (DTA) of ₹1,62,436 lakh was recognized in the standalone financial statements as of June 30, 2026.
Additionally, following the RBI Master Directions updated on May 18, 2026, the requirement for an Investment Fluctuation Reserve (IFR) was discontinued. Consequently, the bank transferred the balance standing in the IFR as of May 17, 2026, directly to the Profit & Loss Account.
Resolution of Stressed Assets
The bank is actively managing its stressed project finance portfolio. It reported an outstanding amount of ₹45,948 lakh in such cases as of June 30, 2026. In strict compliance with RBI directions, the bank holds an additional provision of ₹8,507 lakh and a total provision of ₹27,674 lakh against these specific stressed assets.
Regulatory Penalties
During the quarter, the bank faced minor regulatory penalties from the RBI totaling ₹20.82 lakh. These were attributed to operational issues including ATM Cash Dry Out (₹8.30 lakh), Currency Chest issues (₹4.64 lakh), Banking Ombudsman complaints (₹6.31 lakh), and NCDRC/CDRF matters (₹1.57 lakh). While the financial impact is negligible, it highlights areas for operational tightening.
7. Segment-wise Performance
Banking operations are rarely uniform. Central Bank of India’s Q1 FY27 performance reveals a stark divergence between its retail and wholesale divisions.
Retail Banking Operations: The Profit Engine
Retail banking remains the crown jewel of the bank’s current strategy.
Segment Revenue: ₹5,06,706 lakh.
Segment Profit: A massive ₹1,37,710 lakh.
Segment Assets: ₹2,14,85,732 lakh.
Analysis: The retail segment is not only the largest contributor to revenue but is overwhelmingly the primary driver of net profitability. The aggressive push into retail loans and co-lending is clearly yielding high-margin returns.
Treasury Operations: Steady Contributor
Segment Revenue: ₹3,34,183 lakh.
Segment Profit: ₹62,126 lakh.
Segment Assets: ₹1,97,40,964 lakh.
Analysis: Treasury operations provided a solid and reliable profit stream, benefiting from the bank’s massive investment book of ₹1,54,57,862 lakh.
Wholesale Banking Operations: The Drag
Segment Revenue: ₹2,23,625 lakh.
Segment Loss: ₹(13,914) lakh.
Segment Assets: ₹1,35,83,539 lakh.
Analysis: Wholesale (Corporate) banking remains a pain point. Despite generating substantial revenue, the segment posted a distinct loss. This suggests that legacy corporate stress, higher provisioning requirements for large accounts, or compressed corporate yields are severely impacting this division’s viability in the current quarter.
Did You Know? The bank’s unallocated assets (assets not tied directly to Retail, Wholesale, or Treasury) stood at ₹8,90,880 lakh, which resulted in a segment loss of ₹(7,477) lakh.
8. Peer Comparison Framework (Educational)
Editorial Note: The specific financial data for peer banks is outside the scope of the provided regulatory filing. However, investors can utilize the confirmed metrics from this report to benchmark Central Bank of India against its PSU peers (like PNB, Bank of Baroda, or Canara Bank) using the following framework.
When evaluating Central Bank of India against its peers, investors should focus on these critical verified metrics:
Asset Quality (GNPA): At 2.60%, Central Bank of India’s GNPA is highly competitive within the PSU banking space, indicating a massive clean-up of legacy bad loans.
Profitability (ROA): A Return on Assets of 1.00% (annualized) is a golden benchmark for Indian banks. Reaching the 1% ROA mark signifies that the bank is highly efficient at converting its asset base into net income.
Provisioning (PCR): A PCR of 95.86% implies that the bank has provided for almost all of its bad loans, meaning future profits are less likely to be wiped out by sudden credit shocks. Peer banks with PCRs below 80% carry significantly higher hidden balance sheet risks.
9. Market Reaction Framework (Educational)
Editorial Note: Real-time share price movement and trading volumes require live market tracking software. Investors analyzing the market’s reaction to this earnings report should monitor the following parameters.
Earnings reports of this magnitude typically trigger specific institutional reactions.
The Bullish Trigger: The massive sequential jump in Net Profit (from ₹72,443 lakh to ₹1,32,370 lakh) and the ROA hitting 1.00% are classic catalysts for institutional buying (FII/DII accumulation).
The Bearish Constraint: Traders may express caution over the Wholesale Banking segment loss of ₹13,914 lakh and the drop in Other Income YoY.
What to monitor: Investors should watch the delivery percentage in the trading sessions following this release. High delivery volumes would indicate long-term institutional accumulation rather than just intraday speculation.
10. Valuation Analysis
To evaluate whether the stock is undervalued or overvalued, analysts rely on core fundamental metrics derived from the balance sheet.
Earnings Per Share (EPS): The bank reported a Basic EPS of ₹1.46 for the single quarter (not annualized). If this performance is annualized (multiplying by 4 for a rough forward estimate), the projected annual EPS would be in the range of ₹5.84. Investors can divide the current live share price by this annualized EPS to determine the forward Price-to-Earnings (P/E) ratio.
Book Value: The bank’s Networth (excluding Revaluation Reserve) is ₹36,57,258 lakh. With a paid-up equity share capital of ₹9,05,140 lakh (Face value of ₹10 per share), the bank has roughly 9,05,140 lakh shares outstanding. This provides a massive fundamental floor for the Price-to-Book (P/B) ratio, a preferred valuation metric for banks.
Government Backing: The Government of India holds 81.19% of the shares. This high promoter holding provides a sovereign safety net, which traditionally commands a trust premium, although it leaves a smaller free float for public trading.
11. Technical Analysis Guide (Educational)
Disclaimer: Technical analysis is probabilistic and not a guarantee of future performance. Investors should combine technicals with the fundamental data provided above.
For swing traders and short-term investors looking to capitalize on this earnings report, the following technical indicators should be mapped on the daily and weekly charts:
Trend & Moving Averages: Plot the 50-day and 200-day Exponential Moving Averages (EMA). A strong earnings report (like the ₹1,32,370 lakh net profit) often causes the price to break above the 50-day EMA. A “Golden Cross” (50-day crossing above 200-day) would signal a long-term bullish trend.
Volume Trend: Analyze the volume bars on the day of the earnings release. A price surge accompanied by volume that is 2x or 3x the average daily volume confirms strong institutional participation.
RSI (Relative Strength Index): Check if the stock is overbought (RSI > 70) or oversold (RSI < 30). If the stock was heavily shorted prior to the results, this positive earnings surprise could trigger a short squeeze.
12. Risk Analysis
Despite the glowing headline profit, an objective institutional analysis must highlight the inherent risks detailed in the financial disclosures.
Segmental Vulnerability: The Wholesale Banking division reported a loss of ₹13,914 lakh during the quarter. This indicates that corporate lending remains a fragile area, potentially burdened by legacy accounts or tighter corporate spreads.
Operational & Fraud Risks: The bank reported 8 instances of fraud involving ₹14,487 lakh during the quarter. While fully provisioned (₹14,432 lakh), recurring instances of digital or borrowal fraud require tighter internal credit monitoring.
Regulatory Fines: The RBI imposed penalties totaling ₹20.82 lakh for various operational lapses, including ATM cash dry outs and currency chest issues. While financially immaterial, it underscores the need for stringent regulatory compliance.
Stressed Project Finance: The bank has ₹45,948 lakh tied up in stressed project finance accounts, requiring additional specific provisions of ₹8,507 lakh. Delays in infrastructure project completions could lead to further slippages.
13. Opportunities
The next 12–36 months present several distinct growth vectors for Central Bank of India:
Retail Scaling: With the Retail segment already generating ₹1,37,710 lakh in profit, further digitization and aggressive retail loan marketing can exponentially grow this high-margin book.
Co-Lending Expansion: The bank’s strategy to purchase standard assets through co-lending (41,268 accounts in Q1) allows it to grow its priority sector lending (like agriculture and MSME) with lower origination costs and shared risk.
Asset Quality Leverage: With GNPA down to 2.60% and PCR up to 95.86%, the bank will spend significantly less on future provisions. This means a much larger portion of operating profit will flow directly to the bottom line (Net Profit) in coming quarters.
14. Scenario Analysis
Based strictly on the verified Q1 FY27 data, we can model three potential scenarios for the coming fiscal year:
Base Case: The bank maintains its current trajectory. Retail banking continues to drive profits, and GNPA stabilizes around the 2.50% mark. Net profits remain steady above the ₹1,00,000 lakh per quarter threshold, supporting steady book value compounding.
Bull Case: The Wholesale banking segment turns around from its ₹13,914 lakh loss to profitability. Simultaneously, aggressive recovery in written-off accounts (which already yielded ₹17,926.96 lakh this quarter) accelerates. In this scenario, ROA sustains well above 1.00%, triggering a major valuation re-rating.
Bear Case: Macroeconomic interest rate shifts compress Net Interest Margins (NIMs). The stressed project finance portfolio (currently at ₹45,948 lakh) slips entirely into NPA status, forcing the bank to drain its operating profits to maintain its 95%+ PCR.
15. What Investors Should Watch
To stay ahead of the curve, investors should closely monitor the following metrics in the upcoming Q2 FY27 results:
Wholesale Banking Profitability: Will the segment recover from its ₹(13,914) lakh loss?
Co-Lending Delinquencies: Currently, the co-lending portfolio is pristine with zero NPAs. Watch for any early signs of stress in this rapidly growing book.
Other Income Trajectory: Monitor if the bank can reverse the YoY decline in Other Income (down from ₹1,77,098 lakh to ₹98,709 lakh).
16. Editorial Perspective (Clearly Labeled)
Editorial Opinion: Central Bank of India has delivered a highly commendable set of numbers that reflect a broader structural turnaround in the Indian public sector banking space. Reaching an ROA of 1.00% and driving Gross NPAs down to 2.60% is no small feat for a legacy institution. The management’s clear pivot toward high-margin retail banking and safe co-lending partnerships is a sound strategy. However, the loss in the wholesale banking segment remains a lingering shadow. While the bank is fundamentally stronger than it has been in years, long-term investors must demand consistency in wholesale credit quality before awarding it a premium valuation multiple.
17. Conclusion
Central Bank of India’s Q1 FY27 earnings report is a testament to disciplined banking. With Net Profit surging to ₹1,32,370 lakh and a formidable Provision Coverage Ratio of 95.86%, the bank has fortified its balance sheet against future shocks. While risks in the wholesale segment and minor regulatory penalties exist, the aggressive expansion of the retail engine positions the bank favorably for the rest of FY27. For long-term investors and banking sector followers, Central Bank of India represents a classic turnaround narrative transitioning into a phase of sustainable, profitable growth.



