

1.Introduction
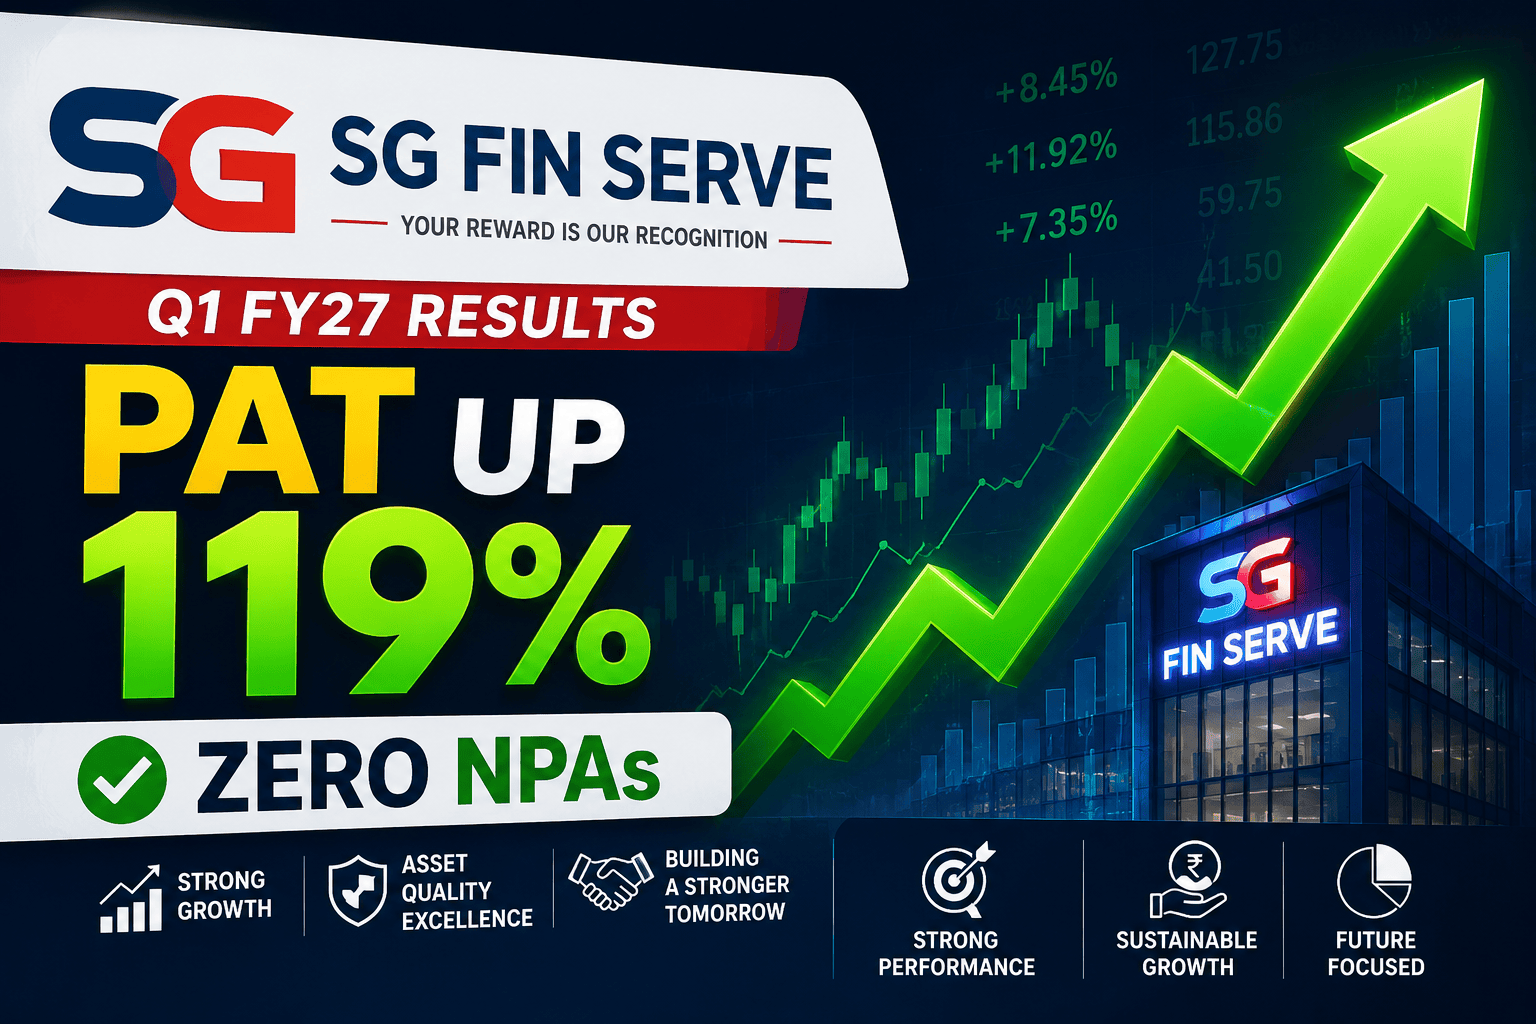
In the highly competitive and risk-sensitive world of Non-Banking Financial Companies (NBFCs), achieving hyper-growth while maintaining pristine asset quality is a rare feat. Yet, SG Finserve Limited has delivered precisely this in its Q1 FY27 earnings report. Posting a monumental 119% year-on-year growth in Profit After Tax (PAT), reaching ₹53.68 Crore, the company has underscored the massive potential of supply chain financing in India.
Perhaps the most astonishing metric from this quarter is not just the rapid scaling of its loan book to an all-time high of ₹4,552 Crore, but the fact that SG Finserve achieved this with an absolute zero Non-Performing Asset (NPA) ratio. Backed by the robust lineage of the APL Apollo Group and commanding a top-tier AA (CE)/A1+ credit rating by ICRA, SG Finserve is rapidly emerging as a dominant force in corporate and deep-tier vendor financing. This comprehensive earnings analysis breaks down the Q1 FY27 financials, management commentary, and what these numbers mean for retail and institutional investors.
2. Executive Summary
For professionals and investors short on time, here are the critical takeaways from SG Finserve’s Q1 FY27 disclosures:
Exceptional Profitability: Profit After Tax (PAT) surged to ₹53.68 Crore, representing a 119% year-on-year (YoY) and 27% quarter-on-quarter (QoQ) growth.
Revenue Expansion: Total Operating Income reached ₹136.13 Crore, marking a 102% YoY increase.
Record Loan Book: Assets Under Management (AUM) hit an all-time high of ₹4,552 Crore, up 82% YoY.
Pristine Asset Quality: The company continues to report NIL (0.00%) Non-Performing Assets (NPAs), showcasing exceptional risk management.
Strong Margins: Net Interest Income (NII) grew by 92% YoY to ₹82.06 Crore.
Stellar Return Ratios: Delivered an annualized Return on Assets (RoA) of 5.1% and Return on Equity (RoE) of 14.0%.
Robust Capitalization: Total equity stands comfortably at ₹1,539 Crore with a Capital to Risk (Weighted) Assets Ratio (CRAR) of 32%.
Controlled Leverage: Debt to Tangible Net Worth (TNW) remains conservative at less than 2.2x.
Cost Efficiency: Maintained highly disciplined operations with a Cost-to-Income ratio firmly below 15%.
3. Company Snapshot
Before dissecting the quarterly numbers, it is vital to understand the fundamental business model of SG Finserve Limited.
Business Model: SG Finserve operates as a specialized Non-Banking Financial Company (NBFC) laser-focused on Supply Chain Financing. They provide liquidity solutions across the downstream ecosystem, funding distributors, dealers, retailers, and vendors.
Product Portfolio: Their key offerings include Purchase Order Financing, Vendor Finance, Invoice Financing, Deep Tier Financing, Dealer/Distributor Finance, and Factoring & TReDS.
Industry: Financial Services / NBFC.
Promoter Lineage: Part of the APL Apollo Group, whose flagship company, APL Apollo Tubes Limited, is India’s largest structural steel manufacturer.
Key Corporate Partners: The company has forged strategic partnerships with massive industry players including APL Apollo, SAIL, Mahindra, AM/NS India, Tata Motors, Ashok Leyland, Vedanta, Adani, Polycab, Kajaria, and Bajaj Electricals, among others.
Geographic Presence: Truly pan-India, covering 30 locations with strong presence in the North, West, East, and growing penetration in the South (Bengaluru, Chennai, Kochi).
4. Q1 FY27 Results Snapshot
Financial metrics are crucial for quantifying a company’s success. Below is the un-audited financial performance for the quarter ended June 30, 2026. All figures are in ₹ Crore unless otherwise specified.
| Particulars | Q1 FY27 | Q4 FY26 | QoQ Change (%) | Q1 FY26 | YoY Change (%) |
| Interest Income | 128.9 | 99.2 | 30% | 64.5 | 100% |
| Fee/Other Income | 7.3 | 6.5 | 12% | 3.0 | 139% |
| Total Income | 136.2 | 105.7 | 29% | 67.5 | 102% |
| Interest Expenses | 54.1 | 42.9 | 26% | 24.8 | 118% |
| Net Interest Income (NII) | 82.1 | 62.8 | 31% | 42.7 | 92% |
| Operating Expenses | 9.6 | 6.3 | 53% | 7.8 | 23% |
| Impairment on Financial Assets | 0.9 | 0.3 | – | 1.0 | – |
| Profit Before Tax (PBT) | 71.6 | 56.2 | 27% | 33.9 | 111% |
| Income Tax | 17.9 | 13.9 | 29% | 9.4 | 92% |
| Profit After Tax (PAT) | 53.7 | 42.3 | 27% | 24.5 | 119% |
| Loan Book (AUM) | 4,552 | 3,936 | 16% | 2,504 | 82% |
Data Source: SG Finserve Limited Q1 FY27 Investor Presentation and Press Release.
5. Financial Performance Analysis
The Q1 FY27 results represent SG Finserve’s strongest quarter to date. Let us break down the drivers behind these stellar figures.
Revenue and NII Growth: Total income doubled YoY to ₹136.2 Crore. This exponential growth is directly tied to the massive 82% YoY expansion in the loan book, which swelled from ₹2,504 Crore in Q1 FY26 to ₹4,552 Crore in Q1 FY27. Net Interest Income (NII)—which is the difference between the interest earned on loans and the interest paid on borrowed funds—jumped 92% YoY to ₹82.1 Crore. This indicates that SG Finserve is efficiently pricing its loans and maintaining healthy spreads despite the rising cost of funds in the broader macroeconomic environment.
Fee Income: Fee and other income grew by an impressive 139% YoY to ₹7.3 Crore. This is a critical metric because fee income is capital-light. As SG Finserve expands its Factoring & TReDS offerings, this non-interest income stream is expected to become a more significant contributor to the bottom line, padding overall margins.
Operating Leverage and Cost Efficiency: Operating expenses stood at ₹9.6 Crore for the quarter. While this is a 23% YoY increase, it is vastly outpaced by the 102% growth in total income. This demonstrates massive Operating Leverage—a scenario where a company can grow its revenues much faster than its fixed and operational costs. Management explicitly noted that the company operates as a highly disciplined NBFC with a Cost-to-Income ratio remaining comfortably below 15%.
Asset Quality & Impairments: Impairment on financial assets remained negligible at ₹0.9 Crore. In the lending business, the ultimate test of underwriting standards is the Non-Performing Asset (NPA) ratio. SG Finserve has reported NIL (0%) NPAs. This flawless asset quality is largely attributed to the nature of supply chain finance, where lending is backed by verified invoices from blue-chip corporates (like SAIL, Tata Motors, and APL Apollo), drastically minimizing default risks.
6. Management Commentary
The official press release highlighted a tone of disciplined optimism. Management articulated the following key points:
On Core Business Strength: Management reiterated that Supply Chain Financing remains the core franchise. They noted that this core has been further strengthened by the commercialization of their Factoring and TReDS business lines.
On Operating Discipline: The leadership team, including CEO Vinay Gupta, emphasized their commitment to remaining a “highly disciplined NBFC.” They proudly cited their Cost-to-Income ratio staying below 15% and their NIL NPA status.
On Capitalization: Addressing potential concerns regarding capital constraints limiting future growth, management stated that the company remains “well capitalised.” With a total equity of ₹1,539 Crore and a Debt to TNW ratio of 2.2x, they assured investors that there is “comfortable headroom for business growth”.
On Strategic Direction: The company outlined its strategy as “deepening and widening.” This involves mining deeper into existing customer relationships, acquiring new customers, expanding the product suite, and exploring adjacent financial services.
“The Company delivered its strongest quarter to date, with Operating Income more than doubling year-on-year and Profit After Tax growing 119% over the corresponding quarter of the previous year, while maintaining a NIL NPA book.” — Official Press Release, SG Finserve Limited.
7. Balance Sheet Analysis
A strong P&L is meaningless without a fortress balance sheet, particularly for an NBFC. SG Finserve’s capital positioning appears highly fortified.
Net Worth and Equity: The company’s Net Worth expanded significantly, growing 48% YoY to cross ₹1,535 Crore. Total equity (End of Period) stands at ₹1,539 Crore. This robust equity base acts as a massive shock absorber against any potential future macroeconomic volatility.
Leverage (Debt-to-Equity): In the NBFC sector, managing leverage is paramount. SG Finserve’s Debt to Tangible Net Worth (TNW) ratio is remarkably conservative at under 2.2x. Many traditional NBFCs operate at leverage ratios of 4x to 6x. SG Finserve’s low leverage implies two things: lower financial risk and massive unused borrowing capacity to fund future loan book growth without requiring immediate equity dilution.
Capital Adequacy: The Capital to Risk (Weighted) Assets Ratio (CRAR) stands at a massive 32%. The RBI mandates a minimum CRAR of 15% for most NBFCs. Sitting at 32%, SG Finserve is overcapitalized, confirming the management’s statement regarding comfortable headroom for growth.
8. Cash Flow Analysis
While a detailed cash flow statement was not part of the Q1 presentation, we can infer strong cash dynamics from the disbursement figures.
Gross Disbursements: SG Finserve reported gross disbursements of over ₹7,300 Crore for the quarter, marking a 39% YoY increase.
Velocity of Capital: Because supply chain financing generally involves short-term, self-liquidating loans (typically 30 to 90 days), the disparity between the massive ₹7,300 Crore disbursements and the ₹4,552 Crore total loan book implies a very high velocity of capital. The company is turning over its capital multiple times a year, which is the primary driver behind its impressive Return on Assets.
9. Ratio Analysis
Financial ratios are the vital signs of corporate health. Here is a simple breakdown of SG Finserve’s key metrics:
Return on Assets (RoA) – 5.1%: Definition: RoA measures how effectively a company uses its assets (loans) to generate profit. An annualized RoA of 5.1% is exceptional in the NBFC space, where anything above 2.5% is generally considered excellent. This high RoA is driven by high-margin supply chain yields and virtually zero credit costs.
Return on Equity (RoE) – 14.0%: Definition: RoE measures the profitability in relation to shareholders’ equity. An RoE of 14.0% is strong, especially considering the company is currently under-leveraged (Debt/TNW < 2.2x). As the company cautiously increases its leverage over time, this RoE has significant room to expand.
Non-Performing Assets (NPA) – NIL: Definition: Loans that are in default or close to being in default. Maintaining 0% NPA while growing the loan book 82% YoY reflects immaculate underwriting standards and the inherent safety of deep-tier vendor financing backed by large corporate anchors.
10. Industry & Peer Comparison
The Supply Chain Finance (SCF) industry in India is undergoing a structural boom. Driven by the formalization of the economy, GST implementation, and the digitization of supply chains, the addressable market is vast.
While direct, pure-play listed peers are scarce, SG Finserve competes broadly with traditional bank factoring divisions and specialized B2B NBFCs.
Competitive Advantage: SG Finserve’s primary moat lies in its corporate partnerships. By tying up with anchor corporates like SAIL, Mahindra, and Tata Motors, the NBFC essentially rides on the creditworthiness of these giants. SG Finserve finances the suppliers and distributors of these anchors, mitigating the default risk of smaller MSMEs.
TReDS Leadership: SG Finserve has positioned itself as one of the less than 1% of NBFCs offering Factoring & TReDS (Trade Receivables Discounting System) solutions. This early-mover advantage on digital factoring platforms creates a scalable, high-volume growth runway.
11. Macroeconomic Analysis
The broader economic environment heavily influences NBFC performance.
Credit Demand: India’s push for domestic manufacturing (Make in India) and infrastructure development is creating massive working capital needs across supply chains. SG Finserve is perfectly positioned to capitalize on this credit hunger.
Interest Rates: While a high-interest-rate environment usually squeezes NBFC margins, SG Finserve’s short-duration loan book (invoice financing) allows it to pass on increased borrowing costs to customers rapidly, protecting its Net Interest Margin (NIM).
MSME Formalization: As smaller dealers and vendors formalize to comply with GST, their financial trails become visible, allowing lenders like SG Finserve to underwrite them accurately using deep-tier financing models.
12. Investment Thesis
The Bull Case
Hyper-Growth with Safety: Delivering 119% PAT growth with absolute zero NPAs is a rare combination.
Under-leveraged Balance Sheet: With a CRAR of 32% and Debt/TNW at 2.2x, the company has the dry powder to sustain 25-30% AUM growth for years without needing to dilute equity.
Ecosystem Captivity: Being part of the APL Apollo Group provides captive access to one of India’s largest steel supply chains, offering a massive, predictable baseload of business.
The Bear Case / Key Risks
Concentration Risk: A significant slowdown in the broader manufacturing or auto sector (key sectors for partners like Tata Motors and Ashok Leyland) could lead to reduced supply chain velocity and lower loan demand.
Interest Rate Volatility: Sharp, unexpected spikes in RBI repo rates could temporarily compress margins before the NBFC can reprice its short-term loans.
Intensifying Competition: As supply chain financing proves highly lucrative, larger banks with cheaper access to funds (CASA) might aggressive enter the deep-tier financing space.
13. Valuation Analysis
Note: This section is for analytical purposes and does not constitute a target price or investment recommendation.
When valuing a rapidly growing NBFC like SG Finserve, standard Price-to-Earnings (P/E) multiples often look inflated due to the high growth rate. Investors typically focus on the Price-to-Book (P/B) ratio and PEG (Price/Earnings-to-Growth).
Given the annualized RoE of 14% and a PAT growth of 119%, the company is exhibiting traits of a high-growth compounding machine. Because asset quality is pristine (NIL NPAs), the book value is highly reliable. Investors should monitor how quickly the management can deploy the excess capital (currently dragging down potential RoE) to drive earnings per share (EPS) higher. If the company achieves its guided PAT CAGR of 30-35%, premium valuation multiples are likely to be sustained by institutional investors.
14. Technical Analysis (Educational)
Educational Note: Technical analysis evaluates past market data to identify trends. It is not guaranteed to predict future price movements.
For a stock experiencing the kind of fundamental hyper-growth seen in SG Finserve, technical charts often mirror the momentum.
Trend: Institutional investors generally look for stocks trading above their 50-day and 200-day Simple Moving Averages (SMA) as confirmation of a long-term uptrend.
Volume: A fundamental breakout (like a 119% earnings jump) accompanied by high trading volume indicates strong institutional accumulation.
RSI (Relative Strength Index): Investors monitor RSI to ensure the stock hasn’t become severely overbought (RSI > 70) in the immediate aftermath of an earnings euphoria.
15. Future Outlook
The management has laid out clear, quantified guidance for the future:
Growth Targets: SG Finserve is targeting an AUM CAGR of 25-30% and a PAT CAGR of 30-35%.
Profitability Metrics: The company expects to maintain its stellar RoA between 4.5% to 5.0% and RoE between 14% to 16%.
Operational Control: The Cost-to-Income ratio is guided to remain highly efficient, between 13% and 17%, while continuing to target NIL NPAs.
Product Expansion: Moving forward, SG Finserve plans to launch Loan Against Property (LAP) and new digital lending programs to diversify its revenue streams.
16. Investor Takeaways
For Long-Term Investors: SG Finserve presents a compelling structural growth story. Its ability to command high yields in supply chain finance while mitigating default risk through corporate anchor partnerships makes it an attractive compounding candidate.
For Value Investors: The stock may not screen well on traditional “value” metrics (low P/E), but the value lies in the safety of the book (0% NPA) and the massive runway for reinvestment at a 14% RoE.
For Existing Shareholders: The Q1 FY27 results validate the management’s execution capabilities. The flawless asset quality combined with a 27% QoQ profit jump suggests the core thesis remains firmly intact.
17. Conclusion
SG Finserve Limited’s Q1 FY27 results are a masterclass in scaling a financial services business profitably and safely. By leveraging deep-tier supply chains and cutting-edge TReDS platforms, the company has managed to grow its loan book by 82% to ₹4,552 Crore without allowing a single rupee to turn into a Non-Performing Asset. With a heavily fortified balance sheet, strong institutional backing from the APL Apollo Group, and a clear roadmap to 30-35% PAT CAGR, SG Finserve is cementing its position as a specialized leader in India’s booming credit market.



