

1. Introduction
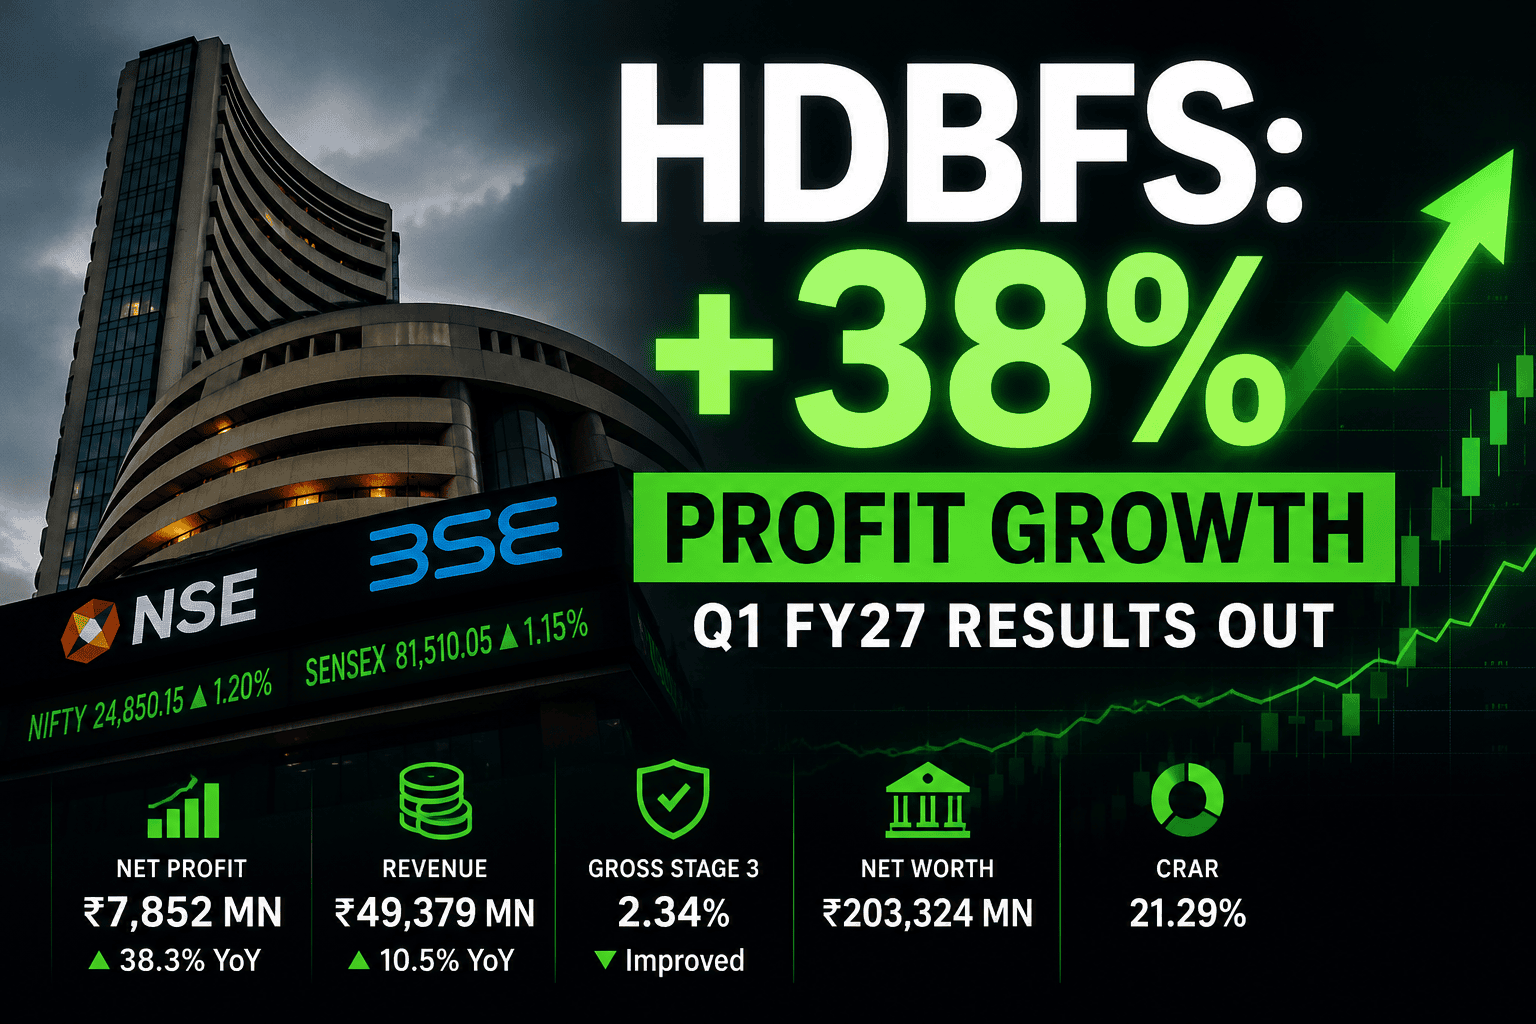
In a closely watched earnings release following its high-profile public market debut last year, HDB Financial Services Limited (HDBFS) has delivered a robust set of numbers for the first quarter of the financial year 2026-27 (Q1 FY27). Shrugging off broader macroeconomic headwinds and elevated interest rate environments, the Upper Layer Non-Banking Financial Company (NBFC-UL) reported a stellar 38.3% year-on-year surge in net profit, reaching Rs 7,852 million for the quarter ended June 30, 2026.
Beyond the headline profit jump, the real story lies in the balance sheet cleanup. Asset quality metrics showed marked improvement, with the Gross Stage 3 ratio compressing to 2.34%. For institutional and retail investors navigating the competitive Indian shadow banking space, HDB Financial’s latest disclosures answer a critical question: Can the lender sustain profitable growth while keeping credit costs firmly under control? This forensic analysis breaks down the verified numbers, segment performance, and what these results signal for long-term capital allocators.
2. Executive Summary
Profitability Surge: Net profit for Q1 FY27 stood at Rs 7,852 million, a solid 38.3% YoY increase from Rs 5,677 million in Q1 FY26.
Topline Expansion: Total revenue from operations scaled to Rs 49,379 million, up from Rs 44,654 million in the corresponding quarter last year.
Asset Quality Relief: Gross Stage 3 ratio improved to 2.34% (down from 2.56% YoY), while Net Stage 3 ratio dropped to 1.04% (down from 1.11% YoY).
Margin Health: The company reported an expanded net profit margin of 15.90%, an improvement from 12.72% in Q1 FY26.
Capital Buffers: Capital Adequacy Ratio (CRAR) remains exceptionally strong at 21.29%, well above regulatory minimums.
Cost Management: While employee benefits expanded to Rs 10,354 million, overall total expenses were contained at Rs 38,828 million, allowing strong flow-through to pre-tax profits.
Segment Dynamics: The core lending business generated Rs 46,250 million in revenue, while the BPO services segment contributed Rs 3,129 million.
Post-IPO Stability: Following its July 2025 listing, the company’s net worth has expanded to Rs 2,03,324 million, positioning it aggressively for future loan book expansion.
3. Company Overview
HDB Financial Services Limited operates as a major non-deposit-taking NBFC in India, officially classified by the RBI as an Upper Layer NBFC (NBFC-UL) under the Scale Based Regulation framework.
Business Model: The company operates via two distinct primary segments: the core Lending Business and BPO Services.
Lending Portfolio: The lending arm provides finance to customers for commercial equipment, commercial vehicles, personal loans, and enterprise loans.
BPO Services: Uniquely positioned among NBFCs, HDBFS runs a BPO segment comprising sales support, back-office operations, processing support, and collection call centers.
Market Position: Having raised Rs 25,000 million in a fresh issue during its highly anticipated IPO (listed in July 2025), HDBFS boasts a massive net worth of Rs 2,03,324 million, giving it the financial muscle to compete aggressively with peers like Bajaj Finance and Cholamandalam Investment and Finance.
4. Q1 FY27 Financial Performance
The underlying health of an NBFC is dictated by its ability to balance yield generation with cost of funds and credit impairments. Below is the verified financial snapshot for the quarter ended June 30, 2026.
Earnings Snapshot (Rs in Millions)
| Metric | Q1 FY27 (Jun 2026) | Q4 FY26 (Mar 2026) | Q1 FY26 (Jun 2025) | YoY Growth |
| Total Revenue | 49,379 | 47,454 | 44,654 | +10.58% |
| Interest Income | 42,620 | 40,813 | 38,315 | +11.23% |
| Finance Costs | 17,533 | 16,825 | 17,397 | +0.78% |
| Impairment | 6,971 | 6,846 | 6,697 | +4.09% |
| Profit Before Tax | 10,551 | 10,112 | 7,325 | +44.04% |
| Net Profit | 7,852 | 7,506 | 5,677 | +38.31% |
| Basic EPS (Rs) | 9.46 | 9.04 | 7.13 | +32.67% |
All data sourced directly from official unaudited financial results filed on July 15, 2026.
Analyst Interpretation: The most striking feature of this income statement is the positive operating leverage. While total revenue grew by a healthy 10.58% YoY, the company’s cost of funds (finance costs) remained remarkably flat, growing a mere 0.78% YoY. This structural efficiency allowed the profit before tax to explode upward by 44%.
5. Quarter-on-Quarter (QoQ) Analysis
Comparing Q1 FY27 to the immediate preceding quarter (Q4 FY26) provides insight into near-term momentum.
Revenue Momentum: Total revenue grew sequentially by 4.05% from Rs 47,454 million to Rs 49,379 million. Interest income drove this, rising from Rs 40,813 million to Rs 42,620 million, suggesting sustained disbursement velocity despite standard Q1 seasonality.
Profitability Stability: Net profit expanded by 4.6% sequentially to Rs 7,852 million.
Cost Pressures: Employee benefit expenses rose sequentially from Rs 9,705 million to Rs 10,354 million, likely reflecting annual appraisal cycles and capacity building for the new fiscal year.
6. Year-on-Year (YoY) Analysis
The YoY lens strips out seasonal noise and validates the long-term structural thesis.
The Bottom-Line Beat: The 38.31% jump in net profit YoY (from Rs 5,677 million to Rs 7,852 million) is the definitive highlight.
Margin Expansion: Net profit margin expanded significantly from 12.72% in Q1 FY26 to 15.90% in Q1 FY27. This margin expansion is directly attributable to the containment of finance costs (Rs 17,533 million) and a very controlled rise in impairments (Rs 6,971 million, up just 4% YoY).
7. Business Segment Analysis
Under Ind-AS 108, HDBFS reports two distinct operating segments.
A. Lending Business
Revenue Contribution: The core lending engine generated Rs 46,250 million in revenue, up from Rs 41,615 million a year ago.
Segment Profitability: The segment delivered a robust pre-tax result of Rs 10,451 million.
Asset Base: Total segment assets for lending swelled to an impressive Rs 12,61,472 million, indicating a massive, continuously compounding loan book.
B. BPO Services
Revenue Contribution: The BPO segment brought in Rs 3,129 million, a slight uptick from Rs 3,039 million in Q1 FY26.
Segment Profitability: Pre-tax profit for the BPO arm stood at Rs 260 million. While structurally smaller and lower margin than lending, this segment provides captive operational efficiency and a diversified, capital-light fee income stream.
8. Asset Quality & Risk
For financial institutions, growth without risk management is a prelude to disaster. HDBFS has demonstrated pristine asset quality management this quarter.
Gross Stage 3 Ratio: A critical measure of gross non-performing assets (GNPA), this ratio improved to 2.34% in Q1 FY27, down consistently from 2.44% in Q4 FY26 and 2.56% in Q1 FY26.
Net Stage 3 Ratio: Representing the unprovided bad loans, this metric tightened to 1.04%, down from 1.11% a year ago.
Provisioning: The Stage 3 provision coverage ratio remains highly prudent at 55.73%.
Impairment Costs: Impairment of financial instruments stood at Rs 6,971 million for the quarter. The slow growth in impairment costs relative to revenue growth proves that the underwriting standards on recent vintages are holding up exceptionally well.
Liquidity & Capital: The Liquidity Coverage Ratio (LCR) sits at an ultra-safe 159.17%, while the Capital Adequacy Ratio (CRAR) of 21.29% means the balance sheet is armed with immense dry powder for future growth.
9. Valuation Perspective & Capital Structure
Analyst Note: As HDB Financial Services was recently listed in July 2025, price-based valuation metrics (P/E, P/B) require continuous tracking against real-time market quotes. The analysis below focuses on intrinsic value drivers based on Q1 filings.
Net Worth Expansion: Following the Rs 25,000 million IPO fresh issue, the company’s net worth has fortified to Rs 2,03,324 million.
Return Metrics: An expanding net profit margin of 15.90% combined with a heavily levered (but safely managed) balance sheet (Debt-to-Equity of 5.02) traditionally translates to upper-quartile Return on Equity (RoE) in the NBFC space.
Earnings Power: With an unannualized Q1 Basic EPS of Rs 9.46, the trailing twelve-month and forward earnings trajectory provides a strong fundamental floor for long-term institutional investors.
10. Peer Comparison (Analyst Interpretation)
While direct competitor filings for this exact quarter are still rolling out, HDB Financial’s profile positions it against heavyweights like Bajaj Finance, Shriram Finance, and Cholamandalam.
The HDB Advantage: HDBFS’s CRAR of 21.29% places it in the upper echelon of capitalized peers. Furthermore, its unique BPO services arm offers a distinct operational cost advantage in collections and processing that pure-play lenders lack.
Asset Quality Context: A Gross Stage 3 ratio of 2.34% on a diversified commercial and personal loan book is highly competitive, indicating that HDBFS is capturing premium borrower segments.
11. Management Commentary & Disclosures
The Q1 FY27 statutory release provided limited forward-looking management commentary, focusing heavily on regulatory compliance and verified financial positioning.
Key Official Disclosures:
IPO Utilization: Out of the Rs 25,000 million fresh issue proceeds intended to augment the capital base, Rs 24,937 million has been utilized as of June 30, 2026. Only Rs 63 million remains unutilized (parked in escrow for estimated IPO expenses).
Co-Lending Arrangements (CLAs): Management disclosed a quantum of Rs 7,574 million in CLAs, primarily in the Salaried & Self-Employed customer sectors, at a weighted average interest rate of 26.06%.
12. Macroeconomic & Sector Analysis
The Indian NBFC sector operates at the mercy of RBI liquidity frameworks and sovereign yield curves.
Cost of Funds Triumph: The broader macro environment in early FY27 has seen sticky interest rates. However, HDBFS’s ability to keep its finance costs essentially flat YoY (Rs 17,533 million vs Rs 17,397 million) indicates superior liability management, likely benefiting from its parentage and recent IPO-driven equity infusion reducing overall leverage needs.
13. Risks
While the quarter was overwhelmingly positive, professional equity research demands scenario analysis.
Company-Specific Risk: Employee benefit expenses have grown to Rs 10,354 million. If revenue growth decelerates, this high fixed-cost base could compress operating margins.
Sector Risk: The NBFC-UL classification brings stringent RBI regulatory oversight, requiring higher compliance costs and capital buffers compared to lower-layer peers.
Macro Risk: An economic slowdown impacting the commercial vehicle or enterprise loan segments could rapidly reverse the current positive trajectory of the Stage 3 NPA metrics.
14. Future Outlook
The runway for HDBFS appears exceptionally clear. With the IPO capital now fully deployed into the lending base, the company is in the “sweating the assets” phase of its corporate lifecycle.
Investors should anticipate aggressive, digitally-led loan book expansion. The co-lending arrangement (CLA) framework (currently at Rs 7,574 million) represents a highly scalable, capital-light growth vector that management is clearly prioritizing for high-yield (26%+) retail segments.
15. Investor Takeaways
For Long-Term Investors: The 38% YoY profit jump validates the post-IPO growth thesis. The fortified net worth of Rs 2,03,324 million ensures stability. Hold and accumulate on broader market dips.
For Growth Investors: The expansion of the net profit margin to 15.9% is the key metric. If the company maintains flat finance costs while growing the top line by double digits, earnings per share will compound rapidly.
For Value Investors: Monitor the price-to-book (P/B) ratio closely against the growing book value. The immaculate asset quality (Net NPA 1.04%) reduces downside risk.
16. Editorial Opinion (Independent Analyst View)
Editorial Opinion: The following represents independent financial analysis and does not constitute guaranteed outcomes.
HDB Financial Services has delivered what can only be described as a “textbook” quarter. For a newly listed entity to navigate its first few quarters under public market scrutiny with declining NPAs, expanding margins, and controlled funding costs is a testament to its underwriting discipline. The flat YoY finance cost amidst a growing loan book is the unsung hero of this earnings report. Unless a systemic macro shock hits the Indian retail consumer, HDBFS is positioned to be one of the prime compounding engines in the financial sector for FY27.
17. Conclusion
HDB Financial Services’ Q1 FY27 results cement its status as a premier operator in the NBFC-UL space. With a net profit of Rs 7,852 million, pristine asset quality, and a massive capital base, the company has successfully transitioned from an IPO narrative to an execution narrative.
What to Watch Next Quarter: Investors should closely monitor the sequential growth of the co-lending book and whether the company can maintain its remarkably efficient cost-of-funds run rate heading into the festive season.




utrpkwwgfuyiqjfsyfyvpxyeyhleym