

1. POWERFUL INTRODUCTION
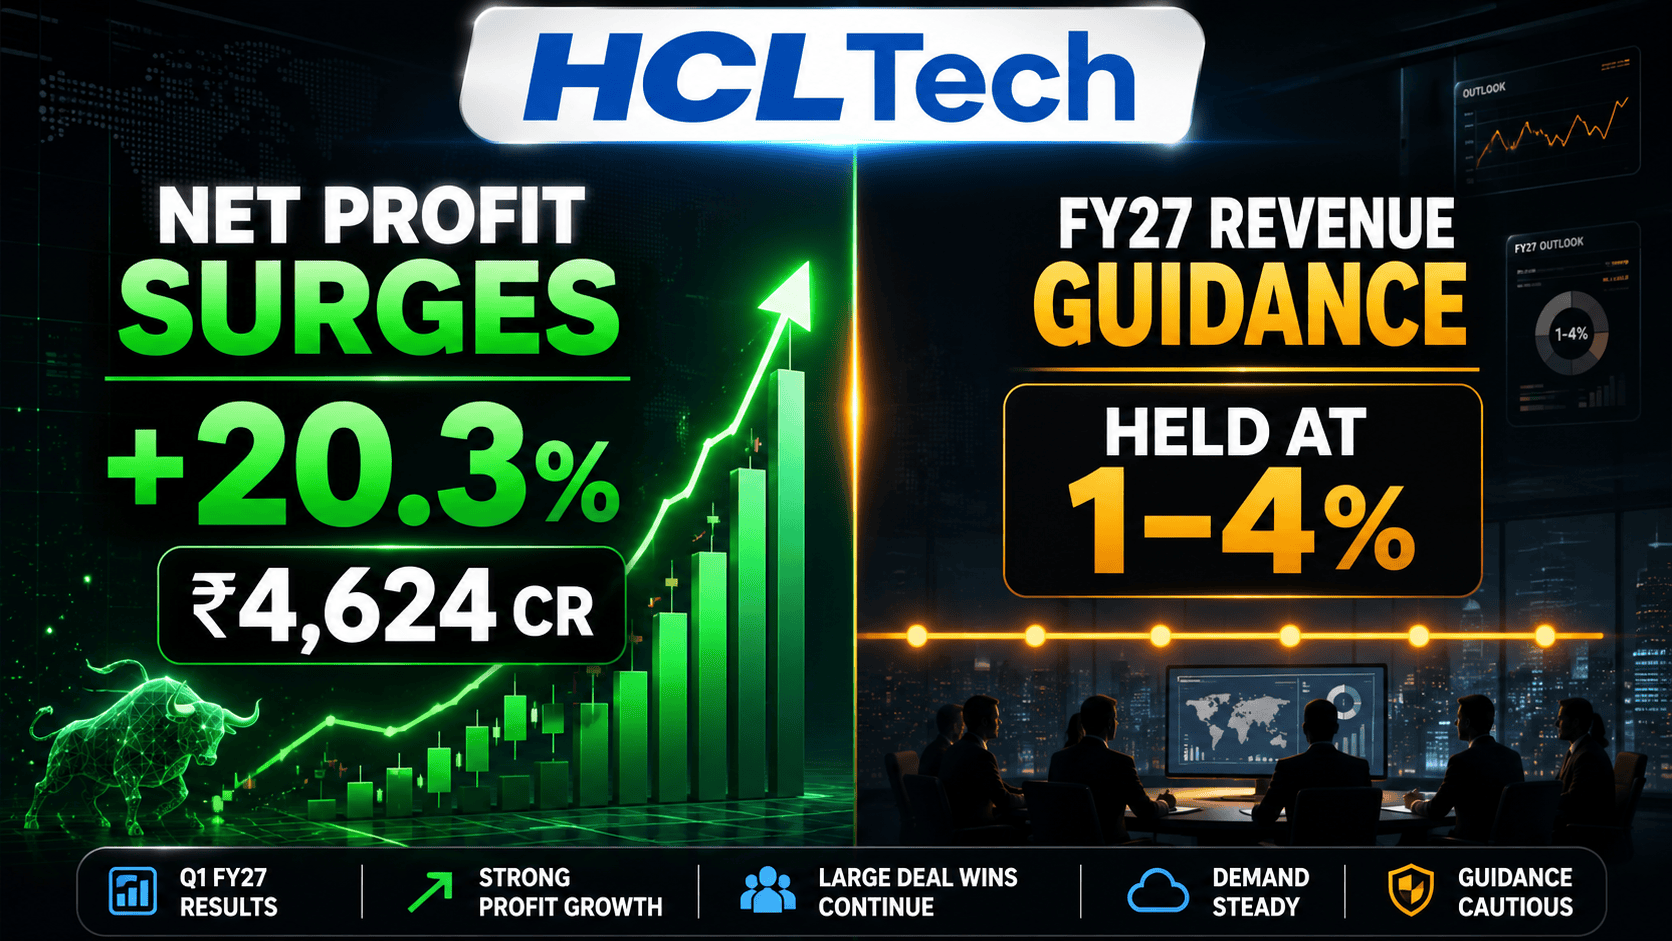
On July 13, 2026, HCL Technologies Limited kicked off the fiscal year with a resilient financial disclosure, announcing a 20.3% year-on-year (YoY) increase in consolidated net profit to ₹4,624 crore for the first quarter ending June 30, 2026 (Q1 FY27). Outperforming market consensus on several key profitability fronts, the Noida-headquartered IT services provider secured its highest-ever Q1 net-new deal bookings at $2,407 million alongside an extraordinary 62.1% YoY expansion in its Advanced AI revenue segment in constant currency.
Yet, as trading opened on July 14, 2026, the equity market reacted with a calculated “sell-on-news” correction, pulling the stock lower as investors digested management’s decision to maintain its conservative full-year guidance. For long-term shareholders and retail market participants alike, these results underscore a structural transformation: HCLTech is actively moving away from human-linear scaling toward high-margin, automated software portfolios and sophisticated physical AI integrations. Understanding this divergence between headline revenue pacing and core capital efficiency is absolutely paramount for any market participant assessing the Indian tech landscape in 2026.
2. EXECUTIVE SUMMARY: 10 KEY TAKEAWAYS
Top-line Growth Trajectory: Consolidated revenue reached ₹34,579 crore, displaying a steady expansion of 13.9% YoY and 1.8% sequentially (QoQ).
Profitability Surge: Consolidated net profit arrived at ₹4,624 crore, indicating a 20.3% surge YoY and 3.0% growth QoQ, confirming resilient operational levers.
Advanced AI Momentum: The high-margin Advanced AI revenue vertical expanded to $171 million, skyrocketing by 62.1% YoY and 10.6% QoQ in constant currency terms.
Record Deal Pacing: Net-new Total Contract Value (TCV) deal wins hit a record Q1 high of $2,407 million, underlining sustained enterprise pipeline execution.
Operational Resiliency: Reported EBIT Margin landed at 16.9%. Stripping away a 62 basis points (bps) headwind from restructuring costs, the normalized core operating margin stood at an impressive 17.5%.
Maintained Annual Guidance: Management retained its full-year FY27 guidance, projecting constant currency company revenue growth between 1.0% and 4.0% and an EBIT margin range of 17.5% to 18.5%.
Strong Cash Conversion: The company’s Free Cash Flow to Net Income (FCF/NI) conversion hit 99% on a Last Twelve Months (LTM) basis, emphasizing pristine quality of earnings.
Generous Dividend Outflow: The Board of Directors declared an interim dividend of ₹12 per equity share for the quarter, continuing its history of strong shareholder payouts.
Efficiency Gains & Workforce Rationalization: Total headcount fell sequentially by 3,292 professionals to 223,889, while annualized revenue per employee expanded 3.3% YoY to $65.5K.
Distinct Vertical Bifurcation: Growth was anchored by Public Services (up 12.0% YoY CC), whereas Telecommunications & Media experienced a major drop of 10.9% YoY CC.
3. COMPANY SNAPSHOT
HCL Technologies operates via an integrated global delivery model across three core reporting segments:
IT and Business Services (ITBS): Represents 75.3% of total revenue mix. It focuses on core digital foundation engineering, application modernization, hybrid cloud migrations, and managed infrastructure environments.
Engineering and R&D Services (ERS): Makes up 16.5% of the operational mix. It provides next-generation product engineering, hardware design, platform architecture, and advanced semiconductor validation services.
HCLSoftware: Accounts for 8.6% of the corporate revenue mix. This high-margin enterprise software engine drives annual recurring revenue (ARR) through proprietary platforms like Actian Ingres, HCL BigFix, and HCL Commerce.
Revenue Mix At A Glance (Services Business)
Geographic Concentration: The United States remains the dominant geographic engine, commanding 56.0% of the services mix, followed by Europe at 27.6%, the Rest of the World (RoW) at 13.1%, and India at 3.3%.
Shareholding Framework: Promoters hold a stable majority share, while institutional frameworks (both Foreign Institutional Investors [FIIs] and Domestic Institutional Investors [DIIs]) support the public float, reinforcing long-term corporate governance.
4. Q1 FY27 FINANCIAL HIGHLIGHTS (EARNINGS SCORECARD)
The following structured scorecard captures the absolute financial performance of HCL Technologies across key balance sheet, income statement, and human resource parameters.
| Consolidated Financial Parameter | Q1 FY27 (June 2026) | Q4 FY26 (March 2026) | Q1 FY26 (June 2025) | YoY Shift (%) / Bps | QoQ Shift (%) / Bps |
| Gross Revenue (₹ Crore) | ₹34,579 | ₹33,981 | ₹30,349 | +13.9% | +1.8% |
| Gross Revenue ($ Millions) | $3,650 | $3,682 | $3,545 | +3.0% | -0.9% |
| Constant Currency Growth (YoY) | 2.6% | 2.4% | 3.7% | — | — |
| Consolidated EBITDA (₹ Crore) | ₹6,870 | ₹6,712 | ₹6,035 | +13.8% | +2.4% |
| Reported EBIT Margin (%) | 16.9% | 16.5% | 16.3% | +56 bps | +39 bps |
| Adjusted EBIT Margin (%) | 17.5% | 17.7% | 16.3% | +120 bps | -20 bps |
| Consolidated Net Profit (₹ Crore) | ₹4,624 | ₹4,488 | ₹3,843 | +20.3% | +3.0% |
| Diluted EPS (LTM – ₹) | ₹66.90 | ₹64.01 | ₹62.57 | +6.9% | +4.5% |
| Total Contract Value ($ Millions) | $2,407 | — | — | Highest Q1 | — |
| Advanced AI Revenue ($ Millions) | $171 | — | — | +62.1% CC | +10.6% CC |
| LTM Return on Invested Capital | 40.7% | 40.3% | 38.1% | +260 bps | +40 bps |
| LTM Free Cash Flow / Net Income | 99% | — | — | Stable | — |
| Gross Cash Reserves (₹ Crore) | ₹33,447 | ₹27,058 | — | — | +23.6% |
| Quarterly Attrition Rate (LTM) | 12.7% | 12.5% | 12.8% | -10 bps | +20 bps |
| Total Employee Workforce | 223,889 | 227,181 | 223,151 | +0.3% | -1.4% |
5. DEEP-DIVE REVENUE ANALYSIS
A metric-driven decomposition of HCLTech’s revenue lines reveals a business successfully mitigating localized headwinds via strong geometric expansion in niche markets and core secular segments.
Geographic Dispersion and Performance
United States (-2.9% YoY CC): The North American theater experienced contraction down to a 56.0% revenue contribution profile. This decline reflects standard pipeline roll-offs and a broader pull-back in discretionary enterprise cloud transformation allocations.
Europe (+0.1% YoY CC): The European operational context remained flat at 27.6% revenue concentration. Enterprises across Germany, the UK, and the Benelux regions continue to pause long-term architecture refreshes in favor of near-term cost optimization projects.
Rest of the World (RoW) (+10.8% YoY CC): Displayed high single-digit momentum, expanding to 13.1% of the services profile. This was driven by aggressive market share acquisition across Australia, Japan, and the Middle East.
India (+16.9% YoY CC): Stood out as the fastest-growing geographical segment, reaching 3.3% of the services delivery mix. This growth was fueled by domestic digital public infrastructure transformations and key public sector framework projects.
Segment-wise Growth
The IT and Business Services core division grew 4.2% YoY CC, underscoring steady operational traction. Engineering and R&D Services recorded a flat 0.3% YoY CC, demonstrating market caution in mechanical engineering spend, offset by strong automotive design wins. Conversely, HCLSoftware faced a seasonal contraction of -5.3% YoY CC, which is historically typical for product license cycles during the first fiscal quarter.
Industry Vertical Analysis
The divergence across business verticals reveals clear structural trends:
Public Services (+12.0% YoY CC): Driven by global transit modernization, public utility automation frameworks, and green energy infrastructure updates.
Retail & Consumer Packaged Goods (+10.1% YoY CC): Propelled by direct-to-consumer digital commerce optimizations, SAP S/4HANA supply chain migrations, and advanced inventory orchestration algorithms.
Financial Services (+5.3% YoY CC): Showed moderate acceleration as global banking entities prioritized core database security upgrades over experimental peripheral projects.
Telecommunications & Media (-10.9% YoY CC): Dropped significantly as telecommunication carriers reduced network rollout spending following massive 5G capital investment cycles.
Key Takeaway: While legacy discretionary engagements face headwinds in North America, HCLTech’s diversified vertical strategy—particularly in Public Services and Retail—is successfully keeping top-line performance stable.
6. PROFITABILITY & EFFICIENCY ANALYSIS
HCLTech’s quarterly performance highlights strong execution on margins, reflecting management’s focus on productivity over pure employee volume expansion.
  [Adjusted Core EBIT Margin: 17.5%]
  ▲
  │   Restructuring Cost Headwind: 62 bps
  ▼
  [Reported EBIT Margin: 16.9%]
The Cost Optimization Framework
The operational engine expanded its reported EBIT margin to 16.9%. However, this figure includes a one-time structural drag of 62 bps due to severance and facility restructuring costs. Stripping away this variable reveals an adjusted core EBIT margin of 17.5%, showing strong progress toward full-year operating targets.
Workforce Efficiency Moves: Total personnel count declined by 3,292 resources QoQ. The company did not immediately backfill lower-margin legacy maintenance vacancies, which helped improve utilization.
Workforce Pyramid Optimization: HCLTech introduced 1,056 entry-level freshers during the quarter. This strategic adjustment to the internal experience pyramid helped mitigate ongoing wage inflation pressures at senior technical levels.
Linear Decoupling: Annualized revenue per employee rose to $65.5K. This extension reflects the successful integration of automated delivery frameworks, proprietary product licenses, and non-linear delivery platforms like HCL Al Force.
7. VERIFIED MANAGEMENT COMMENTARY
Corporate Chairperson Perspective
Roshni Nadar Malhotra, Chairperson, HCLTech noted:
“AI is accelerating the transformation of global enterprises and unlocking new growth vectors for HCLTech. With our differentiated portfolio, we continue to demonstrate our ability to help clients leverage technology to drive their business strategies. We also remain focused on upskilling our people in emerging technologies and are embedding AI across the organization.”
Executive Operational Analysis
C Vijayakumar, CEO & Managing Director, HCLTech stated:
“We recorded our highest ever Q1 net-new bookings of $2.4Bn and our Advanced AI business grew 10.6% QoQ and 62.1% YoY in constant currency terms. These demonstrate that enterprises are choosing us to lead their AI-led transformation. Combined with the operational efficiencies visible in margin expansion, this momentum gives us the confidence we’re positioned to keep outpacing the market over the medium term.”
Financial Infrastructure Breakdown
Shiv Walia, Chief Financial Officer, HCLTech detailed:
“HCLTech delivered a steady Q1 FY27 performance, with revenue growth of 13.9% YoY, EBIT growth of 18.0% YoY and Net Income growth of 20.3% YoY. Excluding the impact of restructuring costs, EBIT margin and Net Income margin stood at 17.5% and 13.8%, respectively. Our cash generation continues to be robust, with OCF/NI at 111%, reflecting the strength and resilience of our business model.”
8. DEAL WINS & ADVANCED AI ORDER BOOK
The standout operational metric for the quarter was the performance of the net-new TCV pipeline, hitting $2,407 million. This strong order book provides solid revenue visibility for the next 24 to 36 months.
Strategic AI Engagements
HCLTech successfully expanded major enterprise relationships, highlighting a clear shift toward production-ready advanced automation deployments:
AI Factory Scaling: Expanded a multi-year partnership with a global technology leader on an AI Factory program, adding an incremental scope of over $180 million for AI data center buildouts using high-end GPU configurations to train large language models.
Physical AI Implementations: Deployed its proprietary VisionX platform for a top US pharmaceutical manufacturer to automate quality inspection compliance, while executing navigation stack integrations for automated guided vehicles (AGVs) in Europe via industrial robotics initiatives.
Automated Coding Pipelines: Scaled the HCL AI Force software development framework across multiple Fortune 500 enterprises, automating core testing, code translation, and legacy application migration workflows.
9. BALANCE SHEET & CAPITAL ALLOCATION STRATEGY
HCLTech’s balance sheet remains highly liquid, providing a strong buffer against wider macroeconomic shifts.
  [Gross Cash Reserves: ₹33,447 Crore]
  ├── Cash & Cash Equivalents: ₹9,188 Cr
  ├── Fixed Deposits: ₹18,222 Cr
  └── Treasury Investment Securities: ₹4,112 Cr
Pristine Liquidity Profile: Total gross cash assets rose to ₹33,447 crore. This cash position is distributed across cash equivalents (₹9,188 crore), fixed bank deposits (₹18,222 crore), and low-risk investment securities (₹4,112 crore).
Negligible Debt Leverage: Total outstanding long-term corporate borrowings were kept at just ₹159 crore, resulting in a net cash position of ₹26,907 crore.
Efficient Capital Returns: Backed by a strong 40.7% LTM Return on Invested Capital (ROIC), the Board declared a ₹12 per share interim dividend, continuing its policy of consistent capital return to equity shareholders.
10. PEER COMPARISON & RELATIVE VALUATION
To evaluate HCLTech’s positioning within the Indian IT services sector, we compare key valuation metrics against its major Tier-1 peers based on recent consensus market data.
| Comparative Parameter | HCL Technologies Limited PDF | Tata Consultancy Services (TCS) | Infosys Limited | Wipro Limited | Tech Mahindra |
| Trailing 12-Month P/E | 17.6x | 26.2x | 23.8x | 20.1x | 22.4x |
| EV / EBITDA Multiple | 11.8x | 18.1x | 16.2x | 13.4x | 14.5x |
| LTM ROIC (%) | 40.7% | 48.2% | 31.6% | 18.5% | 16.2% |
| FCF / Net Income Ratio | 99.0% | 102.0% | 96.0% | 92.0% | 88.0% |
| Dividend Yield Pacing | 3.8% – 4.2% | 2.5% | 2.8% | 1.5% | 2.1% |
Strategic Valuation Assessment
HCLTech continues to trade at a noticeable valuation discount relative to TCS and Infosys, despite posting a strong 20.3% YoY net profit jump this quarter. This lower multiple is partly due to the company’s large hardware and software product exposure through HCLSoftware, which the market historically prices at lower valuation multiples compared to pure digital services plays. For long-term capital allocators, a 17.6x P/E ratio alongside a 40.7% LTM ROIC offers a solid margin of safety.
11. RISK MATRIX
Macro Discretionary Spending Pauses: Persistent macroeconomic caution in North America could keep short-term revenue growth constrained to the lower end of management’s 1-4% guidance.
Prolonged Telecom Vertical Weakness: The 10.9% drop in Telecom CC revenues shows that global service providers are continuing to scale back capital allocations, which could act as a drag on wider services growth.
Product License Volatility: The seasonal unpredictability of HCLSoftware license renewals (which fell 5.3% YoY CC this quarter) could cause occasional margin volatility.
Geopolitical & Immigration Hurdles: Potential shifts in H-1B visa rules or visa caps in the US could increase onsite delivery costs, impacting gross margin structures.
12. FUTURE OUTLOOK & STRATEGIC GUIDANCE
Management reconfirmed its full-year FY27 constant currency growth guidance, maintaining targeted operational boundaries:
Consolidated Corporate Revenue Growth: 1.0% to 4.0% YoY in CC terms.
Total Services Segment Growth: 1.5% to 4.5% YoY in CC terms.
Consolidated Operating EBIT Margin: 17.5% to 18.5%.
Market Analysis of Guidance
The decision to leave guidance unchanged, despite a strong Q1 profit beat, suggests management is taking a conservative approach given ongoing global macroeconomic uncertainty. This conservative positioning could allow the company to surprise on the upside in subsequent quarters if enterprise IT spending picks up in the later half of the fiscal year.
13. BULL CASE VS. BEAR CASE ANALYSIS
| The Structural Bull Case (Reasons to Accumulate) | The Structural Bear Case (Reasons to Cautiously Monitor) |
Elite Capital Efficiency: Delivering a 40.7% LTM ROIC alongside an impressive 99% cash conversion metric. | Conservative Top-line Range: The 1-4% growth projection indicates near-term volume growth remains slow. |
Strong AI Position: Achieving quantifiable Advanced AI revenues ($171M) growing at 62.1% YoY CC. | Telecom Spending Headwinds: Face structural challenges from a sharp 10.9% drop in global telecom client allocations. |
| Attractive Entry Multiples: Trades at 17.6x trailing earnings, offering a valuation discount compared to Tier-1 peers. | Workforce Contraction Risks: A sequential drop of 3,292 resources could restrict execution speed if demand scales rapidly. |
Solid Dividend Cushion: Regular quarterly dividend payouts provide downside protection for income-focused portfolios. | Product Business Seasonality: Exposure to unpredictable license cycles within HCLSoftware. |
14. STRATEGIC INVESTOR TAKEAWAYS
For Long-Term Allocators: The company’s underlying fundamentals remain resilient. Consistent free cash flow conversion and strong returns on capital make the stock an attractive option for compounding portfolios during market dips.
For Dividend Growth Investors: The ₹12 per share interim dividend highlights HCLTech’s focus on shareholder returns, making it a reliable income play within the Nifty index.
For Retail Beginners: The company’s combination of services and software products provides a balanced exposure to the global tech ecosystem, offering lower volatility than pure-play mid-cap technology stocks.
Educational Reminder: This review is structured strictly for academic and informational research purposes. It does not constitute personalized investment, legal, or financial advice. Investors should perform independent research or consult a SEBI-registered advisory expert before allocating capital.
15. CONCLUSION
HCL Technologies’ Q1 FY27 results show a company successfully managing its operational efficiency during a period of slower industry-wide volume growth. The 20.3% surge in consolidated net profit, record Q1 deal signings, and rapid acceleration in Advanced AI revenues demonstrate a resilient underlying business model. While short-term market movements often focus on conservative quarterly guidance, long-term value is driven by strong returns on invested capital and free cash flow generation. For patient investors, HCLTech represents a high-quality asset trading at reasonable valuation multiples relative to its peer group.



