On July 21, 2026, JSW Infrastructure Limited (BSE: 543994 | NSE: JSWINFRA) officially submitted its unaudited standalone and consolidated financial results for the quarter ended June 30, 2026 (Q1 FY27) to the stock exchanges. The Board of Directors met between 2:00 PM and 3:45 PM IST to formally approve the financial performance reviewed by independent auditors Shah Gupta & Co.
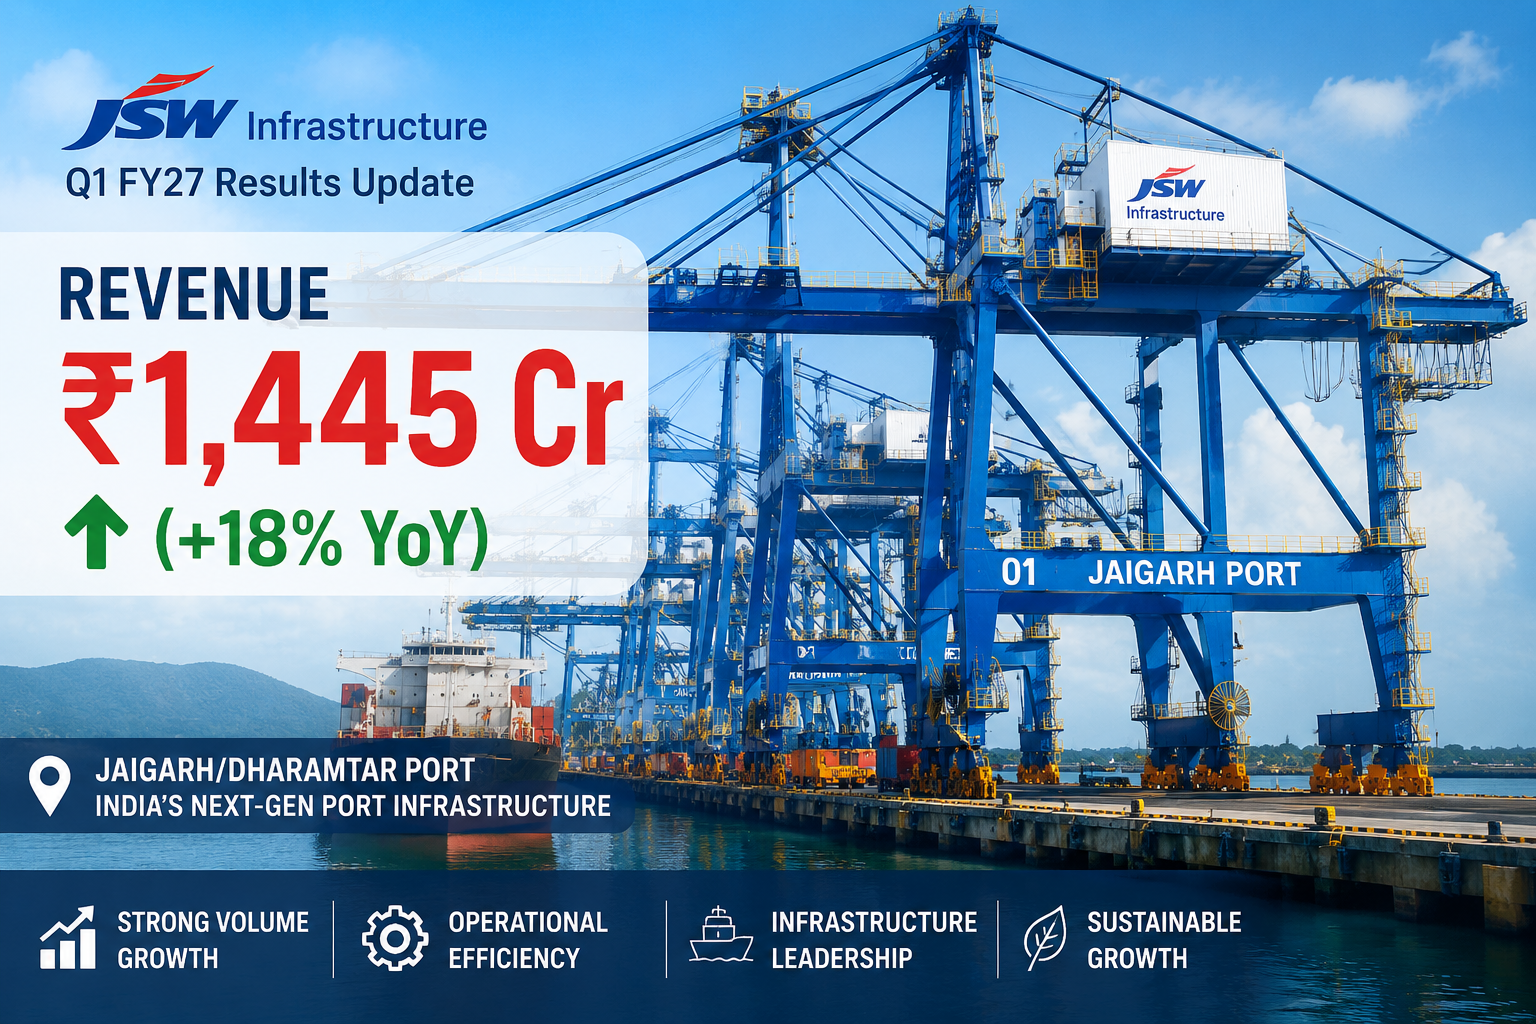
India’s second-largest commercial port operator reported a robust 18.06% Year-on-Year (YoY) revenue growth from operations at ₹1,444.83 crore, up from ₹1,223.85 crore in Q1 FY26, driven primarily by hyper-growth in its logistics vertical and strong cargo throughput across its maritime terminals. However, net profit for the quarter registered a modest decline of 8.21% YoY to ₹357.60 crore (compared to ₹389.57 crore in Q1 FY26), weighed down by higher operating overheads, expanded employee expenses, increased depreciation, and finance costs associated with newly integrated acquisitions and ongoing capacity ramp-ups.
A structural highlight of the quarter was the successful execution of a massive Qualified Institutions Placement (QIP) on June 26, 2026. The company successfully raised ₹6,555 crore by issuing 23.00 crore equity shares at ₹285 per share. This major equity infusion expands the paid-up share capital to ₹464.70 crore, drastically fortifies the company’s balance sheet, lowers net debt-to-equity ratios, and creates liquidity to accelerate its aggressive capacity targets.
+-----------------------------------------------------------------------------------+
|                        JSW INFRASTRUCTURE Q1 FY27 SNAPSHOT                         |
+-----------------------------------------------------------------------------------+
| Revenue from Operations : ₹1,444.83 Cr (+18.06% YoY | -5.09% QoQ)                |
| Operating EBITDA        : ₹673.83 Cr   (+2.12% YoY  | -13.98% QoQ)               |
| EBITDA Margin           : 46.64%       (-727 bps YoY)                             |
| Consolidated PAT        : ₹357.60 Cr   (-8.21% YoY  | -15.60% QoQ)               |
| PAT (Owners Share)      : ₹346.63 Cr   (-9.89% YoY  | -17.13% QoQ)               |
| Basic EPS               : ₹1.65        (vs ₹1.85 in Q1 FY26)                     |
| Capital Raised (QIP)    : ₹6,555.00 Cr (23.00 Cr shares @ ₹285/share)             |
+-----------------------------------------------------------------------------------+
Executive Summary
Solid Revenue Performance: Consolidated revenue from operations grew 18.06% YoY to ₹1,444.83 crore in Q1 FY27 from ₹1,223.85 crore in Q1 FY26, demonstrating resilient cargo handling volumes and operational scalability.
Logistics Segment Surges: Logistics revenue zoomed 71.73% YoY to ₹237.23 crore (vs ₹138.14 crore in Q1 FY26), proving that recent acquisitions (including Navkar Corporation Limited) are yielding commercial traction.
Profitability Under Pressure: Consolidated Profit After Tax (PAT) stood at ₹357.60 crore, down 8.21% YoY and 15.60% sequentially, affected by higher operational costs, depreciation on fresh assets, and financing expenses.
Operating EBITDA: Core operating profit (EBITDA) reached ₹673.83 crore for the quarter, representing an EBITDA margin of 46.64%. While lower than the 53.91% OPM reported in Q1 FY26, margins reflect the higher proportion of logistics business, which operates naturally at different margin profiles compared to port concessions.
Transformative QIP Capital Infusion: On June 26, 2026, the company completed a landmark ₹6,555 crore QIP. Equity share capital expanded from ₹417.04 crore to ₹464.70 crore (face value ₹2 per share).
Clean Exceptional Items: Q1 FY27 posted zero exceptional losses, unlike Q4 FY26 which absorbed ₹72.49 crore due to Fujairah liquid terminal storm damage and labor code adjustments.
Port Business Core Strength: Port Operations generated ₹1,207.60 crore in revenue and ₹462.33 crore in segment results, remaining the foundational profit generator for the group.
Balance Sheet Expansion: Total Segment Assets swelled to ₹27,900.75 crore as of June 30, 2026, up from ₹20,358.45 crore as of March 31, 2026, backed by liquidity from the QIP proceeds.
Strategic Outlook: With an operational capacity of 183 MTPA and a stated ambition to reach 400 MTPA capacity by 2030, JSW Infrastructure is capitalizing its execution platform for long-term compounding.
Company Snapshot
| Parameter | Company Details |
| Legal Entity Name | JSW Infrastructure Limited |
| BSE Scrip Code / NSE Symbol | 543994 / JSWINFRA |
| Industry / Sector | Infrastructure — Ports & Logistics Platform |
| Market Capitalization | ~₹80,600 Crore (Large Cap) |
| Current Market Price (CMP) | ₹346.00 – ₹348.50 |
| 52-Week High / Low | ₹356.00 / ₹233.00 |
| Face Value | ₹2.00 per share |
| Promoter Group Holding | ~83.62% |
| Key Assets & Presence | 12 Maritime Facilities across East & West Coasts of India, UAE Terminals, Inland Container Depots (ICDs) |
| Current Capacity | ~183 MTPA (Target: 400 MTPA by 2030) |
                     +----------------------------------+
                     |   JSW INFRASTRUCTURE LIMITED     |
                     |     Integrated Infra Platform    |
                     +-----------------+----------------+
                                       |
          +----------------------------+----------------------------+
          |                                                         |
+---------v----------+                                    +---------v----------+
|  PORT OPERATIONS   |                                    | LOGISTICS SERVICES |
|  12 Facilities     |                                    | Container Terminals|
|  Jaigarh, Dharamtar|                                    | Navkar Corp, Rails |
|  Paradip, Ennore   |                                    | ICDs, Value-Added  |
+--------------------+                                    +--------------------+
What Happened?
On July 21, 2026, JSW Infrastructure submitted its Q1 FY27 financial performance report to BSE and NSE. The market was acutely focused on three critical variables:
Topline Momentum: Whether port cargo volumes and integrated logistics revenue could offset seasonal trade slowdowns.
Margin Health: How cost structures adjusted amidst expanding third-party logistics.
QIP Capital Utilization: The balance sheet adjustments following the ₹6,555 crore QIP execution in late June.
The official filing demonstrates that while operational revenue grew by 18.06% YoY, profitability saw a temporary squeeze YoY and QoQ due to elevated operating costs (₹645.10 crore vs ₹536.33 crore in Q1 FY26) and depreciation expenses (₹165.79 crore vs ₹143.46 crore in Q1 FY26). Market participants view these results as operational expansion alongside foundational capital structuring.
Q1 FY27 Financial Highlights (Consolidated Comparison Table)
The following detailed matrix presents the audited and limited-reviewed financial metrics reported in the official filing:
| Financial Metric (in ₹ Crore) | Q1 FY27 (Unaudited) | Q4 FY26 (Unaudited) | Q1 FY26 (Unaudited) | YoY Growth (%) | QoQ Growth (%) |
| Revenue from Operations | 1,444.83 | 1,522.34 | 1,223.85 | +18.06% | -5.09% |
| Other Income | 56.80 | 89.66 | 89.85 | -36.78% | -36.65% |
| Total Income | 1,501.63 | 1,612.00 | 1,313.70 | +14.30% | -6.85% |
| Operating Expenses | 645.10 | 620.28 | 536.33 | +20.28% | +4.00% |
| Employee Benefits Expense | 56.35 | 70.74 | 52.94 | +6.44% | -20.34% |
| Finance Costs (Interest + FX) | 102.05 | 130.38 | 54.99 | +85.58% | -21.73% |
| Depreciation & Amortization | 165.79 | 158.16 | 143.46 | +15.56% | +4.82% |
| Other Expenses | 69.55 | 62.13 | 53.42 | +30.19% | +11.94% |
| Total Expenses | 1,038.84 | 1,041.69 | 841.14 | +23.50% | -0.27% |
| Operating EBITDA | 673.83 | 769.19 | 659.83 | +2.12% | -12.40% |
| EBITDA Margin (%) | 46.64% | 50.53% | 53.91% | -727 bps | -389 bps |
| Profit Before Exceptional Items & Tax | 462.79 | 570.31 | 472.56 | -2.07% | -18.85% |
| Exceptional Items | 0.00 | (72.49) | 0.00 | — | — |
| Profit Before Tax (PBT) | 462.79 | 497.82 | 472.56 | -2.07% | -7.04% |
| Total Tax Expense | 105.19 | 74.15 | 82.99 | +26.75% | +41.86% |
| Net Profit (PAT) Total | 357.60 | 423.67 | 389.57 | -8.21% | -15.60% |
| PAT Attributable to Owners | 346.63 | 418.29 | 384.68 | -9.89% | -17.13% |
| Basic EPS (₹) | 1.65 | 2.01 | 1.85 | -10.81% | -17.91% |
| Paid-up Share Capital | 464.70 | 417.04 | 415.98 | +11.71% | +11.43% |
Detailed Financial Analysis
REVENUE vs PAT TREND (₹ Crore)
=======================================
Q1 FY26  : Revenue 1,223.85 | PAT 389.57
Q4 FY26  : Revenue 1,522.34 | PAT 423.67
Q1 FY27  : Revenue 1,444.83 | PAT 357.60
=======================================
Topline Growth Analysis: Operational revenue rose 18.06% YoY to ₹1,444.83 crore. The growth highlights steady commercial volume across port terminals (Jaigarh, Dharamtar, Paradip, Ennore) and accelerated contributions from logistics assets. Sequentially, revenue receded 5.09%—a typical seasonal softening in Q1 as pre-monsoon shipping schedules moderate compared to the peak fiscal year-end Q4.
Operating EBITDA and Margin Squeeze: Core operating profit (calculated as Revenue from Operations minus OpEx, Employee Expenses, and Other Expenses) stood at ₹673.83 crore, reflecting a modest 2.12% YoY increase. EBITDA margin contracted by 727 bps YoY to 46.64%. This contraction stems from:
A higher revenue contribution from the logistics business (which operates at 20–25% margins versus 55–60% OPMs in concession-backed port terminals).
An increase in direct operating expenses (₹645.10 crore vs ₹536.33 crore YoY) due to higher power, fuel, and third-party handling tariffs.
Finance Costs & Foreign Exchange Impact: Total finance costs (including net foreign exchange adjustments) reached ₹102.05 crore for the quarter. While lower than Q4 FY26’s ₹130.38 crore, it expanded YoY from ₹54.99 crore in Q1 FY26, reflecting borrowing costs incurred for recent brownfield acquisitions.
Tax Overhead: Total tax outlay increased to ₹105.19 crore in Q1 FY27 (effective tax rate of ~22.7%) compared to ₹74.15 crore in Q4 FY26, further impacting final PAT growth.
Management Commentary & Corporate Actions
The Landmark ₹6,555 Crore Qualified Institutions Placement (QIP)
Note 7 of the official disclosure details the major corporate financing completed during the quarter:
Execution Date: June 26, 2026.
Capital Raised: ₹6,555.00 crore.
Shares Allotted: 23,00,00,000 Equity Shares (Face Value ₹2).
Issue Price: ₹285.00 per share (offered at a 1.84% discount of ₹5.35 to the regulatory floor price of ₹290.35 per share).
Impact on Share Capital: Paid-up share capital expanded from ₹417.04 crore to ₹464.70 crore.
Management Direction: Proceeds from this capital raise are earmarked to fund ongoing capital expenditure plans, lower elevated acquisition debt, and capitalize upcoming greenfield port projects (including Keni Port and Murbe Port) without over-leveraging the balance sheet.
Business Segment Analysis
JSW Infrastructure evaluates its performance across two primary operating divisions: Port Operations and Logistics Operations.
Q1 FY27 REVENUE SHARE BY SEGMENT
=================================
Port Operations     : ₹1,207.60 Cr (83.58%)
Logistics Operations:   ₹237.23 Cr (16.42%)
Total               : ₹1,444.83 Cr (100.00%)
=================================
Segment-Wise Breakdown Table
| Segment Name | Q1 FY27 Revenue (₹ Cr) | Q4 FY26 Revenue (₹ Cr) | Q1 FY26 Revenue (₹ Cr) | YoY Revenue Growth (%) | Q1 FY27 Segment Profit (₹ Cr) |
| Port Operations | 1,207.60 | 1,294.50 | 1,085.71 | +11.23% | 462.33 |
| Logistics Operations | 237.23 | 227.84 | 138.14 | +71.73% | 50.73 |
| Total Segment Output | 1,444.83 | 1,522.34 | 1,223.85 | +18.06% | 513.06 |
1. Port Operations Segment
Performance: Port revenues expanded 11.23% YoY to ₹1,207.60 crore. Segment profit reached ₹462.33 crore.
Key Drivers: High utilization across coal, iron ore, and liquid cargo handling facilities. Third-party customer volume continued to grow, diversifying earnings away from anchor group cargo.
2. Logistics Operations Segment
Performance: Logistics revenues surged 71.73% YoY to ₹237.23 crore from ₹138.14 crore in Q1 FY26. Segment result reached ₹50.73 crore (compared to ₹7.60 crore in Q1 FY26).
Key Drivers: Integration of Navkar Corporation assets, expansion in container train operations, and increased inland container depot (ICD) throughput.
Industry Analysis & Macroeconomic Factors
India’s maritime and infrastructure sectors continue to benefit from policy initiatives:
PM Gati Shakti Master Plan: Accelerating multimodal connectivity between inland production hubs and maritime gateways.
National Logistics Policy (NLP): Focused on reducing overall logistics costs from 13-14% of GDP down to single digits.
Third-Party Cargo Shift: Commercial port operators are increasing the proportion of non-captive, third-party cargo, boosting commercial pricing power and terminal utilization.
Peer Comparison
The following table contextualizes JSW Infrastructure’s positioning relative to listed peers in the Indian port and logistics ecosystem:
| Company Name | CMP (₹) | Market Cap (₹ Cr) | P/E Ratio | TTM Revenue (₹ Cr) | OPM (%) | ROCE (%) |
| JSW Infrastructure | 346.00 | 80,618 | 50.69x | 5,582 | 46.6% | 13.7% |
| Adani Ports & SEZ | 1,844.05 | 4,24,861 | 32.78x | 26,000+ | ~58.0% | 14.1% |
| Gujarat Pipavav Port | 150.80 | 7,290 | 14.61x | 1,000+ | ~55.0% | 28.1% |
| Container Corp of India | 498.25 | 30,300 | ~31.0x | 8,500+ | ~23.0% | 13.5% |
Key Insight: JSW Infrastructure trades at a premium valuation multiple (P/E ~50.7x), reflecting market expectations of high capacity compound growth (targeting 400 MTPA by 2030).
Technical Market View
Disclaimer: Technical analysis is probabilistic and intended for market monitoring rather than investment advice.
+-----------------------------------------------------------------------------------+
|                        JSWINFRA TECHNICAL INDICATORS SNAPSHOT                     |
+-----------------------------------------------------------------------------------+
| CMP                     : ₹346.00 – ₹348.50                                       |
| Key Support 1 / 2       : ₹334.75 / ₹327.35                                       |
| Key Resistance 1 / 2    : ₹353.45 / ₹360.85                                       |
| 52-Week High            : ₹356.00 / ₹355.80                                       |
| Trend Structure         : Higher Highs, Consolidating near All-Time Highs          |
+-----------------------------------------------------------------------------------+
Price Trend: The stock continues to trade near historical high zones (₹350–₹356 range).
Support Levels: Immediate technical support sits at ₹334.75 (1st Support) and ₹327.35 (2nd Support).
Resistance Levels: Key overhead hurdles lie at ₹353.45 and ₹360.85. A sustained breakout above ₹360 could clear technical room toward the ₹385–₹400 level.
Opportunities vs Risks
Strategic Opportunities
Capacity Expansion Engine: Growth plans targeting 400 MTPA by 2030 provide a long runway for volume expansion.
First-Mover Greenfield Advantage: Developing major non-major ports like Keni Port (Karnataka) and Murbe Port (Maharashtra) secures key concession corridors.
Synergistic Logistics Integration: The scaling of Navkar Corp and rail logistics creates cross-selling opportunities across port terminals.
Deleveraged Balance Sheet: The ₹6,555 crore QIP equity inflow significantly lowers net debt and expands headroom for capital allocation.
Key Investment Risks
Margin Dilution from Logistics Mix: Rapid expansion of lower-margin logistics activities may weigh down blended EBITDA margins.
Concentration Risk: Group captive trade (JSW Steel, JSW Energy) still accounts for a sizeable portion of total volume, exposing performance to steel production cycles.
Execution Delay in Greenfield Concessions: Regulatory, environmental, or construction delays at new port developments could stretch capex cycles.
Scenario Analysis
SCENARIO TARGET MATRIX (12-18 Month Horizon)
=====================================================
Bull Case  : ₹460 – ₹480 (30%+ volume growth, margin recovery)
Base Case  : ₹380 – ₹400 (15-18% revenue growth, stable OPM)
Bear Case  : ₹280 – ₹300 (Cargo slowdown, elevated capex drag)
=====================================================
Bull Case (Target: ₹460 – ₹480): Driven by volume growth exceeding 22% YoY, successful commissioning of brownfield expansions, rapid third-party cargo mix expansion (>50%), and margin expansion above 50%.
Base Case (Target: ₹380 – ₹400): Assumes 15–18% annual topline growth, stable EBITDA margins around 47–49%, and execution on greenfield sites in line with guidance.
Bear Case (Target: ₹280 – ₹300): Triggered by potential slowdowns in global trade, lower steel/coal handling volumes, or margin degradation from higher logistics operating costs.
What Should Investors Watch Next?
QIP Capital Deployment: Monitoring how the ₹6,555 crore raised is deployed across debt repayment and greenfield capex projects.
Monsoon Volume Trends: Observing throughput performance in Q2 FY27, which typically faces seasonal monsoon disruptions.
Third-Party Cargo Ratio: Tracking progress in growing non-JSW group cargo volumes toward long-term targets.
Project Execution Progress: Key updates regarding ground progress on Murbe and Keni port developments.
Editorial View & Conclusion
JSW Infrastructure’s Q1 FY27 financial performance highlights a company balancing near-term cost pressures with strategic scale expansion. While consolidated net profit moderated 8.21% YoY to ₹357.60 crore, the 18.06% growth in revenue from operations and 71.73% surge in logistics revenue demonstrate commercial momentum.
The defining development of the quarter is the successful ₹6,555 crore QIP equity raise. This major capital injection provides the financial flexibility needed to execute its capex plans and work toward its 400 MTPA capacity target by 2030 without straining leverage metrics. For long-term investors, JSW Infrastructure remains a core growth narrative within India’s port and logistics sector, though near-term valuation multiples require ongoing execution on its margin and volume targets.