

Introduction
Aurobindo Pharma Limited, one of India’s largest research-driven pharmaceutical powerhouses and export-oriented generic manufacturers, officially announced its unaudited standalone and consolidated financial results for the first quarter of the fiscal year 2026–27 (Q1 FY27) following its Board of Directors meeting on August 5, 2026. Coming off a period of dynamic market shifts across global healthcare, fluctuating raw material dynamics, regulatory oversight at generic facilities, and currency adjustments, this set of results was eagerly awaited by domestic institutional investors (DIIs), foreign portfolio managers (FIIs), and retail investors alike.
The market sentiment surrounding Indian pharmaceutical companies entering the first quarter of FY27 has been cautiously optimistic. Investors have been weighing the structural benefits of US drug shortage opportunities, pricing stability in oral solid generics, and expanding European market share against persistent challenges like regulatory inspections from the US Food and Drug Administration (USFDA), escalating solvent costs, and pricing pressure in classical active pharmaceutical ingredients (APIs).
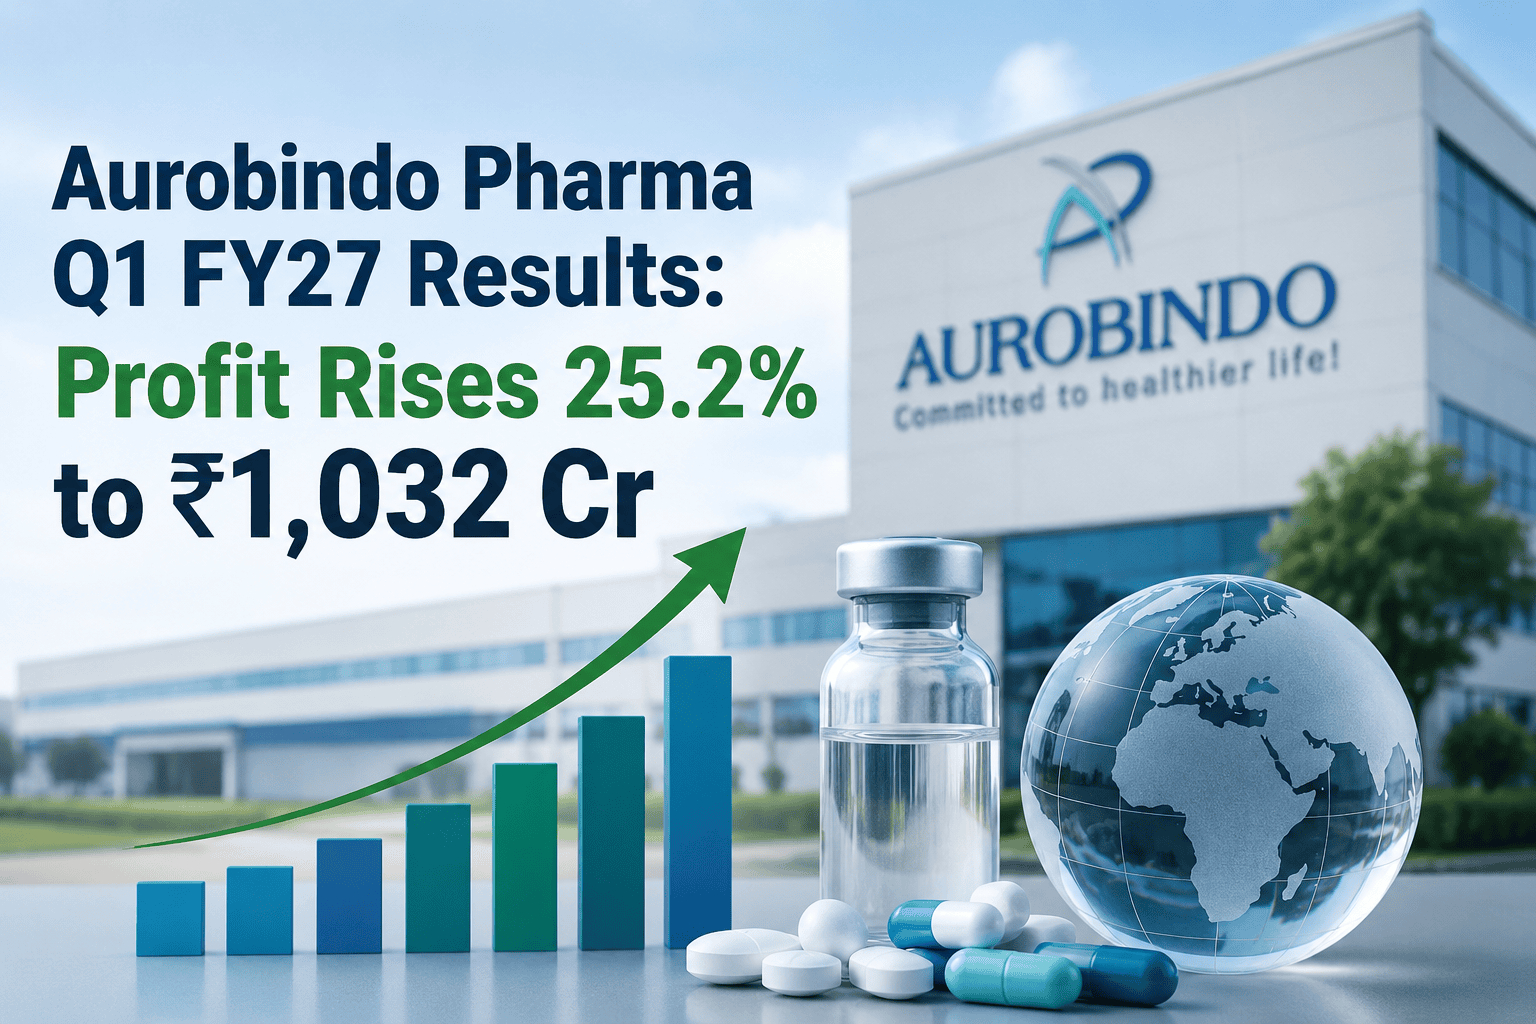
Aurobindo Pharma delivered a robust performance for Q1 FY27 that exceeded consensus street expectations. Driven by a double-digit expansion across its primary international markets—most notably a massive surge in European formulations—and firm execution in the United States, the company posted a 25.24% year-on-year (YoY) increase in consolidated net profit. Alongside top-line and bottom-line expansion, the company finalized strategic corporate actions, including closing its acquisition of US-based Lannett Company LLC and initiating a major corporate reorganization to consolidate its sterile injectables platform under Eugia Pharma Specialities.
Executive Summary & Data Snapshot
Aurobindo Pharma’s Q1 FY27 consolidated performance reflects operational leverage across its core geographic verticals, margin expansion, and a disciplined approach to balance sheet utilization.
The key metrics below summarize the company’s financial standing and operational status as of the quarter ended June 30, 2026:
| Key Financial & Valuation Metric | Q1 FY27 Value / Status | Primary Source / Context |
| Revenue from Operations | ₹9,150.35 Cr ($91.50 Bn) | Up 16.29% YoY |
| Operating EBITDA (excl. Forex/Other Inc) | ₹1,924.00 Cr | Up 20.02% YoY |
| Operating EBITDA Margin (%) | 21.03% | Expanded 60 bps YoY |
| Consolidated Net Profit (PAT) | ₹1,032.03 Cr ($10.32 Bn) | Up 25.24% YoY |
| Diluted Earnings Per Share (EPS) | ₹17.86 | Compared to ₹14.20 in Q1 FY26 |
| Gross Margin (%) | 58.82% | Supported by backward integration |
| Total Consolidated Income | ₹9,414.58 Cr | Includes ₹264.23 Cr other income |
| Market Capitalization | ₹93,706.50 Cr | Large Cap Pharma Enterprise |
| Current Market Share Price | ₹1,613.40 | As of August 5, 2026 close |
| 52-Week High / Low | ₹1,636.80 / ₹1,016.10 | Trading near 52-week peak |
| Price-to-Earnings (P/E) Ratio | 23.8x | TTM Earnings Basis |
| Price-to-Book (P/B) Ratio | 2.5x | Consolidated Equity Basis |
| Promoter Holding (%) | 51.88% | Stable core ownership |
| FII Holding (%) | 16.40% | Institutional ownership |
| DII Holding (%) | 25.10% | Mutual Funds & LIC participation |
| Public Shareholding (%) | 6.62% | Broad public float |
Q1 FY27 Key Highlights: Financial & Operational Review
+-----------------------------------------------------------------------+
|                 AUROBINDO PHARMA Q1 FY27 PERFORMANCE                  |
+-----------------------------------------------------------------------+
|  Consolidated Revenue : ₹9,150.35 Cr  (▲ 16.29% YoY)                 |
|  Operational EBITDA   : ₹1,924.00 Cr  (▲ 20.02% YoY)                 |
|  Consolidated PAT     : ₹1,032.03 Cr  (▲ 25.24% YoY)                 |
|  EBITDA Margin        : 21.03%        (▲ 60 bps YoY)                 |
|  Europe Revenue       : ₹2,937.00 Cr  (▲ 25.60% YoY)                 |
|  US Formulation Sales : ₹3,770.00 Cr  (▲ 8.10% YoY)                  |
+-----------------------------------------------------------------------+
Revenue Growth and Operational Momentum
Aurobindo Pharma generated a consolidated revenue from operations of ₹9,150.35 crore in Q1 FY27. This represents a 16.29% YoY expansion from ₹7,868.14 crore in Q1 FY26. On a sequential basis, revenue expanded by 3.35% quarter-on-quarter (QoQ) compared to ₹8,853.34 crore recorded in Q4 FY26.
The primary engine driving this growth was the formulation exports business, which surged 16.50% YoY to reach ₹8,101 crore. Operating leverage was particularly evident in Europe, where revenues climbed by more than a quarter, alongside steady volume gains and product launches in the United States.
Profitability and Margin Expansion
Operating EBITDA (calculated before foreign exchange fluctuations and other non-operating income) expanded by 20.02% YoY to reach ₹1,924.00 crore in Q1 FY27, up from ₹1,603.00 crore in Q1 FY26.
Consequently, the operational EBITDA margin expanded by 60 basis points YoY to settle at 21.03%. This margin expansion aligns with the management’s long-term guidance of sustaining consolidated EBITDA margins above the 21% threshold.
EBITDA Margin Trajectory:
Q1 FY26: 20.43%  ────►  Q4 FY26: 20.30%  ────►  Q1 FY27: 21.03% (+60 bps YoY)
The expansion in gross margins to 58.82% was facilitated by a favorable product mix, reduced freight rates compared to historical peaks, currency tailwinds from US Dollar and Euro appreciation against the Indian Rupee, and operational turnarounds in backward-integrated key starting materials (KSMs) such as Pen-G and 6-APA.
Expenses, Tax, and Financing Costs Analysis
A detailed examination of consolidated expenses discloses the following underlying cost trends for Q1 FY27:
Raw Material & Traded Goods Costs: Cost of materials consumed stood at ₹28,944.0 million, purchase of stock-in-trade reached ₹9,317.8 million, and changes in inventory resulted in a credit adjustment of (₹1,992.3 million). Total material cost represented 39.63% of total revenue from operations.
Employee Benefits Expense: Outlays grew to ₹14,801.5 million in Q1 FY27, up 20.45% YoY from ₹12,288.0 million in Q1 FY26, driven by annual merit increments, workforce expansion across new manufacturing units, and consolidation of acquired entities.
Finance Costs: Interest and finance charges were well controlled at ₹1,016.6 million in Q1 FY27 compared to ₹977.5 million in Q1 FY26, highlighting a stable borrowing structure.
Depreciation & Amortization: Amortization and depreciation outlays rose to ₹4,868.2 million in Q1 FY27 compared to ₹4,057.0 million in Q1 FY26, reflecting capital additions across greenfield sites and biological R&D assets.
Tax Analysis: Total tax expense for the quarter stood at ₹4,830.6 million (effective tax rate of ~31.88%), comprising current tax of ₹6,100.1 million and a deferred tax credit of (₹1,269.5 million).
Detailed Financial Performance Table
The following structured table provides a comparative breakdown of Aurobindo Pharma’s consolidated quarterly performance across Q1 FY27, Q4 FY26, and Q1 FY26:
| Consolidated Metric (in ₹ Cr) | Q1 FY27 (Unaudited) | Q4 FY26 (Unaudited) | Q1 FY26 (Unaudited) | YoY Change (%) | QoQ Change (%) |
Revenue from Operations | 9,150.35 | 8,853.34 | 7,868.14 | +16.29% | +3.35% |
Net Sales / Operating Income | 9,105.82 | 8,751.50 | 7,791.77 | +16.86% | +4.05% |
Other Operating Income | 44.53 | 101.84 | 76.37 | -41.69% | -56.27% |
Other Non-Operating Income | 264.23 | 117.04 | 105.30 | +150.93% | +125.76% |
Total Income | 9,414.58 | 8,970.38 | 7,973.44 | +18.07% | +4.95% |
Material Costs (COGS) | 3,626.95 | 3,429.07 | 3,239.22 | +11.97% | +5.77% |
Employee Costs | 1,480.15 | 1,373.98 | 1,228.80 | +20.45% | +7.73% |
Finance Costs | 101.66 | 98.21 | 97.75 | +4.00% | +3.51% |
Depreciation & Amortization | 486.82 | 478.57 | 405.70 | +19.99% | +1.72% |
Other Operating Expenses | 2,162.19 | 2,249.35 | 1,796.70 | +20.34% | -3.87% |
Total Expenses | 7,857.77 | 7,677.34 | 6,768.56 | +16.09% | +2.35% |
Exceptional Items (Expense) | 40.18 | 0.00 | 0.00 | N/A | N/A |
Profit Before Tax (PBT) | 1,515.09 | 1,290.61 | 1,206.80 | +25.55% | +17.39% |
Total Tax Expense | 483.06 | 369.77 | 382.60 | +26.26% | +30.64% |
Profit After Tax (PAT) | 1,032.03 | 920.84 | 824.20 | +25.24% | +12.07% |
Basic & Diluted EPS (in ₹) | 17.86 | 15.86 | 14.20 | +25.77% | +12.61% |
Segment-wise & Geographical Performance Analysis
Aurobindo Pharma operates primarily in a single reportable segment—Pharmaceuticals—in accordance with Ind AS 108. However, internally, management tracks revenues across primary geographic and business lines: Formulations (comprising US, Europe, Growth Markets, and ARV) and Active Pharmaceutical Ingredients (APIs).
+--------------------------------------------------------------------+
|               Q1 FY27 REVENUE BREAKDOWN BY GEOGRAPHY               |
+--------------------------------------------------------------------+
|  US Formulations       : ₹3,770 Cr ($399 Mn) | 41.2% Share       |
|  Europe Formulations   : ₹2,937 Cr (€267 Mn) | 32.1% Share       |
|  API Segment           : ₹1,049 Cr           | 11.5% Share       |
|  Growth Markets & ARV  : ₹1,394 Cr           | 15.2% Share       |
+--------------------------------------------------------------------+
1. United States Formulations
US Formulations represent Aurobindo Pharma’s largest sales vertical. In Q1 FY27, US formulation revenues grew by 8.10% YoY to ₹3,770 crore ($399 million), compared to ₹3,487 crore in Q1 FY26.
Growth in the US market was anchored by solid volume gains across oral solid dosage forms, continued market share capture in controlled substances, and the introduction of approximately 8–10 new ANDA products during the quarter. While pricing in core oral generics experienced typical low-single-digit price erosion, this was offset by supply reliability and new product launches.
The company is progressing toward its strategic target of achieving $2.0 billion in annual US sales, supported by the integration of recently acquired US assets.
2. Europe Formulations
Europe delivered the strongest regional growth performance for Aurobindo Pharma in Q1 FY27. European formulation revenues jumped 25.60% YoY to reach ₹2,937 crore (€267 million), up from ₹2,338 crore in Q1 FY26.
This expansion was achieved through market share gains in key European geographies including France (Arrow Generiques), Germany (Puren Pharma), Portugal (Generis Farmaceutica), Spain, and the UK (Milpharm). Increased penetration of hospital specialty products, expanded day-1 generic launches, and strong demand across prescription and OTC channels drove top-line growth and operating margin expansion.
3. Active Pharmaceutical Ingredients (API) Business
Aurobindo’s API business generated ₹1,049 crore in Q1 FY27, registering a 14.60% YoY growth compared to ₹915 crore in Q1 FY26.
The API division operates both as a commercial supplier to global pharma companies and as an internal backward-integration pillar for Aurobindo’s formulation facilities. Commercial API performance benefited from stabilizing pricing in cephalosporins and synthetic APIs. Crucially, the Penicillin-G (Pen-G) and 6-APA manufacturing infrastructure under step-down subsidiary Lyfius Pharma transitioned from gestational loss phases into EBITDA-positive territory, helping lower overall raw material reliance.
4. Growth Markets & ARV Business
Growth markets (comprising Latin America, Rest of World, South Africa, and Southeast Asia) and Anti-Retroviral (ARV) formulations generated a combined revenue of ₹1,394 crore in Q1 FY27. Growth markets expanded in double digits on the back of new registrations in Brazil, Mexico, and Indonesia. The ARV business remained stable, supported by steady procurement tenders from institutional global health bodies.
Product Portfolio, ANDA Pipeline, and Regulatory Status
USFDA Filings & Pipeline Momentum
Aurobindo Pharma maintains a large filing pipeline for the US market. As of June 30, 2026, the company’s cumulative abbreviated new drug application (ANDA) profile stands as follows:
Cumulative ANDA Filings: 896 Filings
Final Approvals Received: 737 ANDAs
Tentative Approvals: ~30 ANDAs
Pending Approvals: ~129 ANDAs (Focusing heavily on complex injectables, ophthalmic suspensions, depot formulations, and inhalation products)
USFDA Regulatory Compliance & Manufacturing Updates
Maintaining high regulatory standards across its global manufacturing footprint remains a critical priority for Aurobindo Pharma.
Eugia Units Update: The company’s sterile injectables business under Eugia Pharma Specialities has been undergoing facility remediation. While certain facilities (such as Eugia Unit-I and Unit-III) previously faced official action indicated (OAI) classifications or inspection observations, management has implemented comprehensive Corrective and Preventive Actions (CAPA).
Acquisition of Lannett Company LLC: On June 29, 2026, Aurobindo completed the 100% membership acquisition of US-based Lannett Company LLC (along with subsidiaries Kremers Urban, Silarx, and Cody Laboratories) for $247.1 million (₹2,334.88 crore). This transaction provides Aurobindo with immediate US domestic liquid, suspension, and controlled substance manufacturing infrastructure, diversifying its regulatory footprint.
A1 Biochem Acquisition: Subsequent to the quarter end, on July 23, 2026, subsidiary Apitoria Pharma agreed to acquire an 80% stake in A1 Biochem Group for $13.6 million to strengthen specialty chemical and API research capabilities.
Management Commentary & Growth Outlook
During the post-earnings communications, Vice Chairman & Managing Director Mr. K. Nithyananda Reddy and the executive leadership team highlighted the key operational achievements for Q1 FY27:
Key Takeaways from Executive Remarks:
Sustainable Margin Trajectory: Management expressed confidence in holding consolidated EBITDA margins above the 21.0% threshold for the full fiscal year FY27, supported by favorable operating leverage in Europe, launch of complex generics, and commercial scaling of the Pen-G plant.
Corporate Reorganization of Eugia: The Board approved the merger of wholly owned step-down subsidiaries Eugia Steriles Private Limited and Eugia SEZ Private Limited into Eugia Pharma Specialities Limited. This amalgamation simplifies corporate hierarchy, reduces administrative overhead, optimizes treasury management, and consolidates sterile injectable assets into a unified operational vehicle.
Pen-G & 6-APA Project Commercialization: Backward integration initiatives through Lyfius Pharma are progressing as planned. Having cleared trial phases and turned EBITDA-positive, internal consumption of Pen-G is expected to progressively insulate Aurobindo from global starting material cost volatility.
Biosimilars & CuraTeQ Pipeline: Development under CuraTeQ Biologics continues to advance. The company is preparing for global dossier submissions for biosimilar trastuzumab, pegfilgrastim, and bevacizumab, targeting commercial launches in regulated markets over FY27–FY28.
Balance Sheet, Cash Flow, and Financial Ratio Analysis
Aurobindo Pharma maintains a healthy balance sheet, characterized by substantial equity reserves, manageable leverage, and strong cash conversion.
Share Capital Reduction (Buyback Completion)
During the quarter, the company completed a share buyback program approved on April 6, 2026. Aurobindo bought back and extinguished 5,423,728 equity shares (representing 0.93% of total paid-up equity) at a maximum price of ₹1,475 per share for a total consideration of ₹8,065.3 million (including expenses). Consequently, paid-up equity share capital was reduced from ₹580.8 million to ₹575.4 million.
Financial Ratio Profile
| Key Financial Ratio | Q1 FY27 | FY26 Full Year | Analytical Assessment |
| EBITDA Margin (%) | 21.03% | 20.40% | Expanding due to operating leverage |
PAT Margin (%) | 11.28% | 10.41% | Net profit expansion |
| Return on Equity (ROE) (%) | ~15.2% | ~14.1% | Trailing 12-month return on equity basis |
| Return on Capital Employed (ROCE) | ~17.8% | ~16.5% | Reflects improving asset turnover |
Debt-to-Equity Ratio | 0.18x | 0.15x | Conservative capital structure |
Interest Coverage Ratio | 15.9x | 14.5x | Comfortable debt service capacity |
Current Ratio | 2.10x | 2.15x | Strong working capital position |
Quick Ratio | 1.25x | 1.30x | Liquid asset coverage |
Valuation Analysis & Peer Comparison
At the current market price of ₹1,613.40 (as of August 5, 2026 close), Aurobindo Pharma commands a market capitalization of ₹93,706.50 crore. The stock trades at a trailing twelve-month (TTM) P/E multiple of 23.8x and a Price-to-Book (P/B) ratio of 2.5x.
+--------------------------------------------------------------------+
|               VALUATION MULTIPLES COMPARISON (TTM)                 |
+--------------------------------------------------------------------+
|  Aurobindo Pharma : 23.8x P/E  |  2.5x P/B  | 21.0% EBITDA Margin  |
|  Sun Pharma       : 36.2x P/E  |  5.1x P/B  | 27.5% EBITDA Margin  |
|  Dr. Reddy's Labs : 19.5x P/E  |  3.1x P/B  | 25.2% EBITDA Margin  |
|  Cipla Ltd        : 28.4x P/E  |  3.8x P/B  | 23.8% EBITDA Margin  |
|  Lupin Ltd        : 34.1x P/E  |  4.2x P/B  | 19.8% EBITDA Margin  |
+--------------------------------------------------------------------+
Peer Comparison Table
| Company Name | Market Cap (₹ Cr) | TTM Revenue (₹ Cr) | TTM Net Profit (₹ Cr) | P/E Ratio (x) | ROE (%) | EBITDA Margin (%) |
| Aurobindo Pharma | 93,706.50 | 34,935.00 | 3,711.00 | 23.8x | 15.2% | 21.0% |
| Sun Pharma | 4,12,500.00 | 51,200.00 | 10,850.00 | 36.2x | 17.5% | 27.5% |
| Dr. Reddy’s Labs | 1,18,400.00 | 30,100.00 | 5,620.00 | 19.5x | 18.2% | 25.2% |
| Cipla Ltd | 1,22,300.00 | 26,800.00 | 4,450.00 | 28.4x | 16.1% | 23.8% |
| Lupin Ltd | 98,500.00 | 21,400.00 | 2,850.00 | 34.1x | 13.8% | 19.8% |
| Torrent Pharma | 1,12,000.00 | 11,200.00 | 1,890.00 | 55.4x | 22.1% | 31.2% |
Analytical Valuation Takeaway
Aurobindo Pharma trades at a noticeable valuation discount relative to peers like Sun Pharma, Cipla, and Torrent Pharma, primarily due to its historically higher concentration of generic oral solids and past regulatory volatility. However, as the company increases its mix of complex injectables through Eugia, commercializes its biosimilars pipeline through CuraTeQ, and benefits from backward integration, there is room for a valuation re-rating toward industry medians.
Technical Analysis & Share Price Reaction
Following the earnings announcement after market hours on August 5, 2026, the stock opened in positive territory on August 6, 2026. Over the preceding 52-week period, the stock has traded between a low of ₹1,016.10 and a high of ₹1,636.80, demonstrating strong outperformance with a 38.30% 1-year gain.
Technical Indicator Snapshot (Daily Charts):
• Current Price: ₹1,613.40
• 50-Day EMA: ₹1,519.80 (Bullish Support)
• 100-Day EMA: ₹1,451.80
• 200-Day EMA: ₹1,360.90 (Long-Term Trendline Base)
• 14-Day RSI: 62.4 (Healthy Momentum Zone)
Support Levels: Immediate support is pegged at ₹1,565 (10-day EMA), followed by major structural support at ₹1,520 (50-day EMA).
Resistance Levels: Immediate overhead resistance rests at the 52-week peak of ₹1,636.80. A decisive breakout above ₹1,640 on heavy volume could open technical upside toward ₹1,720–₹1,750.
Positive Triggers vs. Key Risks
Growth Catalysts (Positive Triggers)
European Formulation Outperformance: 25.6% YoY growth in Europe underscores robust commercial distribution and market share gains.
Backward Integration Benefits: Commercially scaling the Pen-G plant under Lyfius Pharma provides a cost advantage for key antibiotic APIs.
Eugia Injectables Reorganization: Merging three sterile injectable units consolidates operations and lowers overhead costs.
Closing of Lannett Acquisition: Adds immediate US domestic manufacturing infrastructure, supporting US sales expansion.
Key Risks & Challenges
USFDA Regulatory Inspections: Any re-inspection issues or delayed clearance at Eugia sterile facilities could constrain high-margin injectable supplies.
Raw Material & Solvent Cost Pressure: Escalating prices for key organic solvents and basic chemicals could test margin guidance.
Price Erosion in Core US Generics: Sustained double-digit price erosion in oral solids could offset new launch gains.
Foreign Exchange Volatility: Currency swings across the US Dollar, Euro, and emerging market currencies impact reported top-line figures.
SWOT Analysis
| Strengths | Weaknesses |
• Scale in global generic formulations • Broad portfolio with 737 approved ANDAs • Strong backward integration in Pen-G/6-APA • Diversified presence in US, Europe, & APIs | • Past USFDA observations across injectable sites • Lower domestic formulation market presence • Vulnerability to global raw material cost inflation |
| Opportunities | Threats |
• Corporate streamlining of Eugia injectables • US manufacture via Lannett acquisition • Biosimilar commercialization via CuraTeQ • Expansion in complex generics and growth markets | • Potential USFDA regulatory enforcement • Accelerated price erosion in core oral generics • Foreign exchange rate volatility |
Environmental, Social, and Governance (ESG) Overview
Aurobindo Pharma continues to advance its ESG commitments:
Environmental: The company’s investment in renewable energy is reflected in its recent acquisition of a 26% stake in Swarnaakshu Solar Power Private Limited to increase green energy usage across its Telangana manufacturing plants.
Social: Through the Aurobindo Pharma Foundation, the enterprise funds community healthcare, skill development, and rural infrastructure initiatives near its manufacturing hubs.
Governance: Independent directors chair key audit, stakeholder relationship, and risk management committees. The audit committee and statutory auditors Deloitte Haskins & Sells issued an unmodified review report for Q1 FY27.
Investment View & Strategic Stance
+--------------------------------------------------------------------+
|                   INVESTOR PERSPECTIVE MATRIX                      |
+--------------------------------------------------------------------+
|  Short-Term / Swing Traders : Accumulate on dips toward 50-DMA    |
|  Long-Term Growth Investors : Positive; Re-rating candidate        |
|  Value Investors            : Attractive relative to pharma peers  |
|  Dividend Investors         : Moderate yield (~0.3% to 0.8%)       |
+--------------------------------------------------------------------+
Short-Term Traders: The stock exhibits positive momentum above its 50-day EMA (₹1,520). Swing traders may consider accumulating on dips toward ₹1,560–₹1,580, setting stop-losses below ₹1,510, with short-term resistance targets at ₹1,640 and ₹1,700.
Long-Term Growth Investors: Aurobindo presents a solid structural growth case. Expanding EBITDA margins (21.03%), strong European execution, backward integration benefits, and biosimilar commercialization support earnings visibility over FY27–FY29.
Value Investors: Trading at 23.8x TTM P/E against an industry peer average exceeding 30x, the stock offers a margin of safety for long-term investors.
Final Verdict: Buy, Hold, or Avoid?
Aurobindo Pharma’s Q1 FY27 results confirm an operational turnaround supported by top-line growth (16.29% YoY), net profit expansion (25.24% YoY), and margin execution (21.03% EBITDA margin). The structural merger of its Eugia step-down subsidiaries and the acquisition of Lannett Company LLC further enhance business operational quality.
Final Rating: ACCUMULATE / OUTPERFORM
Reasoning: Supported by strong fundamental performance, disciplined capital allocation, backward integration in key starting materials, and reasonable valuations, Aurobindo Pharma remains well-positioned for sustainable performance. Long-term investors may accumulate the stock in a phased manner.
(Disclaimer: This financial analysis is for educational and news reporting purposes only and does not constitute personalized investment advice. Investors should consult a qualified SEBI-registered financial advisor before making investment decisions.)



