1. Result Summary
Sajjan Jindal-led power utility giant JSW Energy Limited reported its financial and operational results for the first quarter ended June 30, 2026 (Q1 FY27) following its Board meeting on July 22, 2026.
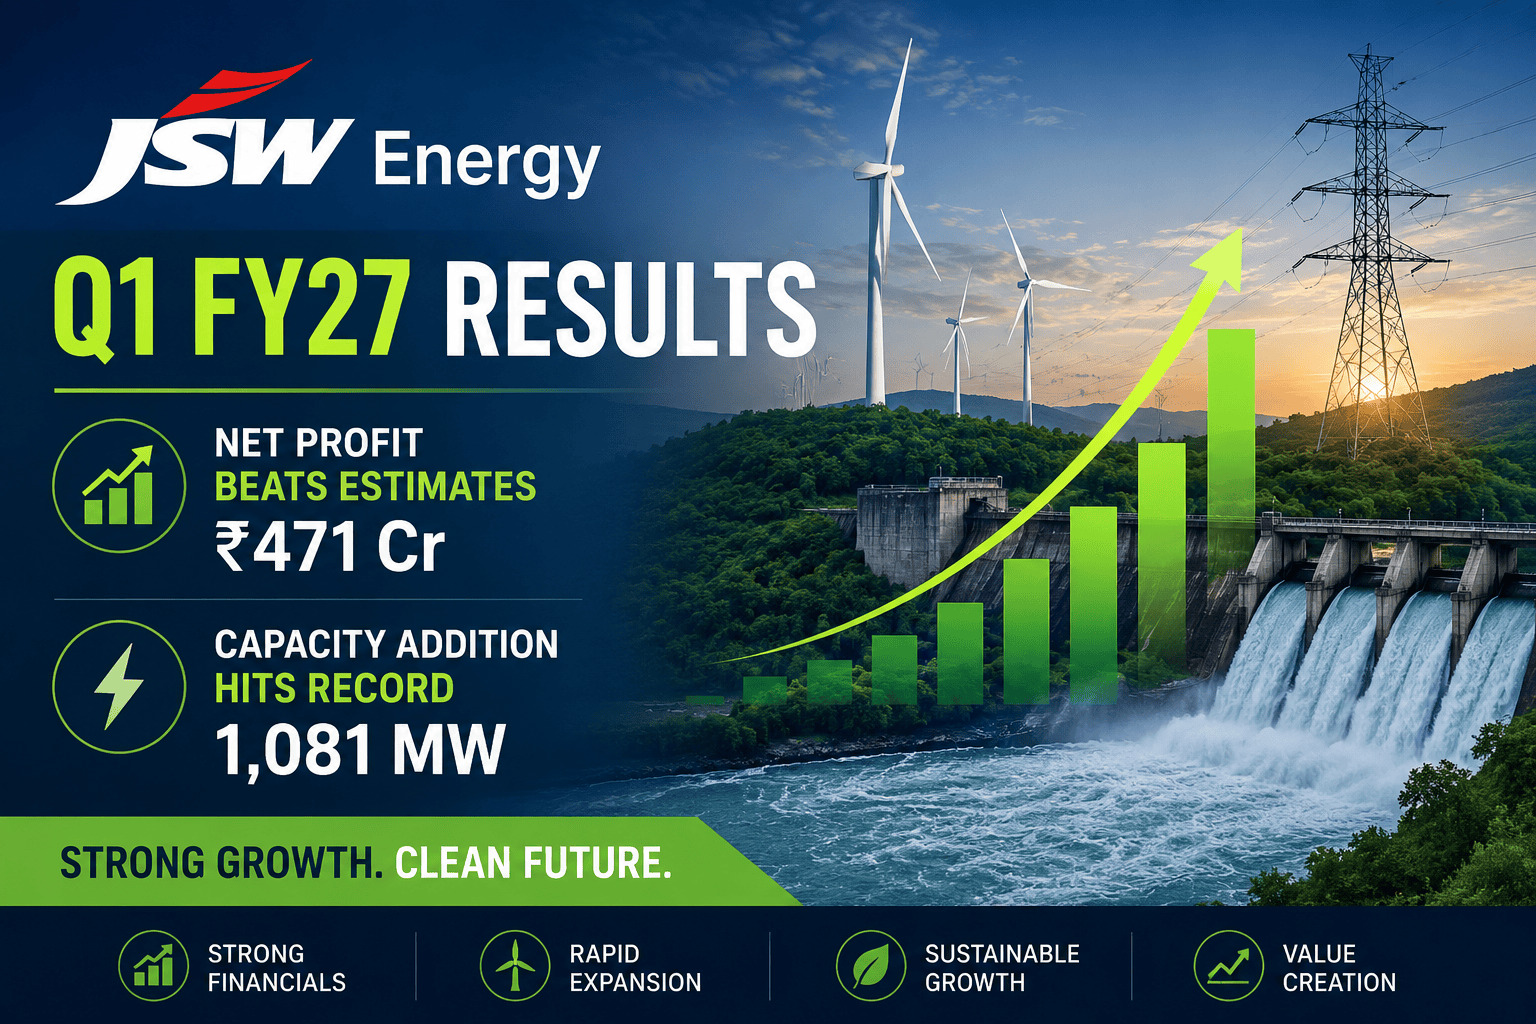
The utility recorded a consolidated net profit attributable to owners of ₹470.97 crore. While this represents a 36.62% YoY contraction compared to ₹743.12 crore in Q1 FY26—primarily driven by higher financing costs and depreciation from aggressive capacity commissionings—the bottom-line figure comfortably beat market consensus estimates of ~₹320 crore by over 46%. Consolidated Revenue from Operations held steady at ₹5,207.13 crore (+1.24% YoY, +15.75% QoQ), beating consensus expectations of ~₹4,916 crore.
┌──────────────────────────────────────────────────────────────────────────────┐
│                    JSW ENERGY Q1 FY27 EARNINGS HIGHLIGHTS                    │
├──────────────────────────┬──────────────────────────┬────────────────────────┤
│ Revenue from Operations  │ Consolidated EBITDA      │ PAT (Attributable)     │
│ ₹5,207 Cr (+1.2% YoY)    │ ₹3,103 Cr (+2.0% YoY)    │ ₹471 Cr (-36.6% YoY)   │
├──────────────────────────┼──────────────────────────┼────────────────────────┤
│ Organic Capacity Added   │ Total Installed Capacity │ Cash & Equivalents     │
│ +1,081 MW (Record Q1)    │ 14,535 MW (61% Green)    │ ₹12,881 Cr             │
└──────────────────────────┴──────────────────────────┴────────────────────────┘
The quarter marked a structural turning point in JSW Energy’s operational velocity. Driven by its Strategy 3.0 execution framework, the company added a record 1,081 MW of operational capacity since April 2026, bringing total installed generation capacity to 14,535 MW (14.53 GW), with green energy constituting 61% of the portfolio.
On the equity markets, JSW Energy shares closed slightly lower at ₹561.70 (-0.79%) on the NSE on July 22, 2026, as traders balanced the year-on-year profit dip against the robust street beat and balance sheet deleveraging achieved via a ₹4,000 crore QIP and ₹3,150 crore monetization of JSW Steel shares.
2. Executive Summary
Revenue Resilience: Consolidated Revenue from Operations reached ₹5,207.13 crore, up 1.24% YoY from ₹5,143.37 crore in Q1 FY26 and up 15.75% QoQ from ₹4,498.58 crore in Q4 FY26. Total income stood at ₹5,436.57 crore.
EBITDA Expansion: Consolidated EBITDA expanded by 2% YoY to ₹3,103 crore (or ₹2,873 crore at the operating line), yielding an EBITDA margin of 55.22% – 57.0%.
Profit Beat Against Estimates: Total Net Profit After Tax (PAT) stood at ₹532.70 crore. PAT attributable to owners was ₹470.97 crore, down 36.6% YoY due to higher finance costs (+16.4% YoY to ₹1,519 Cr) and depreciation (+20.5% YoY to ₹890 Cr), but beat consensus estimates (~₹320 Cr) by 46.88%.
Record Capacity Commissioning: Added 1,081 MW of capacity since April 2026 (873 MW in Q1 FY27), comprising 442 MW Solar, 108 MW Wind, 381 MW Hybrid, and the 150 MW Tidong Hydro project. Total installed capacity reached 14,535 MW.
Power Sales Volume: Net generation/sales stood at 12,868 Million Units (MUs) (-5% YoY, +10% QoQ). Thermal generation fell 6% YoY to 8.0 BUs, while Hydro generation dropped 26% YoY to 1,423 MUs due to weaker seasonal hydrology. Solar generation rose 29% YoY to 1,197 MUs.
Balance Sheet De-leveraging: Raised ₹4,000 crore via QIP on May 25, 2026 and monetized JSW Steel shares for ₹3,150 crore gross proceeds. Net debt reduced to ₹61,322 crore, with a healthy cash balance of ₹12,881 crore. Net Debt-to-Equity improved to 1.70x.
Inorganic Growth & Integration: Signed a definitive agreement to acquire 300 MW Maruti Clean Coal & Power Ltd for EV of ~₹1,410 crore; increased stake in Toshiba JSW Power Systems JV to 10.7%; operationalized Halol wind blade facility (450 blades/yr); secured first external BESS battery order worth ₹443.74 crore.
3. Key Numbers At A Glance
Consolidated Financial Summary (Ind AS)
| Metric (in ₹ Crore unless stated) | Q1 FY27 (Unaudited) | Q4 FY26 (Audited) | Q1 FY26 (Unaudited) | YoY Change (%) | QoQ Change (%) | FY26 (Full Year) |
| Revenue from Operations | 5,207.13 | 4,498.58 | 5,143.37 | +1.24% | +15.75% | 18,901.13 |
| Other Income | 229.44 | 352.29 | 267.87 | -14.35% | -34.87% | 976.59 |
| Total Income | 5,436.57 | 4,850.87 | 5,411.24 | +0.47% | +12.07% | 19,877.72 |
| Fuel Cost | 1,531.72 | 1,340.14 | 1,579.76 | -3.04% | +14.30% | 5,581.38 |
| Employee Benefits Expense | 216.24 | 184.39 | 158.74 | +36.22% | +17.27% | 727.66 |
| Finance Costs | 1,519.28 | 1,608.49 | 1,305.52 | +16.37% | -5.55% | 5,816.45 |
| Depreciation & Amortization | 889.64 | 808.96 | 738.59 | +20.45% | +9.97% | 3,185.27 |
| Total Expenses | 4,742.90 | 4,666.31 | 4,398.82 | +7.82% | +1.64% | 17,838.44 |
| Profit Before Tax (PBT) | 695.81 | 187.80 | 1,015.41 | -31.47% | +270.51% | 1,985.82 |
| Tax Expense | 166.04 | (275.58) | 196.25 | -15.39% | N/A | (611.42) |
| Total Net Profit (PAT) | 532.70 | 573.53 | 835.86 | -36.27% | -7.12% | 2,762.41 |
| PAT Attributable to Owners | 470.97 | 371.57 | 743.12 | -36.62% | +26.75% | 2,239.31 |
| Basic EPS (₹) | 2.64 | 2.12 | 4.26 | -38.03% | +24.53% | 12.82 |
| Cash PAT (₹ Crore) | 1,464 | — | 1,574 | -6.99% | — | — |
| Net Debt (₹ Crore) | 61,322 | — | — | Reduced | — | — |
| Cash & Cash Equivalents (₹ Cr) | 12,881 | — | — | Ample | — | — |
4. Business Overview & Strategic Architecture
JSW Energy Limited, the power arm of the USD 25 billion JSW Group, operates a fully integrated power platform spanning thermal generation, renewable energy (hydro, wind, solar, hybrid), power transmission, energy storage, and backward integrated manufacturing.
┌──────────────────────────────────────────────────────────────────────────────┐
│                  INSTALLED GENERATION PORTFOLIO (14,535 MW)                  │
├──────────────────────────────────────┬───────────────────────────────────────┤
│ Thermal Generation Capacity          │ 5,658 MW (39% of Portfolio)           │
│ Renewable Generation Capacity        │ 8,877 MW (61% of Portfolio)           │
│   • Wind Assets                      │ 3,125 MW                              │
│   • Solar Assets                     │ 2,275 MW                              │
│   • Hydro Assets                     │ 1,781 MW                              │
│   • Hybrid Assets                    │ 1,696 MW                              │
└──────────────────────────────────────┴───────────────────────────────────────┘
Business Segments & Assets
Thermal Power (5,658 MW): Key plants located at Vijayanagar (Karnataka), Ratnagiri (Maharashtra), Barmer (Rajasthan), Mahanadi (Chhattisgarh), Utkal (Odisha), and Nandyal (Andhra Pradesh).
Renewable Energy (8,877 MW): Comprises large hydro stations (Karcham Wangtoo, Baspa II, Kutehr, and newly commissioned 150 MW Tidong), operational wind farms across Rajasthan, Karnataka, and Maharashtra, solar utility plants, and hybrid installations.
Energy Products & Backward Integration:
Halol Wind Blade Plant: Manufacturing capacity of 450 blades/year (~600 MW/yr support) operationalized in June 2026.
Battery Assembly (BESS): 5 GWh assembly facility; secured ₹443.74 Cr order for 200 MW/400 MWh system in July 2026.
Equipment & Boilers: 10.7% stake in Toshiba JSW Power Systems and pending NCLT approval for GE Power India’s Durgapur boiler business demerger.
5. Detailed Quarter Financial Performance
Revenue & Profitability Breakdown
During Q1 FY27, total revenue stood at ₹5,207.13 crore. Operational revenue stayed resilient despite a 5% YoY decline in overall sales volumes (12,868 MUs vs 13,494 MUs), supported by steady realization tariffs and higher contribution from newly added solar assets.
┌──────────────────────────────────────────────────────────────────────────────┐
│                    CONSOLIDATED COST BREAKDOWN (Q1 FY27)                     │
├───────────────────────────────┬───────────────────┬──────────────────────────┤
│ Fuel Cost                     │ ₹1,531.72 Cr      │ 32.29% of Total Expenses │
│ Finance Costs                 │ ₹1,519.28 Cr      │ 32.03% of Total Expenses │
│ Depreciation & Amortization   │ ₹889.64 Cr        │ 18.76% of Total Expenses │
│ Other Operating Expenses      │ ₹587.14 Cr        │ 12.38% of Total Expenses │
│ Employee Benefits Expense     │ ₹216.24 Cr        │  4.56% of Total Expenses │
├───────────────────────────────┼───────────────────┼──────────────────────────┤
│ Total Operating Expenses      │ ₹4,742.90 Cr      │ 100.0%         │
└───────────────────────────────┴───────────────────┴──────────────────────────┘
Expense Dynamics Analysis
Fuel Costs: Reduced by 3.04% YoY to ₹1,531.72 crore, reflecting lower imported coal prices and efficient fuel management across thermal plants.
Finance Costs: Surged by 16.37% YoY to ₹1,519.28 crore. This increase stems directly from interest expense recognition on debts tied to newly commissioned capacity. Weighted average cost of debt stands at 8.36%.
Depreciation: Increased by 20.45% YoY to ₹889.64 crore as greenfield renewable projects and the Tidong Hydro plant were added to the fixed asset register.
6. Operational Performance & Segment Analysis
Plant-by-Plant Generation & Plant Load Factor (PLF)
| Location / Plant | Q1 FY27 Generation (MUs) | Q1 FY26 Generation (MUs) | YoY Change (%) | Q1 FY27 PLF / CUF (%) | Q1 FY26 PLF / CUF (%) |
| Thermal Segment | 8,029 | 8,500 | -5.54% | — | — |
| • Vijayanagar | 1,363 | 1,430 | -4.69% | 79% (110% Deemed) | 82% (85% Deemed) |
| • Ratnagiri | 1,911 | 2,061 | -7.28% | 79% (92% Deemed) | 86% (100% Deemed) |
| • Barmer | 1,312 | 1,390 | -5.61% | 64% (78% Deemed) | 70% (78% Deemed) |
| • Mahanadi | 2,559 | 2,743 | -6.71% | 70% (78% Deemed) | 75% (98% Deemed) |
| • Utkal | 864 | 855 | +1.05% | 61% (66% Deemed) | 61% |
| • Nandyal | 20 | 25 | -20.00% | — | — |
| Renewable Segment | 4,840 | 4,990 | -3.01% | — | — |
| • Hydro (inc. Tidong) | 1,423 | 1,911 | -25.54% | 42% (Long-term) | 64% |
| • Solar | 1,197 | 925 | +29.41% | 21% (CUF) | 21% (CUF) |
| • Wind | 2,220 | 2,154 | +3.06% | 27% (CUF) | 30% (CUF) |
| Total Net Generation | 12,868 | 13,494 | -4.64% | — | — |
  Renewable Net Generation (Million Units)
  Q1 FY26: 4,990 MUs  [Hydro: 1,911 | Solar: 925 | Wind: 2,154]
  Q1 FY27: 4,840 MUs  [Hydro: 1,423 | Solar: 1,197 | Wind: 2,220]
  Key Trend: Solar generation expanded +29% YoY offsetting 26% seasonal dip in Hydro.
Segment Revenue & Results (Ind AS Disclosures)
| Segment | Segment Revenue Q1 FY27 (₹ Cr) | Segment Revenue Q1 FY26 (₹ Cr) | Segment Profit Before Tax Q1 FY27 (₹ Cr) | Segment Profit Before Tax Q1 FY26 (₹ Cr) |
| Thermal Power | 3,453.46 | 3,621.78 | 1,066.26 | 1,268.45 |
| Renewable Energy | 1,740.48 | 1,491.82 | 998.22 | 936.29 |
| Unallocated | 13.19 | 29.77 | 4.51 | 21.99 |
| Total | 5,207.13 | 5,143.37 | 2,068.99 | 2,226.73 |
7. Deep-Dive: Why Profit Declined YoY Despite Strong Operational Beat
Investors tracking headline earnings noted a 36.6% decline in net profit attributable to owners (₹471 Cr vs ₹743 Cr). Understanding this divergence between stable top-line operating performance and reported PAT requires examining the accounting mechanics of capital intensive utility expansions:
┌──────────────────────────────────────────────────────────────────────────────┐
│                 P&L BRIDGE: OPERATING STABILITY TO PAT DROP                  │
├──────────────────────────────────────────────────────────────────────────────┤
│ 1. Operating EBITDA: Remained strong at ₹3,103 Cr (+2.0% YoY)      │
│ 2. Incremental Depreciation: -₹151 Cr (-20.5% YoY rise to ₹890 Cr) │
│ 3. Incremental Interest Cost: -₹214 Cr (-16.4% YoY rise to ₹1,519 Cr)│
│ 4. Hydro Generation Deficit: -488 MUs (-25.5% YoY drop in Hydro)   │
│ 5. Bottomline Impact: Consolidated PBT fell from ₹1,015 Cr to ₹696 Cr│
└──────────────────────────────────────────────────────────────────────────────┘
Accounting Impact of Capitalization: As JSW Energy commissions assets (+1,081 MW added), interest expenses previously capitalized under Construction Work-In-Progress (CWIP) transfer directly to the P&L finance cost line.
Depreciation Front-Loading: Fresh asset commissionings immediately trigger straight-line depreciation charges before peak plant revenue yields normalize.
Hydro Seasonality & Hydrology Deficit: Water flow variations in Northern India led to a 26% decline in hydro generation (1,423 MUs vs 1,911 MUs). Because hydro assets generate high-margin peak power, reduced generation drags PBT.
Street Expectation Reset: Equity research analysts had already factored in hydro softness and higher interest outgoes, setting consensus net profit expectations low (~₹320 Cr). Actual PAT of ₹471 Cr outperformed these estimates.
8. Strategic Capital Allocation & Balance Sheet Strengthening
JSW Energy executed two major equity capital initiatives during Q1 FY27, strengthening its balance sheet and providing growth capital for its Strategy 3.0 target (30 GW by 2030):
1. Qualified Institutional Placement (QIP)
Date of Allotment: May 25, 2026.
Capital Raised: ₹4,000 crore.
Issue Details: Allotted 7,61,90,476 equity shares (face value ₹10) at ₹525 per share (discount of ₹9.05 to floor price of ₹534.05).
Purpose: Funding renewable capex pipelines and net leverage reduction.
2. Strategic Liquidity Release (JSW Steel Stake Monetization)
Date of Execution: May 18, 2026.
Shares Divested: 2,50,00,000 equity shares of JSW Steel Limited via bulk deal.
Gross Proceeds: ₹3,150 crore.
Accounting Treatment: Measured at Fair Value Through Other Comprehensive Income (FVTOCI) under Ind AS 109. Cumulative net gain of ₹2,816.80 crore was transferred from OCI reserve directly into Retained Earnings. JSW Energy retains 4,50,38,350 shares of JSW Steel.
┌──────────────────────────────────────────────────────────────────────────────┐
│                    BALANCE SHEET LIQUIDITY & DEBT PROFILE                    │
├──────────────────────────────────────┬───────────────────────────────────────┤
│ Cash and Cash Equivalents Buffer     │ ₹12,881 Crore               │
│ Consolidated Net Debt                │ ₹61,322 Crore               │
│ Net Debt to Equity Ratio             │ 1.70x                       │
│ Operational Net Debt to EBITDA       │ 4.95x (excl. CWIP)          │
│ Consolidated Net Worth               │ ₹36,161 Crore               │
└──────────────────────────────────────┴───────────────────────────────────────┘
9. Inorganic Growth & Vertical Backward Integration
1. Acquisition of Maruti Clean Coal & Power Limited (MCCPL)
Agreement Date: June 13, 2026.
Target Asset: 100% equity stake in MCCPL, owning a 300 MW operational thermal power plant in Korba, Chhattisgarh.
Enterprise Value: ~₹1,410 crore (adjusted for cash).
PPA Cushion: Long-term Power Purchase Agreement (PPA) for 195 MW net capacity with Rajasthan DISCOMs, carrying a residual PPA term of 14 years.
2. Stake Increase in Toshiba JSW Power Systems JV
Transaction: Increased equity stake in Toshiba JSW Power Systems Private Limited to 10.7% on a fully diluted basis (20.7% non-diluted) for ₹150 crore.
Strategic Rationale: Secures domestic power equipment supply chains and de-risks thermal plant expansion costs. Transaction consummated on July 21, 2026.
3. Equipment & Battery Manufacturing Scale-up
Halol Wind Blade Plant: Commissioned June 8, 2026 in Gujarat. Annual capacity of 450 blades (~600 MW wind installations/yr).
First External BESS Order: Step-down subsidiary JSW Energy PSP Eleven secured an order worth ₹443.74 crore for 200 MW/400 MWh battery storage solutions on July 10, 2026.
10. Management Commentary & Strategy 3.0 Roadmap
CEO Operational Perspective
Sharad Mahendra, Joint Managing Director and CEO of JSW Energy, stated:
“Q1 FY27 has been a landmark quarter for JSW Energy, marked by our highest-ever quarterly organic capacity addition in the Company’s history among the largest Q1 organic additions across the power sector. We remain firmly on track to deliver our FY27 capacity addition target of 3 GW, having already crossed nearly a third of it within the first quarter itself, a reflection of the pace and discipline of execution under Strategy 3.0.”
“Our strategic fund raises add to an already strong balance sheet, giving us the headroom to fund this growth and reduce leverage, while our continued investment in backward integration capabilities strengthens our execution edge—together keeping us firmly on course to deliver our FY30 targets.”
┌──────────────────────────────────────────────────────────────────────────────┐
│                    STRATEGY 3.0 LONG-TERM VISION (FY30)                      │
├──────────────────────────────────────────────────────────────────────────────┤
│ • Total Target Capacity: 30 GW (30,000 MW) by 2030                 │
│ • Near-Term Target: 20 GW by FY27 (Constructing 13 GW currently)   │
│ • Energy Storage Capacity: 40 GWh / 5 GW of Pumped Hydro & BESS              │
│ • Green Hydrogen Production: Commercial green molecule production scale       │
└──────────────────────────────────────────────────────────────────────────────┘
11. Macro & Power Industry Dynamics
India’s power demand continued its upward trend in Q1 FY27, driven by industrial activity and summer cooling requirements:
Peak Demand Trends: Peak national power demand hovered near record levels of ~250 GW during early summer months, requiring high thermal PLFs alongside renewable generation.
Thermal Capacity Requirements: The Ministry of Power’s directive emphasizing thermal capacity additions alongside green energy supports JSW Energy’s dual strategy of operating thermal base-load assets while scaling renewables.
Storage Framework Tariffs: Central utilities are issuing larger tenders for Battery Energy Storage Systems (BESS) and Pumped Storage Projects (PSP), opening growth avenues for JSW Energy’s PSP pipeline.
12. Comprehensive Financial Ratio & Balance Sheet Health
Pursuant to SEBI LODR Regulation 52(4), JSW Energy disclosed key financial ratios:
| Financial Ratio | Q1 FY27 | Q4 FY26 | Q1 FY26 | Formula / Definition |
| Debt-Equity Ratio (Consolidated) | 1.70x / 2.05x | 2.47x | 2.36x | Total Borrowings / Equity Attributable to Owners |
| Interest Service Coverage Ratio (ISCR) | 2.21x | 1.73x | 2.52x | (PBT + Dep + Int) / Finance Costs |
| Debt Service Coverage Ratio (DSCR) | 1.25x | 0.49x | 1.23x | Operating Cash Surplus / Debt Service Outflow |
| Current Ratio | 1.02x | 0.76x | 0.89x | Current Assets / Current Liabilities |
| Debtors Turnover (DSO) | 65 Days | 62 Days | 58 Days | (Average Receivables / Revenue) * 90 Days |
| Operating EBITDA Margin (%) | 55.22% | 50.08% | 54.28% | (EBITDA / Revenue from Operations) * 100 |
| Net Profit Margin (%) | 9.80% | 11.82% | 15.45% | (Net Profit After Tax / Total Income) * 100 |
| Consolidated Net Worth (₹ Cr) | 30,901.82 | 23,501.31 | 21,187.05 | Per Sec 2(57) of Companies Act |
13. Valuation & Peer Group Comparison
Below is the valuation positioning of JSW Energy against major listed power peers in India as of July 22, 2026:
| Company Name | CMP (₹) | Market Cap (₹ Cr) | P/E Ratio (TTM) | Price-to-Book (P/B) | Dividend Yield (%) | Installed Capacity (GW) |
| JSW Energy | 561.70 | 1,03,078 | 47.7x | 3.28x | 0.36% | 14.53 GW |
| NTPC Ltd | 347.25 | 3,36,766 | 12.5x | 1.65x | 2.40% | 76.00 GW |
| Adani Green Energy | 1,530.00 | 2,51,960 | 137.6x | 14.20x | 0.00% | 11.10 GW |
| NHPC Ltd | 81.00 | 81,385 | 21.6x | 1.82x | 2.36% | 7.10 GW |
| SJVN Ltd | 69.10 | 27,151 | 42.3x | 1.95x | 2.11% | 2.40 GW |
14. Shareholding Pattern & Institutional Footprint
┌──────────────────────────────────────────────────────────────────────────────┐
│                   JSW ENERGY SHAREHOLDING PATTERN (Q1 FY27)                   │
├──────────────────────────────────────────────────────┬───────────────────────┤
│ Promoter & Promoter Group Holding                    │ 66.88%                │
│ Foreign Institutional Investors (FII / FPI)           │ 15.20%                │
│ Domestic Institutional Investors (DII / MFs)         │  9.80%                │
│ Retail & Public Shareholders                         │  8.12%                │
└──────────────────────────────────────────────────────┴───────────────────────┘
The completion of the ₹4,000 crore QIP in May 2026 expanded institutional equity holding, introducing domestic mutual funds and global long-only funds to the cap table.
15. Stock Market Reaction & Technical Setup
JSW Energy’s share price traded down 0.79% to close at ₹561.70 on July 22, 2026, reflecting a balanced market response:
┌──────────────────────────────────────────────────────────────────────────────┐
│                      TECHNICAL CHART LEVELS MAP                              │
├──────────────────────────┬──────────────────────────┬────────────────────────┤
│ Immediate Resistance     │ Key Support Level        │ 52-Week Range          │
│ ₹585.00 – ₹600.00        │ ₹540.00 – ₹525.00        │ ₹428.00 – ₹617.00      │
└──────────────────────────┴──────────────────────────┴────────────────────────┘
Moving Average Positioning: The stock continues to hold above its key 200-day simple moving average (SMA), maintaining a bullish long-term structure.
Support Base: Strong technical support sits in the ₹525–₹540 range, matching the QIP issuance price of ₹525 per share.
Momentum Oscillators: RSI (14-day) sits around 52, indicating neutral-to-positive momentum.
16. Brokerage Consensus & Analyst Views
Institutional brokerages highlighted the following takeaways from JSW Energy’s Q1 FY27 disclosure:
EBITDA Beat & Capacity Execution: Analysts noted that execution under Strategy 3.0 remains ahead of targets, with 1,081 MW commissioned in Q1 alone.
De-leveraging Impact: The ₹7,150 crore cumulative liquidity events (QIP + JSW Steel sale) significantly derisked net debt ratios.
Target Outlook: Consensus ratings lean toward Buy / Outperform, with average 12-month target prices ranging between ₹640 and ₹680, citing medium-term capacity additions.
17. Comprehensive Risk & Opportunity Matrix
┌──────────────────────────────────────────────────────────────────────────────┐
│                         RISKS vs OPPORTUNITIES                               │
├──────────────────────────────────────┬───────────────────────────────────────┤
│ KEY RISKS                            │ KEY OPPORTUNITIES                     │
├──────────────────────────────────────┼───────────────────────────────────────┤
│ 1. Seasonal Hydrology Fluctuations   │ 1. 13 GW Under-Construction Pipeline  │
│ 2. Short-Term Debt Service Costs     │ 2. Battery Storage (BESS) External    │
│ 3. Offtake PPA Tariff Realizations   │    Equipment Orders (₹443 Cr)         │
│ 4. Coal Import Cost Spikes           │ 3. Halol Wind Blade Manufacturing     │
└──────────────────────────────────────┴───────────────────────────────────────┘
18. SWOT Analysis
Strengths
Diversified generation mix across thermal, hydro, wind, and solar assets.
In-house backward integration (wind blade manufacturing, battery assembly).
Strong liquidity buffer with ₹12,881 crore in cash reserves.
Weaknesses
Hydro segment sensitivity to monsoon variations.
Debt levels driven by ongoing 13 GW capacity buildout.
Opportunities
Acquisition of distressed or operational assets like Maruti Clean Coal.
Expansion into Green Hydrogen and BESS tenders.
Threats
Regulatory changes in grid balancing and merchant tariff caps.
Supply chain bottlenecks in global solar module procurement.
19. Investment Thesis: Bull, Base & Bear Scenarios
┌──────────────────────────────────────────────────────────────────────────────┐
│                         INVESTOR SCENARIO ANALYSIS                           │
├──────────────────────────────────────────────────────────────────────────────┤
│ 🟢 BULL CASE: Rapid commissioning of 3 GW in FY27; BESS orderbook scales;   │
│    Hydro generation rebounds; Net Debt/EBITDA drops below 4.0x.              │
│    Target Price Range: ₹670 – ₹720                                           │
├──────────────────────────────────────────────────────────────────────────────┤
│ 🟡 BASE CASE: On-track capacity additions; stable thermal PLFs (~75-80%);    │
│    Net Debt/Equity holds at ~1.5x-1.7x; steady EBITDA compounding (+15% YoY). │
│    Target Price Range: ₹590 – ₹630                                           │
├──────────────────────────────────────────────────────────────────────────────┤
│ 🔴 BEAR CASE: Construction delays in renewable projects; sustained lower    │
│    hydrology; debt costs remain elevated at >8.5%.                          │
│    Target Price Range: ₹480 – ₹510                                           │
└──────────────────────────────────────────────────────────────────────────────┘