1. Introduction
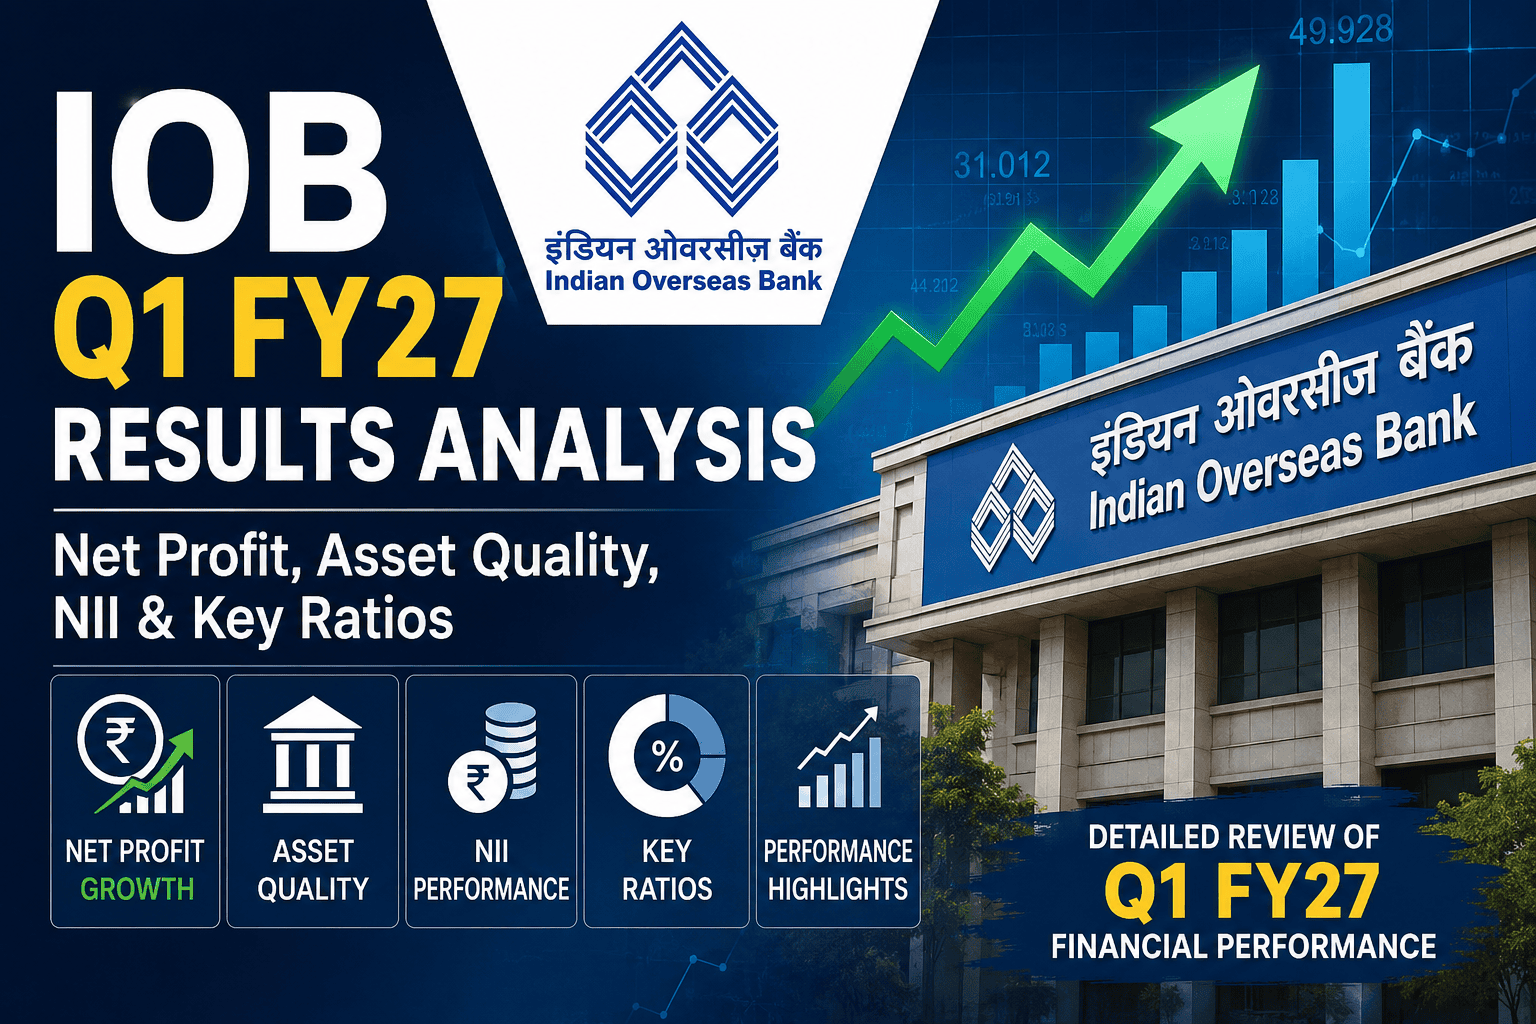
Indian Overseas Bank (NSE: IOB | BSE: 532388), one of India’s prominent public sector lenders, announced its financial results for the first quarter of FY27 (ended June 30, 2026) on July 20, 2026. The bank registered a 49.34% YoY surge in standalone Net Profit to ₹1,659.24 crore, driven by robust interest earnings, expanded core operating profits, and continuing improvements in asset quality metrics.
The performance highlights a major operational transformation for the Chennai-headquartered PSU bank. Once restricted under the RBI’s Prompt Corrective Action (PCA) framework due to elevated stress, IOB has reshaped its operational trajectory. Gross Non-Performing Assets (GNPA) declined to a multi-year low of 1.33%, while Net NPA tightened to 0.18%.
+-----------------------------------------------------------------------------------+
|                        IOB Q1 FY27 AT A GLANCE (STANDALONE)                       |
+------------------------------------+----------------------------------------------+
| Metric                             | Q1 FY27 Performance                          |
+------------------------------------+----------------------------------------------+
| Standalone Net Profit              | ₹1,659.24 Cr (+49.34% YoY)                    |
| Total Income                       | ₹10,937.80 Cr (+23.36% YoY)                   |
| Operating Profit                   | ₹2,693.10 Cr (+14.21% YoY)                    |
| Gross NPA %                        | 1.33% (down 64 bps YoY)                      |
| Net NPA %                          | 0.18% (down 14 bps YoY)                      |
| Provision Coverage Ratio (PCR)     | 97.67%                                       |
| Return on Assets (ROA)             | 1.41% (annualized)                           |
| Capital Adequacy Ratio (CRAR)      | 19.36% (CET-1: 16.88%)                       |
+------------------------------------+----------------------------------------------+
Key Takeaways:
IOB’s net profit surged to ₹1,659.24 crore, registering a 49.34% YoY growth.
Asset quality reached high standards, with Gross NPA down to 1.33% and Net NPA at 0.18%.
The bank fortified its capital buffer with a Basel III CRAR of 19.36%.
2. Executive Summary
Robust Profit Growth: Standalone Net Profit grew 49.34% YoY to ₹1,659.24 crore in Q1 FY27, up from ₹1,111.04 crore in Q1 FY26. On a QoQ basis, Net Profit increased by 10.22% from ₹1,505.45 crore in Q4 FY26.
Expansion in Total Income: Total Standalone Income reached ₹10,937.80 crore, representing a 23.36% YoY growth compared to ₹8,866.47 crore in Q1 FY26.
Core Interest Earnings: Interest earned increased 18.85% YoY to ₹8,777.57 crore (versus ₹7,385.55 crore in Q1 FY26), driven by higher yield on advances and expansion in retail and wholesale credit portfolios.
Strong Non-Interest Revenue: Other Income expanded to ₹2,160.23 crore in Q1 FY27, compared to ₹1,480.92 crore in Q1 FY26 and ₹1,290.91 crore in Q4 FY26.
Operating Profit Expansion: Operating Profit before provisions and contingencies rose 14.21% YoY to ₹2,693.10 crore (compared to ₹2,357.95 crore in Q1 FY26).
Significant Asset Quality Improvement: Gross NPA dropped by 64 bps YoY to 1.33% (₹4,292.26 crore), while Net NPA declined by 14 bps YoY to 0.18% (₹588.42 crore).
Pristine Provision Coverage: Provision Coverage Ratio (PCR) stood at 97.67% as of June 30, 2026, among the highest in the public sector banking space.
Fortified Capital Cushion: Basel III Capital Adequacy Ratio (CRAR) reached 19.36%, with Common Equity Tier 1 (CET-1) standing at 16.88%.
Balance Sheet Clean-Up Action: On July 10, 2026, IOB offset its entire accumulated losses of ₹8,733.34 crore against its Share Premium account, resetting its reserve structure for potential dividend distributions in future years.
3. Key Numbers at a Glance
Standalone Financial Performance Matrix (₹ in Lakhs)
| Parameter | Q1 FY27 (Unaudited) | Q4 FY26 (Audited) | Q1 FY26 (Unaudited) | YoY Change (%) | QoQ Change (%) |
| Interest Earned | 8,77,757 | 8,48,896 | 7,38,555 | +18.85% | +3.40% |
| – Interest on Advances | 6,66,236 | 6,44,231 | 5,50,910 | +20.93% | +3.42% |
| – Income on Investments | 1,97,751 | 1,91,203 | 1,82,880 | +8.13% | +3.42% |
| Other Income | 2,16,023 | 1,29,091 | 1,48,092 | +45.87% | +67.34% |
| Total Income | 10,93,780 | 9,77,987 | 8,86,647 | +23.36% | +11.84% |
| Interest Expended | 5,08,995 | 5,01,925 | 4,63,930 | +9.71% | +1.41% |
| Operating Expenses | 3,15,475 | 2,09,557 | 1,86,922 | +68.77% | +50.54% |
| – Employee Costs | 2,10,445 | 1,00,589 | 1,16,648 | +80.41% | +109.21% |
| – Other Operating Costs | 1,05,030 | 1,08,968 | 70,274 | +49.46% | -3.61% |
| Total Expenditure | 8,24,470 | 7,11,482 | 6,50,852 | +26.68% | +15.88% |
| Operating Profit | 2,69,310 | 2,66,505 | 2,35,795 | +14.21% | +1.05% |
| Provisions (Non-Tax) | 83,403 | 1,00,596 | 84,405 | -1.19% | -17.09% |
| – Provisions for NPAs | 10,554 | 22,529 | 17,848 | -40.87% | -53.15% |
| Profit Before Tax (PBT) | 1,85,907 | 1,65,909 | 1,51,390 | +22.80% | +12.05% |
| Tax Expense | 19,983 | 15,364 | 40,286 | -50.39% | +30.06% |
| Net Profit (PAT) | 1,65,924 | 1,50,545 | 1,11,104 | +49.34% | +10.22% |
| Basic EPS (₹) | 0.86 | 0.78 | 0.58 | +48.28% | +10.26% |
(Source: Official IOB SEBI Filing, Dated July 20, 2026)
4. Quarter-on-Quarter (QoQ) Analysis
Analyzing performance compared to Q4 FY26 demonstrates continued expansion across core operational levers:
      +---------------------------------------------------------------+
      |                 IOB QOQ PERFORMANCE TRAJECTORY               |
      +---------------------------------------------------------------+
      |  Total Income   : ₹9,77,987 Lakhs  --->  ₹10,93,780 Lakhs     |
      |  Net Profit     : ₹1,50,545 Lakhs  --->  ₹ 1,65,924 Lakhs     |
      |  Gross NPA (%)  :     1.42%        --->        1.33%          |
      |  Net NPA (%)    :     0.21%        --->        0.18%          |
      +---------------------------------------------------------------+
Top-Line Momentum: Total income rose 11.84% QoQ to ₹10,937.80 crore, supported by a 67.34% QoQ jump in other income (fee income, Treasury operations, and recoveries).
Interest Income Growth: Interest earned grew 3.40% QoQ from ₹8,488.96 crore in Q4 FY26 to ₹8,777.57 crore in Q1 FY27.
Operating Expense Dynamics: Operating expenses rose 50.54% QoQ to ₹3,154.75 crore, primarily due to higher employee benefit provisions (₹2,104.45 crore vs ₹1,005.89 crore in Q4 FY26), reflecting interim actuarial valuation updates for pension, gratuity, and leave encashment.
Provisioning Normalization: Non-tax provisions declined by 17.09% QoQ to ₹834.03 crore (down from ₹1,005.96 crore in Q4 FY26), as specific NPA provisioning requirements fell by 53.15% QoQ to ₹105.54 crore.
Key Takeaways:
QoQ Net Profit improved by 10.22%, led by non-interest revenue growth.
Employee expense provisions saw an increase due to actuarial adjustments.
Asset quality metrics improved further from Q4 FY26 levels.
5. Year-on-Year (YoY) Analysis
Comparing Q1 FY27 against Q1 FY26 highlights IOB’s structural improvements over the past 12 months:
+-----------------------------------------------------------------------------------+
|                        YOY KEY FINANCIAL METRICS COMPARISON                       |
+------------------------------------+------------------+------------------+--------+
| Parameter (₹ in Crores)            | Q1 FY26          | Q1 FY27          | YoY %  |
+------------------------------------+------------------+------------------+--------+
| Interest Earned                    | 7,385.55         | 8,777.57         | +18.85%|
| Other Income                       | 1,480.92         | 2,160.23         | +45.87%|
| Total Income                       | 8,866.47         | 10,937.80        | +23.36%|
| Operating Profit                   | 2,357.95         | 2,693.10         | +14.21%|
| Standalone PAT                     | 1,111.04         | 1,659.24         | +49.34%|
| Consolidated PAT                   | 1,178.45         | 1,716.29         | +45.64%|
+------------------------------------+------------------+------------------+--------+
Operational & Financial Drivers
Loan Book Expansion: Interest earned on advances grew 20.93% YoY to ₹6,662.36 crore, driven by credit growth across RAM (Retail, Agriculture, MSME) segments.
Margin Protection: Controlled interest expenditure growth (+9.71% YoY to ₹5,089.95 crore) helped protect core spreads despite competitive deposit pricing pressures across the banking system.
Efficiency Ratios: The annualized Return on Assets (ROA) expanded by 27 bps YoY to 1.41%, compared to 1.14% in Q1 FY26. Net Profit Margin improved to 15.17% in Q1 FY27 from 12.53% in Q1 FY26.
6. Segment-wise Performance
IOB operates across four primary business segments: Treasury, Corporate/Wholesale Banking, Retail Banking, and Other Banking Operations.
+-----------------------------------------------------------------------------------+
|                     SEGMENT REVENUE & RESULTS (Q1 FY27 - ₹ IN LAKHS)              |
+-------------------------+--------------------+-------------------+----------------+
| Segment                 | Segment Revenue    | Segment Result    | YoY Revenue    |
|                         | (Q1 FY27)          | (Pre-Tax Profit)  | Growth (%)     |
+-------------------------+--------------------+-------------------+----------------+
| Treasury Operations     | 2,67,986           | 1,06,556          | +16.92%        |
| Corporate/Wholesale     | 3,14,756           | 78,042            | +10.30%        |
| Retail Banking          | 4,98,731           | 78,989            | +38.44%        |
| - Digital Banking*      | 6                  | (8)               | N/A            |
| - Other Retail Banking  | 4,98,725           | 78,997            | +38.44%        |
| Other Banking Ops       | 12,288             | 5,911             | +3.97%         |
+-------------------------+--------------------+-------------------+----------------+
*Note: Digital Banking is reported as a sub-segment of Retail Banking per RBI guidelines (November 2025).
Segment Analytical Breakdown
Retail Banking Engine: Retail Banking continues to be the largest top-line contributor, generating ₹4,987.31 crore in segment revenue (+38.44% YoY) and a segment profit of ₹789.89 crore.
Treasury Performance: Treasury operations generated ₹2,679.86 crore in revenue (+16.92% YoY) and ₹1,065.56 crore in pre-tax segment profit, supported by investment yield management.
Wholesale & Corporate Lending: Wholesale banking revenue rose 10.30% YoY to ₹3,147.56 crore with segment profits of ₹780.42 crore, reflecting selective underwriting in large corporate lending.
7. Banking-Specific Analysis
       +------------------------------------------------------------------+
       |                 ASSET QUALITY TRENDS (Q1 FY25 - Q1 FY27)        |
       +------------------------------------------------------------------+
       | Gross NPA (%) :  1.97% (Q1 FY26)  --->  1.42% (Q4) ---> 1.33% (Q1) |
       | Net NPA (%)   :  0.32% (Q1 FY26)  --->  0.21% (Q4) ---> 0.18% (Q1) |
       | PCR (%)       :  97.67% (Current Provision Coverage Ratio)       |
       +------------------------------------------------------------------+
Asset Quality Metrics
Gross Non-Performing Assets (GNPA): Decreased to 1.33% (₹4,292.26 crore) as of June 30, 2026, down from 1.97% (₹5,178.46 crore) in Q1 FY26 and 1.42% (₹4,409.66 crore) in Q4 FY26.
Net Non-Performing Assets (NNPA): Reduced to 0.18% (₹588.42 crore), compared to 0.32% in Q1 FY26 and 0.21% in Q4 FY26.
Provision Coverage Ratio (PCR): Reached 97.67% as of June 30, 2026.
Balance Sheet & Credit Growth
Total Deposits: Stood at ₹3,76,192.75 crore as of June 30, 2026, compared to ₹3,30,792.16 crore in Q1 FY26 (+13.72% YoY).
Total Advances: Gross advances expanded to ₹3,18,401.21 crore versus ₹2,58,031.78 crore in Q1 FY26 (+23.40% YoY).
Capital Adequacy & Basel III Ratios
CRAR (Basel III): Stood at 19.36% as of June 30, 2026 (compared to 18.28% in Q1 FY26).
CET-1 Ratio: Strong at 16.88%, well above the regulatory threshold of 8.00% plus CCB.
+-----------------------------------------------------------------------------------+
|                        CAPITAL ADEQUACY VS REGULATORY MINIMUM                     |
+------------------------------------+--------------------+-------------------------+
| Capital Metric                     | IOB Level (Q1 FY27)| Regulatory Minimum      |
+------------------------------------+--------------------+-------------------------+
| Common Equity Tier 1 (CET-1)       | 16.88%             | 8.00%                   |
| Tier 1 Capital Ratio               | 16.88%             | 9.50%                   |
| Total Capital Ratio (CRAR)         | 19.36%             | 11.50%                  |
+------------------------------------+--------------------+-------------------------+
8. Management Disclosures & Structural Restructuring
Key Notes from Official Audit Filings
Share Premium Adjustment for Accumulated Losses:
In accordance with Clause 21 of the Nationalized Banks Scheme, 1970, and following approvals from the RBI (July 1, 2026) and shareholders at the AGM (July 7, 2026), IOB appropriated its entire accumulated loss balance of ₹8,733.34 crore as of March 31, 2026, by setting it off against its Share Premium account on July 10, 2026. This accounting adjustment clears accumulated losses from the balance sheet, restructuring reserves for future earnings distribution.
Investment Fluctuation Reserve (IFR) Reallocation:
Per RBI directions dated May 18, 2026, IOB discontinued maintaining a separate IFR. The existing ₹490.00 crore balance was transferred to Revenue Reserves during Q1 FY27.
IBC Provisions:
For accounts admitted under the Insolvency and Bankruptcy Code (IBC), IOB holds provisions totaling ₹10,713.05 crore (99.68% coverage) against total IBC exposure of ₹10,747.47 crore as of June 30, 2026.
Expected Credit Loss (ECL) Forward-Looking Provisions:
The bank carries a forward-looking provision of ₹2,150.00 crore under the Expected Credit Loss framework as of June 30, 2026.
9. Comparison with Peer PSU Banks
To place IOB’s performance in context, the following table compares key metrics against peer Public Sector Banks for Q1 FY27:
+-----------------------------------------------------------------------------------+
|                 PSU BANK PEER COMPARISON MATRIX (Q1 FY27 DATA)                    |
+---------------------+-------------------+------------------+----------+-----------+
| Metric              | Indian Overseas   | Bank of Maharashtra| UCO Bank | Central   |
|                     | Bank (IOB)        |                  |          | Bank      |
+---------------------+-------------------+------------------+----------+-----------+
| Standalone PAT (₹ Cr)| 1,659.24         | ~1,400 - 1,500   | ~600-700 | ~900-1,000|
| Total Income (₹ Cr) | 10,937.80         | ~7,000 - 7,500   | ~7,000   | ~9,500    |
| Gross NPA (%)       | 1.33%             | ~1.80% - 1.90%   | ~3.50%   | ~3.80%    |
| Net NPA (%)         | 0.18%             | ~0.20% - 0.25%   | ~0.80%   | ~0.70%    |
| PCR (%)             | 97.67%            | ~98.00%          | ~95.00%  | ~92.00%   |
| CRAR (%)            | 19.36%            | ~17.50%          | ~16.80%  | ~15.80%   |
| Govt Holding (%)    | 92.44%            | 86.46%           | 95.39%   | 93.08%    |
+---------------------+-------------------+------------------+----------+-----------+
(Peer data represents consensus market tracking and published exchange updates for Q1 FY27).
10. Valuation & Market Ratios
+-----------------------------------------------------------------------------------+
|                          VALUATION MULTIPLES & KEY RATIOS                         |
+------------------------------------+----------------------------------------------+
| Metric                             | Value / Ratio                                |
+------------------------------------+----------------------------------------------+
| Face Value per Share               | ₹10.00                                       |
| Basic EPS (Q1 FY27 - Not Ann.)     | ₹0.86 per share                              |
| Annualized EPS (Extrapolated)      | ~₹3.44 per share                             |
| Book Value per Share (Q1 FY27)     | ~₹15.19                                      |
| Net Worth (Q1 FY27)                | ₹29,255.75 Cr                                |
| Return on Assets (ROA)             | 1.41%                                        |
| Debt-Equity Ratio                  | 1.76                                         |
| Total Debts to Total Assets        | 0.88                                         |
| Operating Profit Margin (%)        | 24.62%                                       |
| Net Profit Margin (%)              | 15.17%                                       |
+------------------------------------+----------------------------------------------+
Analysis of Financial Restructuring Impact
Clearing ₹8,733.34 crore in accumulated losses using the Share Premium account improves IOB’s net balance sheet structure. By removing accumulated losses, future retained earnings can be allocated directly toward reserves and dividend payouts subject to regulatory approvals.
11. Risk Analysis
Key Risk Factors
High Government Ownership & OFS Supply: With the Government of India holding a 92.44% equity stake, IOB must lower non-promoter holding to comply with Minimum Public Shareholding (MPS) guidelines (25% public float). Potential Offer for Sale (OFS) issuances could create supply overheads in the secondary market.
Wage & Employee Benefit Liabilities: Employee expenses increased significantly in Q1 FY27 (₹2,104.45 crore vs ₹1,166.48 crore in Q1 FY26) due to actuarial updates for pension and retirement benefits.
Interest Rate Risk: Shifts in system interest rates could affect NIMs if deposit repricing outpaces yield expansion on advances.
Unhedged Foreign Currency & Contingent Legal Demands: The bank carries provisions of ₹22.84 crore for unhedged foreign currency exposures. Disputed income tax demands (₹4,631.56 crore) and GST demands (₹1,607.76 crore) remain under appeal.
12. Growth Opportunities
+-----------------------------------------------------------------------------------+
|                         STRATEGIC OPPORTUNITY VECTOR                              |
+-----------------------+-----------------------------------------------------------+
| Vector                | Expansion Initiative                                      |
+-----------------------+-----------------------------------------------------------+
| Co-Lending            | Active partnership in agricultural & MSME co-lending with |
|                       | initial disbursements of ₹42.63 Cr in Q1 FY27.            |
| Pool Buy-outs         | Strategic retail asset pool buy-outs (₹92.66 Cr acquired) |
|                       | to build yield-generating retail books.                   |
| Digital Expansion     | Digital sub-segment integration across mobile app and     |
|                       | internet banking platforms.                               |
| Priority Sector (PSLC)| Earned ₹862.55 Cr commission in Q1 FY27 by selling PSLCs.|
+-----------------------+-----------------------------------------------------------+
13. Investor Takeaways
For Long-Term Investors: The reduction in Gross NPA to 1.33% and a 19.36% CRAR demonstrate underlying operational strength. The offset of accumulated losses against share premium clears historical balance sheet drag.
For Short-Term & Swing Traders: Stock price performance may be influenced by systemic banking liquidity, PSU stock market sentiment, and expectations around MPS dilution timing.
For Value Investors: Higher ROA (1.41%) and lower credit costs highlight fundamental operational improvements.
14. Conclusion & What to Watch Next
Indian Overseas Bank’s Q1 FY27 results show strong core income growth, lower credit costs, and steady asset quality improvement. With standalone net profit growing 49.34% YoY to ₹1,659.24 crore, Gross NPA dropping to 1.33%, and a high PCR of 97.67%, the bank continues its operational turnaround.