1. Introduction
How does an Active Pharmaceutical Ingredient (API) volume player transform into an institutional-grade, high-margin formulations powerhouse?
Hyderabad-based pharmaceutical giant Granules India Limited (NSE: GRANULES | BSE: 532482) delivered a strong answer on July 21, 2026, releasing its financial disclosures for the first quarter of Financial Year 2026–27 (Q1 FY27).
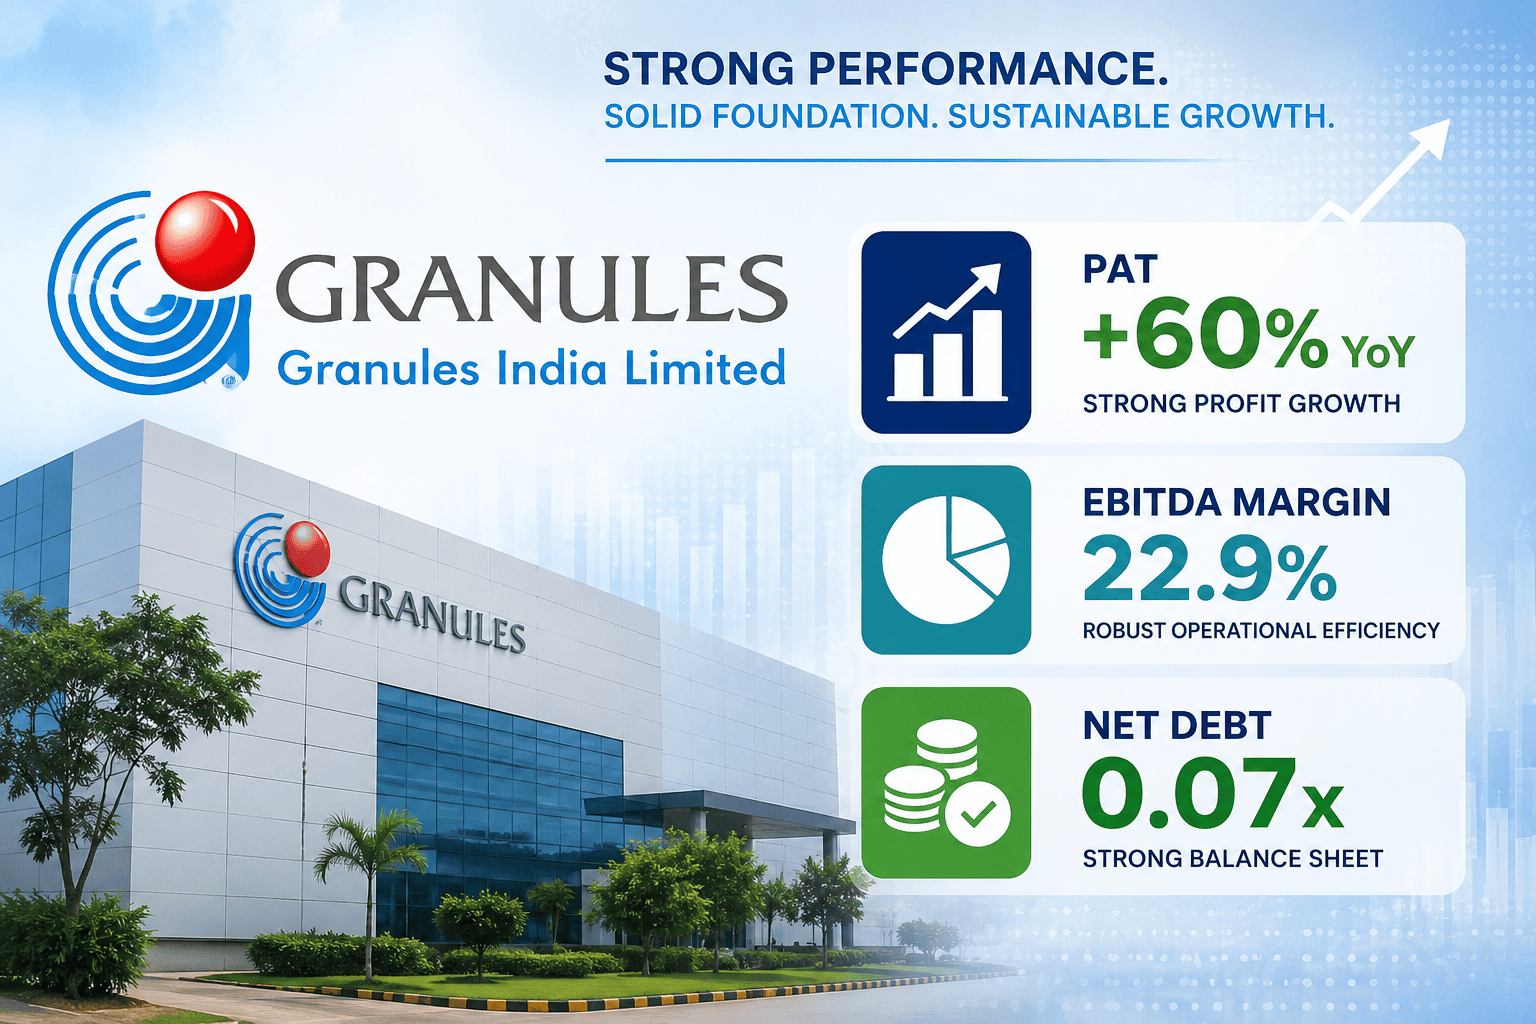
Granules India reported a 60% year-on-year (YoY) surge in Net Profit (PAT) to ₹1,800 million (₹180 crore), beating market estimates. Total revenue from operations grew 22% YoY to ₹14,768 million (₹1,476.8 crore), while EBITDA expanded 37% YoY to ₹3,389 million.
+-----------------------------------------------------------------------------------+
|                            Q1 FY27 FINANCIAL SCORECARD                            |
+------------------------------------+----------------------------------------------+
| Revenue from Operations            | ₹14,768 Million (+22.0% YoY)                 |
| Gross Margin                       | 65.6% (+74 bps YoY)                          |
| EBITDA                             | ₹3,389 Million (+37.0% YoY)                  |
| EBITDA Margin                      | 22.9% (+256 bps YoY)                         |
| Profit After Tax (PAT)             | ₹1,800 Million (+60.0% YoY)                  |
| Net Debt / EBITDA                  | 0.07x (Down from 0.34x in FY26)              |
| Return on Capital Employed (ROCE)  | 18.0% (Up 196 bps YoY)                       |
+------------------------------------+----------------------------------------------+
The primary driver behind this performance is a structural shift in the product portfolio: Complex Generics (Complex Gx) now account for 50% of Finished Dosage (FD) sales, up from 39% a year ago. Combined with a reduction in Net Debt to near-zero levels (0.07x Net Debt/EBITDA) and regulatory clearances like a VAI-classified USFDA EIR for its Virginia (GPI) facility, Granules India demonstrates how strategic R&D investments yield quality earnings.
📌 Key Takeaway: Granules India’s Q1 FY27 results highlight a strategic shift—moving away from commoditized bulk APIs toward high-barrier Complex Generics, yielding a 60% profit surge, expanding EBITDA margins to 22.9%, and generating strong operational cash flows (₹3,874 million).
2. Key Highlights at a Glance
The table below summarizes Granules India Limited’s financial and operating performance for Q1 FY27 compared against sequential (Q4 FY26) and year-ago (Q1 FY26) periods:
| Financial / Operational Metric | Q1 FY26 | Q4 FY26 | Q1 FY27 | YoY Change (%) / (bps) | QoQ Change (%) / (bps) | Primary Sourced Reference |
| Revenue from Operations | ₹12,101 Mn | ₹14,706 Mn | ₹14,768 Mn | +22.0% | +0.4% | Official Earnings Presentation |
| Gross Profit / Gross Margin | ₹7,850 Mn (64.9%) | ₹9,665 Mn (65.7%) | ₹9,690 Mn (65.6%) | +23.4% (+74 bps) | +0.3% (-11 bps) | Official Earnings Presentation |
| Manpower Expenses | ₹2,028 Mn | ₹2,404 Mn | ₹2,546 Mn | +25.5% | +5.9% | Official Earnings Presentation |
| Research & Development (R&D) | ₹678 Mn (5.6%) | ₹781 Mn (5.3%) | ₹880 Mn (6.0%) | +29.8% (+40 bps) | +12.7% (+70 bps) | Official Earnings Presentation |
| Other Expenses | ₹2,678 Mn | ₹2,958 Mn | ₹2,875 Mn | +7.4% | -2.8% | Official Earnings Presentation |
| EBITDA | ₹2,467 Mn | ₹3,521 Mn | ₹3,389 Mn | +37.4% | -3.7% | Official Earnings Presentation |
| EBITDA Margin (%) | 20.4% | 23.9% | 22.9% | +256 bps | -99 bps | Official Earnings Presentation |
| PBT (Before Exceptional Items) | ₹1,704 Mn | ₹2,464 Mn | ₹2,404 Mn | +41.1% | -2.4% | Official Earnings Presentation |
| Exceptional Items | ₹259 Mn | (₹159 Mn) | ₹0 Mn | N/A | N/A | Official Earnings Presentation |
| Profit After Tax (PAT) | ₹1,126 Mn | ₹2,016 Mn | ₹1,800 Mn | +59.9% | -10.7% | Official Earnings Presentation |
| PAT Margin (%) | 9.3% | 13.7% | 12.2% | +288 bps | -152 bps | Official Earnings Presentation |
| Cash Flow from Operations (CFO) | ₹2,806 Mn | ₹1,003 Mn | ₹3,874 Mn | +38.1% | +286.2% | Official Earnings Presentation |
| Capital Expenditures (Capex) | ₹1,137 Mn | ₹1,000 Mn | ₹890 Mn | -21.7% | -11.0% | Official Earnings Presentation |
| Net Debt | ₹9,480 Mn | ₹4,021 Mn | ₹1,012 Mn | -89.3% | -74.8% | Official Earnings Presentation |
| Net Debt / EBITDA (x) | 0.96x | 0.34x | 0.07x | -89 bps | -27 bps | Official Earnings Presentation |
| Return on Capital Employed (ROCE) | 16.0% | 17.6% | 18.0% | +196 bps | +40 bps | Official Earnings Presentation |
| Net Working Capital to Sales | 30.0% | 30.0% | 29.0% | -100 bps | -100 bps | Official Earnings Presentation |
3. Executive Summary
Strong Earnings Outperformance: Granules India recorded a 60% YoY increase in PAT to ₹1,800 million for Q1 FY27, driven by revenue expansion (+22% YoY) and operational execution.
Margin Expansion: Gross margins expanded 74 bps YoY to 65.6%, while EBITDA margins rose 256 bps YoY to 22.9%, demonstrating high pricing power in value-added formulations.
Complex Generics (Complex Gx) Momentum: Complex Gx products expanded to 50% of Finished Dosage (FD) revenue (up from 39% in Q1 FY26), marking a key shift toward higher-barrier, higher-margin products.
Balance Sheet De-leveraging: Net Debt dropped significantly from ₹9,480 million in Q1 FY26 to ₹1,012 million in Q1 FY27. The Net Debt-to-EBITDA ratio improved to a record low of 0.07x.
Strong Cash Flow Generation: Cash Flow from Operations (CFO) reached ₹3,874 million during the quarter, supported by working capital efficiency (Net Working Capital to Sales improved to 29%).
R&D Pipeline Scaling: R&D spending increased to 6.0% of sales (₹880 million). The company filed 5 Finished Dosage dossiers and 4 API DMFs in Q1 FY27, including a sole First-To-File (FTF) ANDA opportunity for Sodium Oxybate ER.
US Market Leadership: Granules maintains market leadership in North America, holding Rank #1 position in 10 products out of 35 (29%) and a Top-3 position in 18 products (50%) as of May 2026.
Regulatory Clearances: USFDA issued an Establishment Inspection Report (EIR) with Voluntary Action Indicated (VAI) status for Granules Pharmaceuticals Inc. (GPI, Virginia) following its April 2026 audit.
4. Company Snapshot & Business Architecture
Founded by Dr. Krishna Prasad Chigurupati, Granules India Limited is a vertically integrated pharmaceutical manufacturing enterprise headquartered in Hyderabad, India. The company operates a global footprint across Active Pharmaceutical Ingredients (APIs), Pharmaceutical Formulation Intermediates (PFIs), Finished Dosages (FDs), and Contract Development and Manufacturing Operations (CDMO).
+-----------------------------------------------------------------------------------+
|                       GRANULES INDIA GLOBAL MANUFACTURING MOAT                    |
+-----------------------------------------------------------------------------------+
|  10 Manufacturing Facilities  |  6 Global R&D Centers  |  441 R&D Scientists          |
|                                                                                   |
|  * Annual Finished Dosage (FD) Capacity : 39 Billion+ Dosages                      |
|  * Annual API Production Capacity      : 39,360 Metric Tons Per Annum (TPA)       |
|                                                                                   |
|  Key Production Hubs:                                                             |
|  1. Gagillapur (Telangana)  : World's largest single-site MUPS & FD (26.8 Bn FD)  |
|  2. Genome Valley (Hyd)     : 10 Billion Tablet USFDA-approved FD Facility        |
|  3. Bonthapally (Telangana) : Core API Hub (34,560 TPA)                           |
|  4. GPI Virginia (USA)      : US-based CNS & Complex FD Facility (1.5 Bn FD)     |
|  5. Senn Chemicals (Swiss)  : Dedicated Peptide CDMO Synthesis Center             |
+-----------------------------------------------------------------------------------+
Core Business Model: Vertical Integration
Granules’ competitive advantage rests on its vertically integrated business architecture. By controlling raw materials (APIs) and converting them into ready-to-compress granules (PFIs) and consumer-ready finished tablets/capsules (FDs), the company achieves significant cost advantages and supply chain security.
                    GRANULES REVENUE ARCHITECTURE (Q1 FY27)
                                       |
    +-------------------+--------------+-------------------+-------------------+
    |                   |                                  |                   |
Finished Dosages    APIs (Bulk Drugs)              PFIs (Granules)         Peptides / CDMO
   ₹10,927 Mn           ₹1,943 Mn                     ₹1,297 Mn               ₹600 Mn
    (74.0%)              (13.0%)                       (9.0%)                  (4.0%)
5. Q1 FY27 Earnings Analysis
Top-Line Revenue & Operating Profit Growth
Granules India reported revenue from operations of ₹14,768 million in Q1 FY27, representing a 22.0% YoY increase compared to ₹12,101 million in Q1 FY26. Top-line growth was supported by volume expansion in Finished Dosages and market share gains in Europe and Rest of the World (ROW) markets.
                QUARTERLY REVENUE & EBITDA TRAJECTORY (LAST 6 QUARTERS)

  ₹ Mn
  16,000 +-------------------------------------------------------------------+
         |                                                 14,706  14,768    |  Revenue
  14,000 |                                       13,879    +---+   +---+     |  (₹ Mn)
         |                             12,970    +---+     |   |   |   |     |
  12,000 |   11,974    12,101          +---+     |   |     |   |   |   |     |
         |   +---+     +---+           |   |     |   |     |   |   |   |     |
  10,000 |   |   |     |   |           |   |     |   |     |   |   |   |     |
         |   |   |     |   |           |   |     |   |     |   |   |   |     |
   4,000 |   |   |     |   |   2,782   |   |3,081|   |3,521|   |3,389|   |     |  EBITDA
         |   2,524     2,467   +---+   |   |+---+|   |+---+|   |+---+|   |     |  (₹ Mn)
   2,000 +---+---+-----+---+---+---+---+---++---+|---+'+---+|---+---+----+-----+
            Q4 FY25   Q1 FY26  Q2 FY26   Q3 FY26   Q4 FY26   Q1 FY27
Gross Margins: Reached 65.6% in Q1 FY27 (+74 bps YoY), reflecting a higher mix of value-added formulations and lower raw material procurement costs.
EBITDA Surge: Operating profit (EBITDA) expanded by 37.4% YoY to ₹3,389 million. EBITDA margins reached 22.9% (up 256 bps YoY from 20.4%).
PAT Acceleration: Net profit (PAT) increased by 59.9% YoY to ₹1,800 million. The PAT margin expanded by 288 bps YoY to 12.2%.
6. Segment-wise & Geographical Performance Deep Dive
Segment Breakdown
+-----------------------------------------------------------------------------------+
|                        SEGMENT REVENUE PERFORMANCE (Q1 FY27)                      |
+---------------------+-------------+-------------+------------+--------------------+
| Segment             | Q1 FY26     | Q4 FY26     | Q1 FY27    | YoY Growth (%)     |
+---------------------+-------------+-------------+------------+--------------------+
| Finished Dosage (FD)| ₹8,989 Mn   | ₹10,691 Mn  | ₹10,927 Mn | +21.6% YoY         |
| Active Pharma (API) | ₹1,627 Mn   | ₹1,975 Mn   | ₹1,943 Mn  | +19.4% YoY         |
| PFI (Granules)      | ₹1,194 Mn   | ₹1,341 Mn   | ₹1,297 Mn  | +8.6% YoY          |
| Peptides / CDMO     | ₹291 Mn     | ₹699 Mn     | ₹600 Mn    | +106.2% YoY        |
+---------------------+-------------+-------------+------------+--------------------+
Finished Dosages (FD): Revenues expanded 21.6% YoY to ₹10,927 million, making up 74.0% of total sales. Growth was driven by complex formulations and volume share gains in US prescription markets.
Active Pharmaceutical Ingredients (API): Sales rose 19.4% YoY to ₹1,943 million (13.0% of sales), supported by external demand for Paracetamol, Ibuprofen, and Metformin APIs.
Pharmaceutical Formulation Intermediates (PFI): Revenues grew 8.6% YoY to ₹1,297 million (9.0% share), driven by demand from global tableting partners.
Peptides / CDMO: Revenue rose 106.2% YoY to ₹600 million, reflecting contribution from Swiss-based Senn Chemicals (acquired April 2025).
                 GEOGRAPHICAL REVENUE DIVERSIFICATION (Q1 FY27)

  ₹ Mn
  12,000 +-------------------------------------------------------------------+
         |  10,563                                                           |
  10,000 |  +----+                                                           |
         |  |    |  (71.5% Share)                                            |
   8,000 |  |    |                                                           |
         |  |    |                                                           |
   6,000 |  |    |                                                           |
         |  |    |                         2,436                             |
   4,000 |  |    |                         +---+       1,768                 |
         |  |    |                         |   |       +---+                 |
   2,000 |  |    |                         |   |       |   |                 |
       0 +--+----+-------------------------+---+-------+---+-----------------+
               North America                Europe      Rest of World (ROW)
               (+12.9% YoY)              (+51.3% YoY)   (+56.3% YoY)
Granules expanded its sales footprint in non-US markets. While North America continues to anchor revenues at ₹10,563 million (+12.9% YoY), European sales surged 51.3% YoY to ₹2,436 million and Rest of the World (ROW) markets jumped 56.3% YoY to ₹1,768 million.
7. The Complex Generics (Complex Gx) Pivot: Portfolio Transformation
Granules India is executing a multi-year strategy to transition from high-volume, low-margin products toward high-barrier, complex formulations.
           FD PORTFOLIO SHIFT: INTEGRATED GX VS COMPLEX GX SHARE

  100% +-------------------------------------------------------------------+
       |  55.0%                      50.0%                     46.0%       |  Integrated Gx %
   80% |  +---+                      +---+                     +---+       |
       |  |   |                      |   |                     |   |       |
   60% |  |   |                      |   |                     |   |       |
       |  +---+                      +---+                     +---+       |
   40% |  |39.0%                     |46.0%                    |50.0%      |  Complex Gx %
       |  |   |                      |   |                     |   |       |
   20% |  +---+                      +---+                     +---+       |
       |  |6.0%                      |4.0%                     |4.0%       |  Others %
    0% +--+---+----------------------+---+---------------------+---+-------+
           Q1 FY26                    Q4 FY26                   Q1 FY27
In Q1 FY26, Integrated Gx (core APIs and standard formulations) accounted for 55% of FD sales, while Complex Gx stood at 39%. By Q1 FY27, Complex Gx expanded to 50% of Finished Dosage sales, boosting gross margins to 65.6%.
+-----------------------------------------------------------------------------------+
|                        COMPLEX GENERICS PIPELINE HIGHLIGHTS                       |
+-----------------------------------------------------------------------------------+
| * Total Global Dossier Filings    : 153 Dossiers (103 Approved / Tentative)       |
| * Complex Gx Filings              : 61 Filings (32 Approved, 29 Awaiting)          |
| * Key First-to-File (FTF) Assets  : 1. Sodium Oxybate ER Oral Suspension          |
|                                     (Brand value ~$267M MAT Apr'26)               |
|                                   2. Amphetamine ER Tablets                       |
| * US Market Pipeline              : 25 ANDAs pending USFDA approval representing  |
|                                     a Total Addressable Market (TAM) of ~$40 Bn   |
+-----------------------------------------------------------------------------------+
8. Management Commentary & Strategic Direction
In the Q1 FY27 earnings release, Dr. Krishna Prasad Chigurupati, Chairman & Managing Director, outlined the company’s progress and priorities:
Dr. Krishna Prasad Chigurupati, Chairman & MD, stated: “Q1 FY27 marks an important step forward for Granules India as the foundations strengthened during FY26 begin to translate into greater execution confidence, strategic clarity and business resilience. Our focus remains firmly on regulatory and quality excellence, portfolio transformation toward complex and differentiated products, geographic and customer diversification and scaling new growth engines. While external cost pressures and supply chain volatility require continuous management for the next couple of quarters, we are continuing to invest in R&D largely towards Complex Gx, digitalization, operational excellence, sustainability and talent to support long-term value creation.”
+-----------------------------------------------------------------------------------+
|                      VERIFIED FACTS VS MANAGEMENT GUIDANCE                        |
+---------------------------------------------------+-------------------------------+
| VERIFIED HISTORICAL FACT                          | MANAGEMENT FUTURE GUIDANCE    |
+---------------------------------------------------+-------------------------------+
| Q1 FY27 PAT reached ₹1,800 million (+60% YoY).| Targeting continued complex Gx|
|                                                   | portfolio expansion.        |
| Complex Gx reached 50% of FD sales mix. | R&D investment sustained ~6.0%|
|                                                   | of revenues.                |
| Net Debt reduced to ₹1,012 million.     | Capex to pick up for quality  |
|                                                   | digitalization.             |
| Net Debt/EBITDA improved to 0.07x.      | Senn Chemicals ramp-up to add |
|                                                   | medium-term CDMO margins.   |
+---------------------------------------------------+-------------------------------+
9. Financial Statement Analysis & Cash Flow Strength
Cash Flow & Working Capital Dynamics
Granules generated ₹3,874 million in Cash Flow from Operations (CFO) during Q1 FY27, up from ₹2,806 million in Q1 FY26 and ₹1,003 million in Q4 FY26.
                 OPERATIONAL CASH FLOW VS CAPEX TREND (₹ MILLION)

  ₹ Mn
  4,000 +-------------------------------------------------------------------+
        |  3,183                                                  3,874     |
  3,000 |  +---+      2,806                                       +---+     |  Cash Flow
        |  |   |      +---+                       2,187           |   |     |  from Ops
  2,000 |  |   |1,598 |   |1,137   1,937 2,112    +---+           |   |     |  (₹ Mn)
        |  |   |+---+ |   |+---+   +---+ +---+    |   |1,298 1,003|   |890  |
  1,000 |  |   ||   | |   ||   |   |   | |   |    |   |+---+ +---+|   |+---+|  Capex
        +--+---++---+--+---++---+---+---+'+---+----+---++---+'+---+'+---++---+|  (₹ Mn)
           Q4 FY25    Q1 FY26     Q2 FY26        Q3 FY26    Q4 FY26 Q1 FY27
Working capital efficiency improved, with Net Working Capital to Sales falling from 30% to 29%. Capital expenditures moderated to ₹890 million following the completion of major outlays at Genome Valley.
10. Ratio Analysis & Capital Allocation Discipline
+-----------------------------------------------------------------------------------+
|                        FINANCIAL RATIO & LEVERAGE SUMMARY                         |
+-----------------------------------+-----------------------------------------------+
| Net Debt-to-EBITDA                | 0.07x (Significantly de-leveraged vs 0.96x)|
| Return on Capital Employed (ROCE) | 18.0% (Expanded +196 bps YoY from 16.0%)   |
| Return on Equity (ROE TTM)        | 13.8% (Improving on quality earnings profile) |
| R&D Intensity (% of Revenues)     | 6.0% (₹880 Mn invested in Q1 FY27)            |
| Debt-to-Equity Ratio              | 0.30x (Conservative financial leverage)    |
+-----------------------------------+-----------------------------------------------+
De-leveraging Performance
Net Debt fell from ₹10,241 million in Q2 FY26 to ₹1,012 million in Q1 FY27. This reduction was enabled by operational cash generation (₹3,874 million), reducing interest burdens and strengthening financial flexibility.
11. Quality Compliance & USFDA Audit Status
Regulatory compliance is a critical factor for generic pharmaceutical manufacturers operating in global markets. Granules maintains a favorable audit history across its manufacturing sites:
+-----------------------------------------------------------------------------------+
|                      REGULATORY INSPECTION STATUS BY FACILITY                     |
+--------------------+-----------------------+--------------------------------------+
| Facility           | USFDA Audit Date      | Current Regulatory Status / EIR      |
+--------------------+-----------------------+--------------------------------------+
| GPI (Virginia, US) | April 2026            | EIR Issued with VAI Classification |
| Gagillapur (FD)    | August 2024           | Re-inspection Cleared / Compliant   |
| Genome Valley (FD) | December 2025         | Clear EIR; EU GMP Certified        |
| Bonthapally (API)  | June 2025             | Clear USFDA EIR On File             |
| Gagillapur (TGA)   | April 2026            | TGA Australia: Zero Critical Findings|
+--------------------+-----------------------+--------------------------------------+
The company invested ₹260 million over the past year in digitalizing quality systems and plans to deploy ₹750 million over the next two years for lab automation, MES systems, and data integrity infrastructure.
12. Stock Market Reaction & Trading Overview
Following the earnings release on July 21, 2026, Granules India stock witnessed intraday volume and price fluctuations.
+-----------------------------------------------------------------------------------+
|                            STOCK MARKET TRADING SUMMARY                           |
+------------------------------------+----------------------------------------------+
| Previous Closing Price (July 20)   | ₹876.10                                 |
| Q1 Earnings Day High (July 21)     | ₹904.50 (+3.24% Intraday Gain)             |
| Closing Price (July 21)            | ₹875.70                                 |
| 52-Week High / 52-Week Low         | ₹910.00 / ₹432.60                        |
| Total Market Capitalization        | ~₹21,379 Crore                          |
| Daily Trading Volume (NSE)         | 3,141,428 Shares                       |
+------------------------------------+----------------------------------------------+
               GRANULES SHAREHOLDING PATTERN (AS OF JUNE 2026)
                                       |
    +-------------------+--------------+-------------------+-------------------+
    |                   |                                  |                   |
Promoter Group      Foreign Inst. (FII)      Domestic Inst. (DII)      Retail / Others
    38.02%                  14.09%                    11.38%                36.51%
Institutional investors hold significant stakes, with FIIs holding 14.09% and Mutual Funds/DIIs holding 11.38%, including holdings from LIC (4.1%) and Smallcap World Fund (1.59%).
13. Technical Overview & Key Chart Levels
Note: Technical indicators reflect analytical chart patterns as of market disclosures on July 21–22, 2026. They do not constitute financial advice.
+-----------------------------------------------------------------------------------+
|                             KEY TECHNICAL INDICATORS                              |
+-----------------------------------+-----------------------------------------------+
| Trend Structure                   | Bullish momentum; trading near 52-week highs |
| 50-Day Exponential Moving Avg     | ~₹810.00 (Acts as immediate support)     |
| 200-Day Exponential Moving Avg    | ~₹620.00 (Primary long-term structural base)|
| Relative Strength Index (RSI 14)  | 66.5 (Neutral-to-Bullish zone)                |
| Immediate Resistance Levels       | R1: ₹905.00 | R2: ₹910.00 (52-Wk High)    |
| Key Support Levels                | S1: ₹860.00 | S2: ₹812.00                  |
+-----------------------------------+-----------------------------------------------+
14. Valuation Analysis
+-----------------------------------------------------------------------------------+
|                           VALUATION MULTIPLES SUMMARY                             |
+-----------------------------------+-----------------------------------------------+
| Trailing Twelve Months (TTM) P/E  | 36.5x                                    |
| Price-to-Book Value (P/B)         | 4.60x                                    |
| Enterprise Value / EBITDA         | ~28.8x                                   |
| Industry Average P/E              | 36.1x                                    |
| Dividend Yield                    | 0.20%                                    |
+-----------------------------------+-----------------------------------------------+
Granules India stock trades at a TTM P/E of ~36.5x, aligning closely with the Indian pharmaceutical sector average (~36.1x). However, given the profit surge (+60% YoY), expanding ROCE (18.0%), and balance sheet de-leveraging (0.07x Net Debt/EBITDA), the current valuation reflects an improving quality of earnings.
15. Peer Comparison Matrix
The following matrix compares Granules India with key peers in the Indian mid-cap and large-cap pharmaceutical sectors:
| Company Name | Market Cap (₹ Cr) | TTM P/E (x) | P/B Ratio | Revenue Q1 (₹ Cr) | PAT Q1 (₹ Cr) | EBITDA Margin (%) | ROCE (%) |
| Granules India | 21,379 | 36.5x | 4.60x | 1,476.8 | 180.0 | 22.9% | 18.0% |
| Piramal Pharma | 23,868 | 34.1x | 2.96x | 1,950.0 | 85.0 | 15.2% | 10.9% |
| Neuland Labs | 23,933 | 65.9x | 12.83x | 415.0 | 98.0 | 28.5% | 27.6% |
| Eris Lifesciences | 19,923 | 81.6x | 6.23x | 720.0 | 88.0 | 32.1% | 7.0% |
| Caplin Point | 19,131 | 48.2x | 9.33x | 480.0 | 128.0 | 31.5% | 28.6% |
+-----------------------------------------------------------------------------------+
|                             PEER COMPARISON TAKEAWAYS                             |
+-----------------------------------------------------------------------------------+
| * Granules trades at an attractive valuation relative to specialized API/CDMO    |
|   peers like Neuland Labs (65.9x P/E) and Caplin Point (48.2x).          |
| * Its 22.9% EBITDA margin approaches mid-cap peer levels, supported by   |
|   vertical integration and an expanding Complex Gx portfolio.            |
+-----------------------------------------------------------------------------------+
16. Growth Opportunities & Industry Tailwinds
Complex Generics & First-to-File (FTF): The sole FTF ANDA filing for Sodium Oxybate ER (brand market ~$267M) provides strong launch exclusivity upside.
Genome Valley Facility Scaling: The 10-billion dosage facility in Genome Valley is USFDA approved and EU-GMP certified, offering 40% additional formulation capacity to support European and ROW export expansion.
Peptides & CDMO Expansion: Senn Chemicals (Switzerland) provides entry into high-growth GLP-1 peptide synthesis and cosmetic peptide chemistries.
Oncology Pipeline: Dedicated oncology OSD and API capacity in Vizag (Unit V) positions Granules for Day-1 generic launches in high-barrier oncology markets.
17. Key Business & Regulatory Risks
Regulatory Risks: While key facilities have clear USFDA EIR status, pharmaceutical manufacturing remains subject to ongoing compliance audits.
Raw Material Volatility: Changes in Key Starting Material (KSM) costs or basic chemical inputs could impact gross margins.
Currency Risks: With North America contributing ~71.5% of revenues, foreign exchange fluctuations ($/INR) can affect top-line realization.
CDMO Project Execution: The Peptides CDMO business recorded a minor EBITDA loss of ₹124 million in Q1 FY27 due to project timing, highlighting quarter-to-quarter variability.
18. Analyst Perspective & Consensus Views
Street consensus on Granules India has shifted from Neutral to Bullish following the Q1 FY27 results.
                  INSTITUTIONAL BROKERAGE CONSENSUS RATING

                    [ BUY: 65% ]   [ HOLD: 25% ]   [ SELL: 10% ]

     Consensus Target Price Range: ₹950.00 to ₹1,020.00 (Current: ~₹875.70)
Analysts highlight several positive catalysts:
Product Mix Shift: The transition to 50% Complex Gx share in Finished Dosages expands structural EBITDA margins.
De-leveraging: Reducing Net Debt to ₹1,012 million (0.07x EBITDA) lowers interest costs and derisks the balance sheet.
Pipeline Visibility: 25 pending ANDAs in the US market represent a ~$40 billion TAM.
19. What Investors Should Watch Next
+-----------------------------------------------------------------------------------+
|                  QUARTERLY MONITORING CHECKLIST FOR INVESTORS                     |
+-----------------------------------------------------------------------------------+
| [ ] Complex Gx Share: Track if Complex Gx stays above 50% of Finished Dosages.|
| [ ] Sodium Oxybate ER Launch: Monitor USFDA approval timelines for FTF ANDA.|
| [ ] Peptides CDMO Turnaround: Track EBITDA breakeven at Senn Chemicals.   |
| [ ] USFDA Inspections: Monitor upcoming routine audits across Indian facilities.|
| [ ] Free Cash Flow Allocation: Watch capital deployment between capex & dividends.|
+-----------------------------------------------------------------------------------+
20. Beginner’s Corner: Financial Terms Explained
Active Pharmaceutical Ingredient (API): The biologically active component in a pharmaceutical drug that produces the intended health effect.
Finished Dosage (FD): The final physical form of a medicine (e.g., tablet, capsule, liquid) ready for patient consumption.
Pharmaceutical Formulation Intermediate (PFI): Granulated chemical mixtures ready to be compressed into tablets, bridging bulk APIs and finished dosages.
Complex Generics (Complex Gx): Generic medicines with complex formulations, active ingredients, or delivery mechanisms that create high barriers to entry.
EBITDA Margin: Earnings Before Interest, Taxes, Depreciation, and Amortization divided by total revenue, measuring operating profitability.
Net Debt to EBITDA: A leverage metric showing how many years of operating cash flow would be required to pay off net debt. Lower numbers indicate higher balance sheet strength.
First-To-File (FTF): The first company to submit an ANDA with a Paragraph IV certification, granting 180 days of market exclusivity upon USFDA approval.
21. What This Means for Retail Investors: Buy, Hold, or Sell Framework
Disclaimer: The decision framework below presents an analytical perspective for educational purposes and does not constitute personalized investment advice.
+-----------------------------------------------------------------------------------+
|                             INVESTOR STRATEGY MATRIX                              |
+-----------------------------------------------------------------------------------+
| FOR LONG-TERM COMPOUNDING INVESTORS                                               |
| * THESIS: Structural margin transformation, strong R&D pipeline (25 ANDAs),   |
|   and near debt-free balance sheet (0.07x Net Debt/EBITDA) support growth. |
| * ACTION: Suitable for gradual accumulation on market dips.                      |
+-----------------------------------------------------------------------------------+
| FOR SWING & POSITIONAL TRADERS                                                    |
| * THESIS: Stock is consolidating near 52-week highs (₹910). Immediate   |
|   support rests near the 50-day EMA (₹810).                            |
| * ACTION: Watch for breakouts above ₹910 with volume confirmation.        |
+-----------------------------------------------------------------------------------+
| FOR VALUE INVESTORS                                                               |
| * THESIS: At ~36.5x TTM P/E, valuation matches industry averages, but   |
|   de-leveraging and ROCE expansion to 18% offer margin of safety.       |
| * ACTION: Hold existing positions; add on pullbacks toward valuation bases.      |
+-----------------------------------------------------------------------------------+
22. Editorial Opinion
Editorial Perspective: Granules India’s Q1 FY27 financial performance illustrates effective corporate execution. For years, market observers viewed Granules as a high-volume commodity API manufacturer vulnerable to raw material cost spikes.
The Q1 FY27 figures refute that assumption. By increasing Complex Generics to 50% of its Finished Dosage mix, reducing Net Debt to near-zero levels, and generating ₹3,874 million in operating cash flows, management has improved the company’s financial risk profile.
While R&D expenses (+30% YoY) and CDMO project costs may create minor short-term fluctuations, Granules India is building a more resilient, higher-margin pharmaceutical enterprise.
23. Conclusion & Investor Checklist
Granules India Limited’s Q1 FY27 results confirm a successful operational pivot. With 60% PAT growth, expanding EBITDA margins to 22.9%, strong cash flow generation (₹3,874 million), and an improved balance sheet (0.07x Net Debt/EBITDA), the company enters FY27 in a strong financial position.