1. Introduction
Eternal Ltd. (formerly Zomato Ltd.) published its financial results for the first quarter of FY27 (ending June 30, 2026). The hyperlocal commerce giant demonstrated significant operational scaling across its core verticals—Food Delivery (Zomato), Quick Commerce (Blinkit), B2B Supplies (Hyperpure), and Going-Out (District).
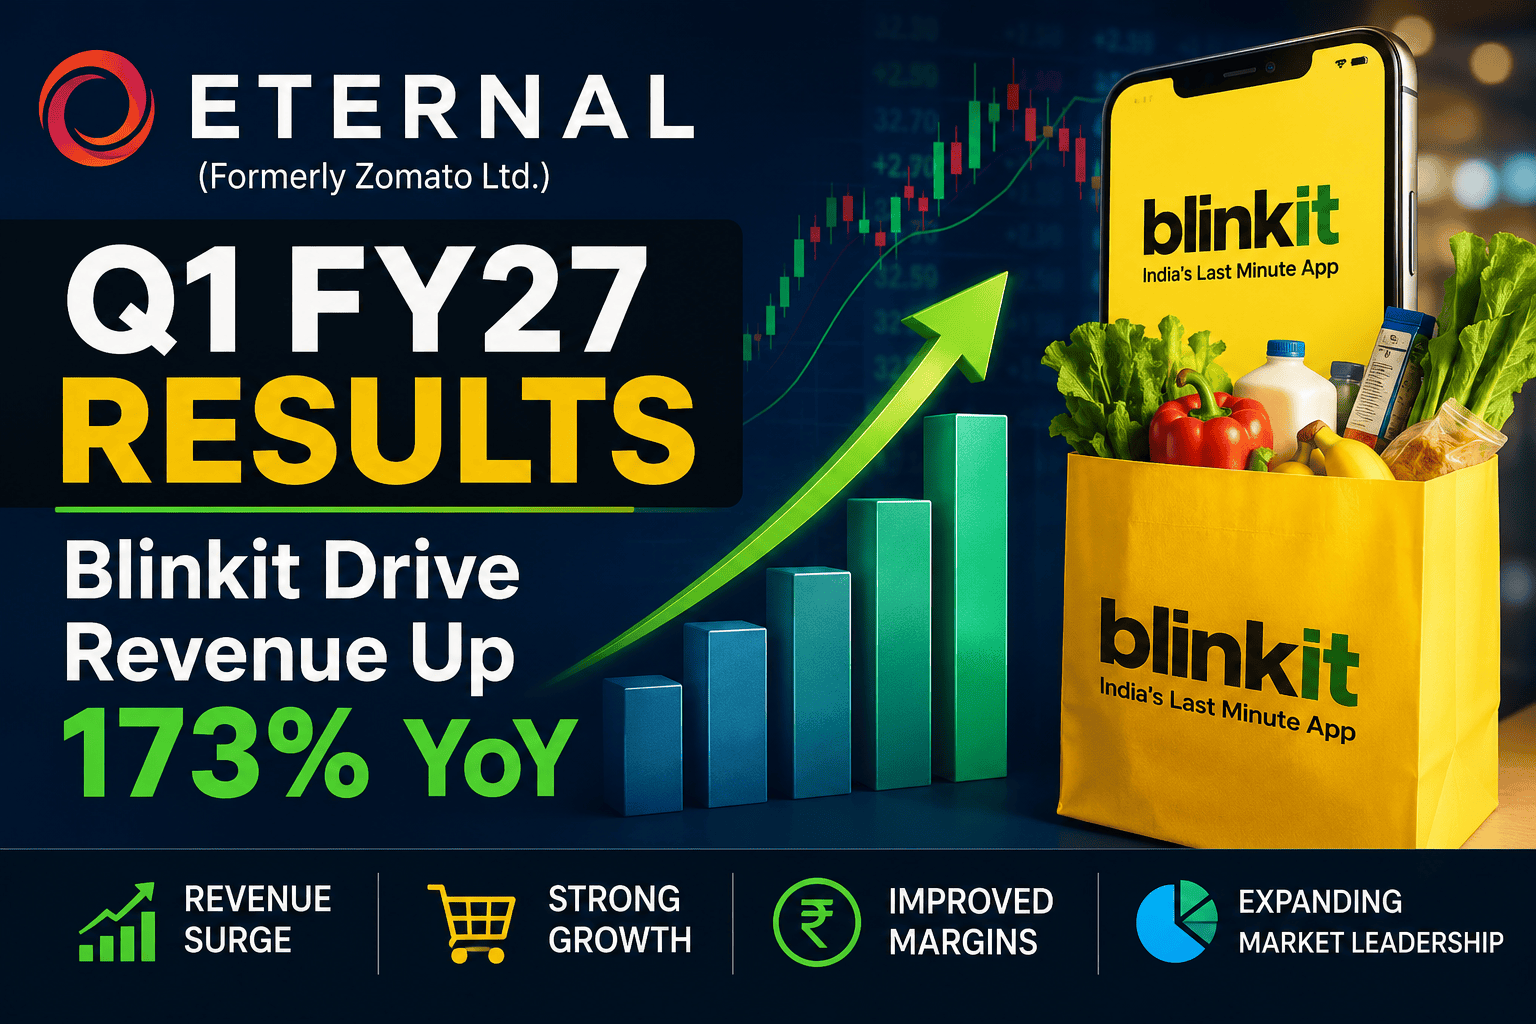
The company reported a 173% Year-on-Year (YoY) surge in Consolidated Adjusted Revenue to ₹20,648 crore. On a Like-for-Like (LFL) basis, Adjusted Revenue expanded by 66% YoY, clarifying the structural shift in Blinkit’s business model from a pure marketplace platform to an inventory ownership (1P) operation.
┌────────────────────────────────────────────────────────────────────────┐
│                   ETERNAL LTD. Q1 FY27 HIGHLIGHTS                      │
├──────────────────────────┬──────────────────────────┬──────────────────┤
│ B2C Net Order Value      │ Consolidated Adj Revenue │ Adj EBITDA       │
│ ₹31,120 Cr (+54% YoY)    │ ₹20,648 Cr (+173% YoY)   │ ₹555 Cr (+223%YoY)│
└──────────────────────────┴──────────────────────────┴──────────────────┘
The underlying momentum in consumer demand across urban India remains strong. Consolidated B2C Net Order Value (NOV) reached ₹31,120 crore, marking a 54% YoY expansion. Consolidated Adjusted EBITDA grew 223% YoY to ₹555 crore, proving that rapid market penetration in quick commerce can coexist with rising operational profitability.
Real-World Impact Example: Consider a consumer in Tier-1 metropolitan cities like Bengaluru or Delhi NCR. Three years ago, they used Zomato once or twice a week strictly for weekend dinner deliveries. Today, that same consumer uses Zomato for weekday meals, Blinkit twice daily for groceries, electronics, and home essentials, Hyperpure through local dining spots, and District to book weekend movie tickets or live events. Eternal has successfully scaled from a food delivery service into an integrated lifestyle utility platform.
2. Executive Summary
B2C Net Order Value (NOV): Stood at ₹31,120 crore in Q1 FY27, up 54.2% YoY from ₹20,183 crore in Q1 FY26.
Consolidated Revenue from Operations: Reported at ₹20,211 crore per Ind AS, compared to ₹7,167 crore in Q1 FY26.
Consolidated Adjusted Revenue: Reached ₹20,648 crore, up 173.0% YoY (66% YoY on an LFL basis).
Consolidated Adjusted EBITDA: Reached ₹555 crore, up 222.7% YoY from ₹172 crore in Q1 FY26.
Net Profit After Tax (PAT): Reported at ₹92 crore, impacted by a tax provision of ₹180 crore as carried-forward business losses in the standalone parent entity near full utilization.
Food Delivery (Zomato): NOV reached ₹10,769 crore (+20.1% YoY). Adjusted EBITDA margin expanded to 5.6% of NOV (generating ₹606 crore in EBITDA).
Quick Commerce (Blinkit): NOV jumped 86.2% YoY to ₹17,132 crore. Store count expanded by 200 net new additions to reach 2,443 stores. Adjusted EBITDA turned positive at ₹102 crore (0.6% of NOV).
Going-Out (District): NOV accelerated by 59.8% YoY to ₹3,218 crore. Adjusted EBITDA loss stood at -₹65 crore (-2.0% of NOV).
B2B Supplies (Hyperpure): Revenue grew 27% YoY (LFL) to ₹1,034 crore with positive Adjusted EBITDA of ₹6 crore.
Balance Sheet & Cash: Closing cash balance increased by ₹316 crore QoQ to ₹18,288 crore.
3. Company Snapshot & Business Architecture
Eternal Ltd. operates as an umbrella entity housing five distinct business segments designed to capture consumption growth across India:
| Segment | Brand / Platform | Core Business Model | Primary Revenue Sources |
| Food Delivery | Zomato | Marketplace hyperlocal delivery platform connecting users, restaurants, and delivery partners. | Restaurant commissions, customer platform fees, ad placement fees, delivery charges. |
| Quick Commerce | Blinkit | High-density dark store infrastructure offering under-15-minute deliveries. | Direct sales of goods (1P model), marketplace seller commissions, warehousing fees, digital ads. |
| Going-Out | District | Multi-use case ticketing, dining out, and experiential booking platform. | Ticketing commissions, convenience fees, merchant subscriptions (Gold), live event management. |
| B2B Supplies | Hyperpure | Farm-to-fork and wholesale supply chain network for HoReCa (Hotels, Restaurants, Caterers). | Direct institutional sale of high-quality kitchen ingredients and consumables. |
| Others / R&D | Bistro, Nugget, Greening India | Incubators for high-volume kitchen automation (Bistro) and corporate/AI tooling (Nugget). | Product sales, SaaS tools, experimental platform service charges. |
4. Q1 FY27 Results at a Glance
Consolidated Financial Summary (Ind AS & Non-GAAP)
| Metric (in ₹ Crore unless stated) | Q1 FY27 | Q4 FY26 | Q1 FY26 | QoQ Change (%) | YoY Change (%) |
| B2C Net Order Value (NOV) | 31,120 | 26,880 | 20,183 | +15.8% | +54.2% |
| Revenue from Operations | 20,211 | 17,292 | 7,167 | +16.9% | +182.0% |
| Adjusted Revenue | 20,648 | 17,680 | 7,563 | +16.8% | +173.0% |
| Like-for-Like Adj. Revenue Growth | — | — | — | +17.0% | +66.0% |
| Adjusted EBITDA | 555 | 429 | 172 | +29.4% | +222.7% |
| Profit Before Tax (PBT) | 272 | 228 | 88 | +19.3% | +209.1% |
| Tax Expense | 180 | 54 | 63 | +233.3% | +185.7% |
| Profit After Tax (PAT) | 92 | 174 | 25 | -47.1% | +268.0% |
| Basic EPS (₹) | 0.10 | 0.19 | 0.03 | -47.4% | +233.3% |
| Diluted EPS (₹) | 0.10 | 0.19 | 0.03 | -47.4% | +233.3% |
| Closing Cash Balance | 18,288 | 17,972 | 18,857 | +1.8% | -3.0% |
5. Detailed Segment-wise Performance
A. Food Delivery (Zomato)
The food delivery vertical maintained its trajectory of compounding growth and margin expansion.
  Food Delivery NOV (₹ Crore)        Food Delivery Adj EBITDA Margin (% of NOV)
  Q1 FY26:  8,967                     Q1 FY26:  5.0%
  Q4 FY26:  9,757                     Q4 FY26:  5.5%
  Q1 FY27: 10,769  ▲ 20.1% YoY        Q1 FY27:  5.6%  ▲ 60 bps YoY
Net Order Value (NOV): Rose to ₹10,769 crore in Q1 FY27 (+20.1% YoY).
Adjusted Revenue: Stood at ₹3,537 crore, up 33.1% YoY.
Adjusted EBITDA: Rose to ₹606 crore (+34.4% YoY), achieving an Adjusted EBITDA margin of 5.6% of NOV.
Key Operational Metrics:
Average Monthly Transacting Customers: Reached 27.2 million (up from 22.9 million in Q1 FY26).
Active Restaurant Partners: Stood at 328,000.
Active Delivery Partners: Scaled to 638,000 (up from 509,000 in Q1 FY26).
B. Quick Commerce (Blinkit)
Blinkit remains Eternal’s primary growth driver, benefiting from fast store expansion and demand consolidation in metro centers.
| Metric | Q1 FY27 | Q4 FY26 | Q1 FY26 | YoY Change (%) |
| Blinkit NOV (₹ Cr) | 17,132 | 14,386 | 9,203 | +86.2% |
| Reported Revenue (₹ Cr) | 15,664 | 13,232 | 2,400 | +552.7% |
| Gross Profit (₹ Cr) | 4,710 | 3,867 | 2,168 | +117.3% |
| Gross Margin (% of NOV) | 27.5% | 26.9% | 23.6% | +390 bps |
| Adjusted EBITDA (₹ Cr) | 102 | 37 | -162 | Turnaround |
| EBITDA Margin (% of NOV) | 0.6% | 0.3% | -1.8% | +240 bps |
| Total Dark Store Count (#) | 2,443 | 2,243 | 1,544 | +58.2% |
| Average Daily NOV per Store (₹ ‘000) | 827 | 768 | 734 | +12.7% |
| Quarterly Orders (Million) | 331.0 | 273.9 | 176.7 | +87.3% |
| Net Average Order Value (NAOV) (₹) | 518 | 525 | 521 | -0.6% |
C. Going-Out (District)
The District app consolidated entertainment ticketing, dining-out booking, and live events:
NOV: Reached ₹3,218 crore (+59.8% YoY).
Adjusted Revenue: Reached ₹318 crore (+53.6% YoY).
Adjusted EBITDA: Loss narrowed to -₹65 crore (-2.0% of NOV) compared to -₹54 crore (-2.7% of NOV) in Q1 FY26.
Network Footprint: District currently connects users to over 45,000+ restaurants, 5,000+ movie screens, 6,000+ retail outlets, 7,500+ events, and 2,000+ activity centers.
D. B2B Supplies (Hyperpure)
Revenue: Reached ₹1,034 crore. On an LFL basis (adjusting for inventory movements in quick commerce), revenue grew 27% YoY.
Adjusted EBITDA: Stood positive at ₹6 crore (0.6% of revenue).
6. Key Financial & Operational Highlights
Cost & Margin Dynamics
┌────────────────────────────────────────────────────────────────────────┐
│               CONSOLIDATED EXPENSE BREAKDOWN (Q1 FY27)                 │
├───────────────────────────────┬───────────────────┬────────────────────┤
│ Purchases of Stock-in-Trade   │ ₹12,880 Cr        │ 63.4% of Total     │
│ Delivery & Related Charges    │ ₹3,150 Cr         │ 15.5% of Total     │
│ Employee Benefits Expense     │ ₹1,068 Cr         │  5.3% of Total     │
│ Advertisement & Sales Promo   │ ₹945 Cr           │  4.7% of Total     │
│ Depreciation & Amortization   │ ₹546 Cr           │  2.7% of Total     │
│ Other Operating Expenses      │ ₹2,423 Cr         │ 11.9% of Total     │
├───────────────────────────────┼───────────────────┼────────────────────┤
│ Total Operating Expenses      │ ₹20,314 Cr        │ 100.0%             │
└───────────────────────────────┴───────────────────┴────────────────────┘
COGS Expansion via 1P Transition: Purchases of stock-in-trade reached ₹12,880 crore in Q1 FY27, reflecting Blinkit’s full-scale inventory ownership model.
Delivery Logistics Scale: Delivery and related costs grew to ₹3,150 crore, supporting a total active fleet of over 1.15 million delivery partners across food delivery and quick commerce platforms.
Marketing & Platform Fees: Ad spent totaled ₹945 crore, while user platform fee revenue collected reached ₹399 crore.
Tax Provision Impact: Reported PAT fell QoQ to ₹92 crore primarily due to a ₹180 crore tax expense. Historical tax losses in the parent company (Eternal Ltd.) are approaching complete utilization, meaning income tax is now being provided on core business earnings.
7. Management Commentary & Strategic Guidance
Food Delivery & Bistro (Deepinder Goyal, CEO)
On Margin vs. Growth Trade-offs: “We don’t think about it as a trade-off. If we’re doing our job well, growth and margins should compound together—because growth in this business comes from making the platform more useful to more people, which drives frequency, density, and efficiency.”
On Low-Cost Delivery Competitors (Toing/Ownly): “The impact has been limited… There’s no new use case being unlocked here. The customer traction is purely price-driven… What we are spending energy on is Bistro—which is our answer to the question these platforms are pretending to solve. If you want to make food delivery work at ₹50–150 price points, you can’t do it without supply chain innovation. We’re rethinking kitchen operations from first principles… It’s closer to a food manufacturing system optimized for freshness, speed, and consistency.”
Quick Commerce Execution (Albinder Dhindsa, CEO – Blinkit)
On Store Expansion & Competitors: “Competitive intensity remains high but has become more predictable. Our focus on long-term growth vectors remains unique… Pricing-led growth requires sustained cash burn, and leads QC companies into a systemic trap… Infrastructure-led growth, on the other hand, builds operating leverage.”
8. Capital Allocation & Blinkit ROCE Framework
To evaluate capital efficiency as Blinkit scales, management released a revised Return on Capital Employed (ROCE) operational framework based on 12 months of live 1P execution data:
Updated Blinkit Store-Level ROCE Framework
| Parameter | Revised Assumptions (Q1 FY27) | Previous Guidance (Q1 FY26) | Strategic Rationale |
| Capex per Store (inc. Hubs) | ₹2.5 Crore | ₹1.0 Crore | Larger store footprints, assortment expansion, technology automation. |
| Net Working Capital (NWC) | 12 Days of NOV (3.3%) | 18 Days of NOV (5.0%) | Improved inventory turn rates and supplier credit terms. |
| NOV per Day, per Store | ₹11.0 Lakh | ₹7.0 Lakh | Higher store throughput, larger dark store formats. |
| Target EBIT Margin | 4.0% of NOV | 4.0% of NOV | Supported by a 6.0% steady-state Adjusted EBITDA margin. |
| Pre-Tax ROCE Output | 41.7% | Strong Return Profile | Calculated as $4.0\% \text{ EBIT} / 9.6\% \text{ Total Capital Employed}$. |
9. Industry, Macro & Regulatory Environment
Regulatory Framework & Tax Disclosures
GST Notice Disclosures: Eternal is contesting Show Cause Notices (SCNs) and Demand Orders totaling ₹447 crore regarding historical GST liabilities on customer delivery fees. The management, backed by independent tax opinions, considers the legal defense strong. Since September 22, 2025, Eternal collects and remits GST on delivery charges under Section 9(5) of the CGST Act.
Gig Worker Legislation & Social Security Codes: The Union Government notified the consolidated Labour Codes in late 2025 (effective May 2026). Additionally, Eternal is challenging the validity of the Karnataka Platform Based Gig Workers Act in court. Current compliance rules have not created a material financial impact on Q1 FY27 operational earnings.
10. Balance Sheet, Cash Flow & Working Capital
Balance Sheet & Cash Statement (Ind AS)
┌────────────────────────────────────────────────────────────────────────┐
│                   ETERNAL CONSOLIDATED BALANCE SHEET                   │
├──────────────────────────────────┬──────────────────┬──────────────────┤
│ Assets (₹ Crore)                 │ As at Jun 30, '26│ As at Mar 31, '26│
├──────────────────────────────────┼──────────────────┼──────────────────┤
│ Property, Plant & Equipment      │  2,423           │  2,033           │
│ Right-of-Use (ROU) Assets        │  4,677           │  4,294           │
│ Goodwill & Intangibles           │  6,276           │  6,348           │
│ Inventories                      │  3,060           │  2,181           │
│ Total Investments (Current/Non-C)│ 16,218           │ 14,833           │
│ Cash & Cash Equivalents + Bal    │    531           │  1,523           │
│ Other Financial & Current Assets │  10,380          │  9,624           │
├──────────────────────────────────┼──────────────────┼──────────────────┤
│ Total Assets                     │ 43,565           │ 40,736           │
└──────────────────────────────────┴──────────────────┴──────────────────┘
Operating Cash Generation: Operating activities generated ₹905 crore in gross cash during Q1 FY27, up from ₹632 crore in Q1 FY26.
Capital Expenditure Outlay: Eternal deployed ₹711 crore in capex in Q1 FY27 to build out store infrastructure, dark store automation, and logistics networks.
Cash Surplus Position: Consolidated closing cash and liquid treasury investments stood at ₹18,288 crore, up by ₹316 crore QoQ.
11. Valuation & Peer Comparison
| Metric | Eternal Ltd. (Zomato) | Swiggy Ltd. | Zepto (Unlisted Est.) |
| Core Segment Strengths | Food Delivery, QC (Blinkit), District | Food Delivery, Instamart | Quick Commerce |
| Q1 FY27 B2C NOV (₹ Cr) | 31,120 | ~22,500–24,000 | ~11,000–13,000 |
| Quick Commerce Stores (#) | 2,443 | ~1,100–1,300 | ~1,000–1,200 |
| QC Adj. EBITDA Margin | +0.6% of NOV | Negative | Negative |
| Food Delivery EBITDA Margin | 5.6% of NOV | ~4.0%–4.5% | N/A |
| Cash Balance (₹ Cr) | 18,288 | ~11,500 | ~6,500 |
12. Comprehensive Risk & Opportunity Matrix
┌────────────────────────────────────────────────────────────────────────┐
│                      RISKS vs OPPORTUNITIES                            │
├──────────────────────────────────────┬─────────────────────────────────┤
│ KEY RISKS                            │ KEY OPPORTUNITIES               │
├──────────────────────────────────────┼─────────────────────────────────┤
│ 1. State-level Gig Worker Regulations│ 1. Gourmet Store Premiumization │
│ 2. Inventory Shrinkage/Expiry (1.8%) │ 2. Bistro Automation Model      │
│ 3. Tier-2 Dark Store Unit Economics  │ 3. District Live Ticketing Scale│
└──────────────────────────────────────┴─────────────────────────────────┘
13. Scenario Analysis: Bull, Base & Bear Cases
1. Bull Case Scenario
Assumptions: Blinkit reaches 3,200 dark stores by end-FY27; Food delivery NOV grows >22% YoY while margins hit 6.0% of NOV; District achieves breakeven.
Outcome: Consolidated EBITDA margins hit >4.0% of NOV, accelerating free cash flow generation.
2. Base Case Scenario
Assumptions: Blinkit maintains 2,600–2,800 dark stores; Food delivery grows 18–20% YoY at 5.5% EBITDA margins; District remains moderately loss-making during expansion.
Outcome: Steady annual consolidated revenue expansion of 40–50% with positive cash generation.
3. Bear Case Scenario
Assumptions: Intense price discounting from venture-backed quick commerce competitors; unfavorable legal rulings on gig worker welfare laws or GST demands.
Outcome: Blinkit EBITDA margins regress to zero or negative; profit targets are delayed.
14. Actionable Investor Takeaways
Long-Term Growth Investors: Eternal demonstrates strong network effects across its business verticals. The operating leverage in Blinkit and stable margins in food delivery provide long-term earnings potential.
Value Investors: Trailing accounting P/E metrics remain elevated due to non-cash ESOP charges and tax provisions. Key valuation tracking should focus on EV/Adjusted EBITDA and Cash Flow metrics.
Short-Term Traders: The market is responding to segment margin trends and dark store operational additions. Watch key technical support levels near moving averages.
Educational Disclaimer: This article is for informational and educational purposes only and does not constitute financial advice, an endorsement, or a stock recommendation. Investors must conduct independent due diligence before making investment decisions.
Conclusion & Final Editorial View
Editorial View (Clearly Labeled): Eternal Ltd.’s Q1 FY27 financial performance demonstrates effective operational scaling. The company has successfully transitioned Blinkit into a positive EBITDA contributor while maintaining store footprint expansion. Food delivery continues to supply steady operational cash flows to fund new growth bets like Bistro and District.
Investors should monitor dark store return profiles, working capital management, and potential regulatory shifts around gig worker social security frameworks in upcoming quarters.