1. Breaking News Summary
Bharat Petroleum Corporation Limited (BPCL), India’s second-largest state-owned oil marketing company (OMC), published its unaudited standalone and consolidated financial results for the first quarter of FY27 (ending June 30, 2026) on July 22, 2026.
┌────────────────────────────────────────────────────────────────────────┐
│                      BPCL Q1 FY27 HEADLINE RESULTS                     │
├──────────────────────────┬──────────────────────────┬──────────────────┤
│ Standalone Revenue       │ Standalone Net Loss      │ Market Sales     │
│ ₹1,59,479 Cr (+23.1% YoY)│ -₹3,962 Cr (vs +₹6,124Cr)│ 14.13 MMT        │
└──────────────────────────┴──────────────────────────┴──────────────────┘
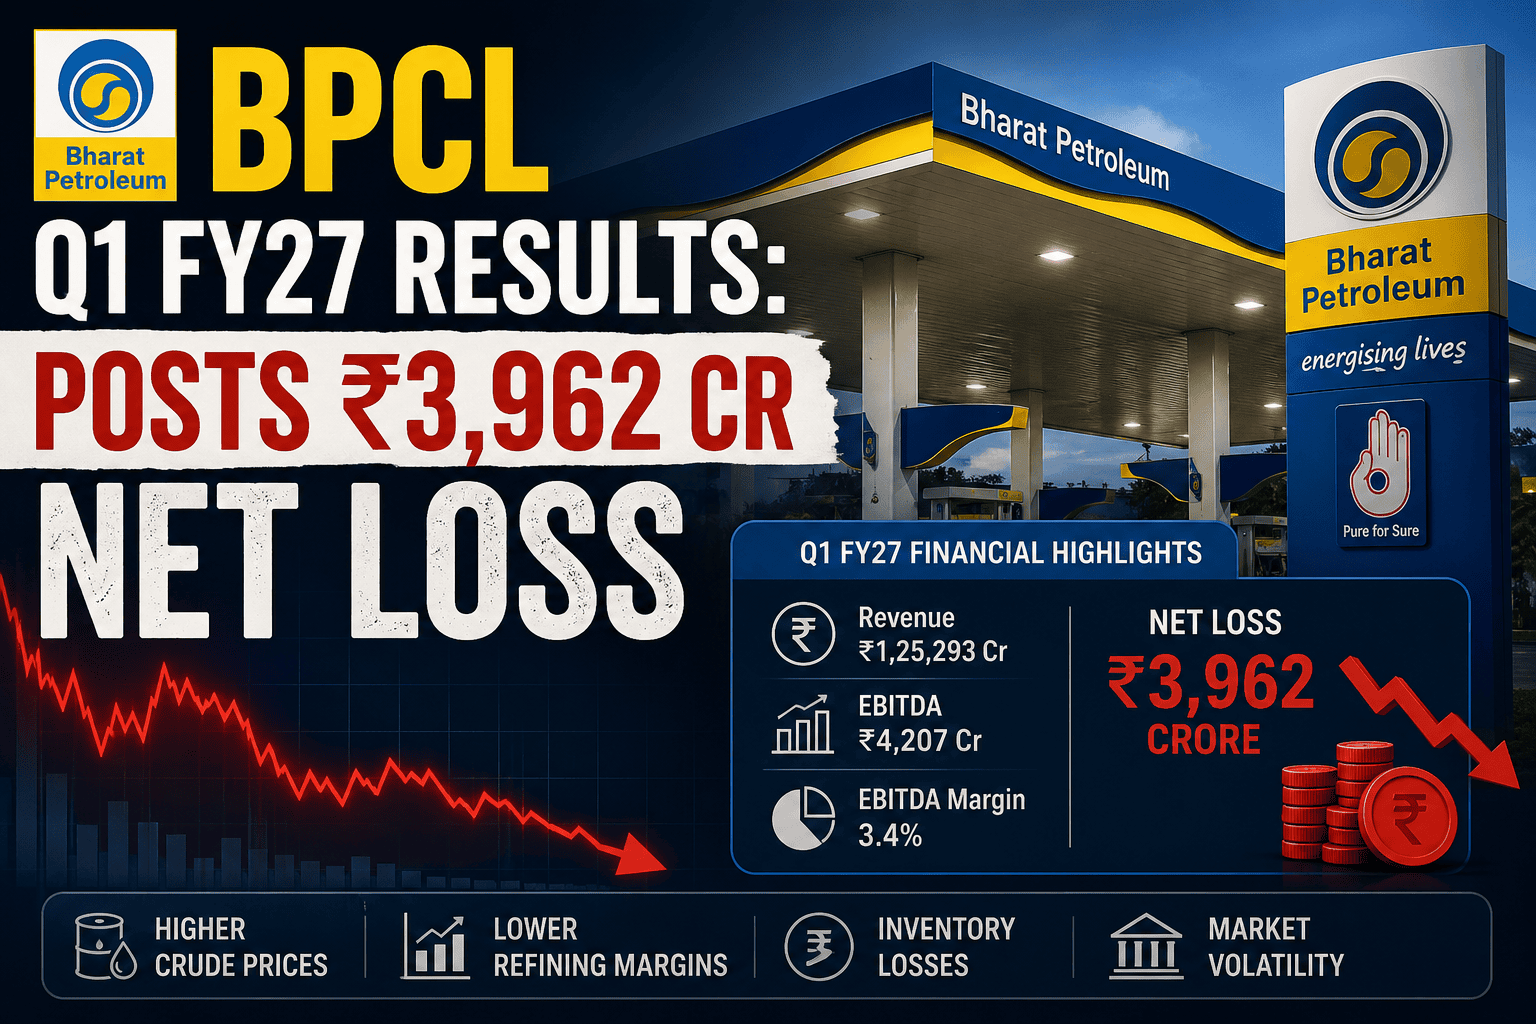
The state-run refiner posted a standalone net loss of ₹3,962.13 crore for Q1 FY27, compared to a net profit of ₹6,123.93 crore in the corresponding quarter of the previous financial year (Q1 FY26) and a net profit of ₹3,191.49 crore in the preceding quarter (Q4 FY26).
The primary driver behind this downturn was the suppression of retail marketing margins on essential petroleum products (auto fuels like petrol and diesel) where domestic retail prices were held steady despite elevated crude oil procurement costs. While refining operational margins provided partial support, they could not fully offset the marketing under-recoveries experienced during the quarter.
Despite the bottom-line pressure, BPCL’s top-line expanded solidly. Standalone Revenue from Operations jumped 23.08% YoY to ₹1,59,479.28 crore (compared to ₹1,29,577.89 crore in Q1 FY26). Following the earnings announcement on July 22, 2026, BPCL share price closed at ₹309.55 on the NSE, down 3.07% for the day.
2. Quick Snapshot
| Financial / Operational Metric | Verified Value | Data Source / Date |
| Company Name | Bharat Petroleum Corporation Limited | BSE / NSE Disclosures |
| BSE / NSE Symbol | 500547 / BPCL | Exchanges |
| Current Market Price (CMP) | ₹309.55 (as of July 22, 2026 close) | NSE Market Data |
| Market Capitalization | Approx. ₹1,34,428 Crore | Market Data |
| Sector / Industry | Oil & Gas / Refineries & Marketing | NSE / BSE |
| 52-Week High / Low | ₹391.65 / ₹266.60 | Exchange Records |
| Trailing P/E Ratio | ~5.12x – 5.63x | Exchange Snapshot |
| Price-to-Book Value (P/B) | ~1.34x – 1.72x | Market Snapshot |
| Dividend Yield | ~5.5% – 7.2% | Market Snapshot |
| Promoter Holding | 52.98% (Government of India) | Shareholding Disclosures |
| FII Shareholding | 19.58% (as of March 2026 quarter) | Shareholding Disclosures |
| DII Shareholding | 18.53% (as of March 2026 quarter) | Shareholding Disclosures |
| Public / Retail Holding | 8.92% (as of March 2026 quarter) | Shareholding Disclosures |
3. Financial Highlights
Standalone Financial Performance (Ind AS)
The table below outlines BPCL’s standalone quarterly financial figures:
| Financial Metric (in ₹ Crore) | Q1 FY27 | Q4 FY26 | Q1 FY26 | YoY Change (%) | QoQ Change (%) |
Revenue from Operations | 1,59,479.28 | 1,34,896.40 | 1,29,577.89 | +23.08% | +18.22% |
Other Income | 1,253.44 | 1,063.74 | 748.71 | +67.41% | +17.83% |
Total Income | 1,60,732.72 | 1,35,960.14 | 1,30,326.60 | +23.33% | +18.22% |
Cost of Materials Consumed | 90,588.10 | 54,264.27 | 53,686.13 | +68.74% | +66.94% |
Purchase of Stock-in-Trade | 65,348.26 | 43,815.22 | 40,782.82 | +60.23% | +49.15% |
Changes in Inventories | (8,368.16) | (1,231.68) | 1,335.19 | Loss to Gain | Significant |
Excise Duty Expense | 8,250.02 | 16,247.02 | 17,063.24 | -51.65% | -49.22% |
Employee Benefits Expense | 832.22 | 1,119.68 | 901.99 | -7.73% | -25.67% |
Finance Costs | 415.27 | 479.05 | 373.51 | +11.18% | -13.31% |
Depreciation & Amortization | 2,065.93 | 2,038.37 | 1,881.81 | +9.78% | +1.35% |
Other Expenses | 6,906.26 | 10,621.12 | 6,145.41 | +12.38% | -34.98% |
Total Expenses | 1,66,037.90 | 1,27,353.05 | 1,22,170.10 | +35.91% | +30.38% |
Profit / (Loss) Before Tax | (5,305.18) | 4,257.96 | 8,156.50 | Turnaround Loss | Turnaround Loss |
Tax Expense / (Credit) | (1,343.05) | 1,066.47 | 2,032.57 | Tax Credit Rec | Tax Credit Rec |
Net Profit / (Loss) After Tax | (3,962.13) | 3,191.49 | 6,123.93 | -164.70% | -224.14% |
Basic & Diluted EPS (₹) | (9.27) | 7.47 | 14.33 | -164.69% | -224.09% |
Consolidated Financial Performance (Ind AS)
┌────────────────────────────────────────────────────────────────────────┐
│                   CONSOLIDATED PERFORMANCE AT A GLANCE                 │
├───────────────────────────────┬───────────────────┬────────────────────┤
│ Revenue from Operations       │ ₹1,59,527.05 Cr   │ +23.08% YoY        │
│ Total Comprehensive Income    │ -₹1,970.97 Cr     │ Turnaround Loss    │
│ Net Loss Attributable to      │ -₹1,872.70 Cr     │ (vs +₹6,839.02 Cr) │
│ Share Capital Paid-Up         │ ₹4,272.58 Cr      │ Unchanged          │
└───────────────────────────────┴───────────────────┴────────────────────┘
The consolidated metrics for BPCL were bolstered by foreign currency translation reserve (FCTR) reclassifications and subsidiary performance:
Consolidated Revenue from Operations: ₹1,59,527.05 crore (+23.08% YoY from ₹1,29,614.69 crore).
Share of Profit from Equity Investees / Associates: ₹401.13 crore.
Exceptional Item (Income): ₹1,884.56 crore. Reclassification of cumulative Foreign Currency Translation Reserve (FCTR) gain to P&L following BPRL Ventures BV’s acquisition of the remaining stake in IBV Brazil Petroleo Limitada (making IBV an indirect wholly-owned subsidiary).
Consolidated Net Loss After Tax: -₹1,872.70 crore (compared to a profit of ₹6,839.02 crore in Q1 FY26).
Physical Performance Metrics
| Operational Indicator | Q1 FY27 | Q4 FY26 | Q1 FY26 | YoY Change (%) | QoQ Change (%) |
Refinery Throughput (MMT) | 10.15 | 10.40 | 10.42 | -2.59% | -2.40% |
Domestic Market Sales (MMT) | 13.62 | 13.86 | 13.58 | +0.29% | -1.73% |
Export Market Sales (MMT) | 0.51 | 0.35 | 0.45 | +13.33% | +45.71% |
Total Market Sales (MMT) | 14.13 | 14.21 | 14.03 | +0.71% | -0.56% |
Domestic Sales Growth Rate (%) | 0.29% | 3.28% | 3.19% | -290 bps | -299 bps |
4. Key Takeaways
Suppressed Marketing Margins Drive Loss: Standalone net loss stood at ₹3,962.13 crore due to frozen retail pump prices relative to higher crude procurement costs.
Top-Line Expansion: Standalone revenue grew 23.08% YoY to ₹1,59,479.28 crore, reflecting higher throughput value.
Crude Procurement Costs Spike: Cost of materials consumed surged 68.74% YoY to ₹90,588.10 crore.
Refinery Throughput: Total refinery crude processing held steady at 10.15 MMT in Q1 FY27 (vs 10.42 MMT in Q1 FY26).
Market Sales Volume: Combined domestic and export market sales reached 14.13 MMT (+0.71% YoY).
LPG Negative Buffer Position: Cumulative net negative LPG buffer stood at ₹15,803.74 crore as of June 30, 2026.
Government Compensation Disbursed: Recognized ₹1,898.49 crore during the quarter out of the approved ₹7,594.00 crore government compensation package for domestic LPG under-recoveries.
Exceptional Item Boosts Consolidated P&L: A ₹1,884.56 crore non-cash gain was recognized on FCTR reclassification upon consolidating IBV Brazil Petroleo.
Debt Position: Total outstanding debt (excluding lease liabilities) rose to ₹17,396.42 crore (Debt-to-Equity ratio increased to 0.19x).
Board Governance Compliance: The company noted non-compliance with SEBI LODR rules regarding optimum independent/woman director representation due to pending central government appointments.
5. Business Segment Analysis
BPCL operates across two primary reportable business segments:
┌────────────────────────────────────────────────────────────────────────┐
│                   BPCL REVENUE BY SEGMENT (Q1 FY27)                    │
├──────────────────────────────────────┬─────────────────────────────────┤
│ Downstream Petroleum                 │ ₹1,59,479.28 Cr (99.97%)        │
│ Exploration & Production (E&P)       │ ₹47.77 Cr (0.03%)               │
└──────────────────────────────────────┴─────────────────────────────────┘
A. Downstream Petroleum (Refining & Marketing)
This core business segment encompasses refining crude oil and marketing petroleum products through company-owned and dealer-operated retail outlets.
Segment Revenue: ₹1,59,479.28 crore (+23.08% YoY).
Segment Results (Loss Before Tax, Other Income & Finance Costs): -₹5,919.53 crore (compared to a profit of ₹8,060.47 crore in Q1 FY26).
Primary Cause: High input crude costs combined with uncompensated retail price ceilings hit profitability.
Segment Assets: ₹1,96,957.11 crore.
Segment Liabilities: ₹95,526.50 crore.
B. Exploration & Production of Hydrocarbons (E&P)
Managed primarily through wholly-owned subsidiary Bharat PetroResources Limited (BPRL) and its overseas joint ventures/step-down subsidiaries.
Segment Revenue: ₹47.77 crore (+29.81% YoY from ₹36.80 crore in Q1 FY26).
Segment Results (Profit Before Tax, Other Income & Finance Costs): ₹2,084.10 crore (compared to ₹819.24 crore in Q1 FY26).
Segment Performance Drivers: Benefited from upstream asset consolidations and accounting gain adjustments related to the acquisition of Videocon Energy Brazil Limited’s stake in IBV Brazil Petroleo Limitada.
Segment Assets: ₹38,856.97 crore.
6. Management Commentary & Regulatory Notes
Management Disclosures in Official Filings
Reason for Loss: The official notes state: “The loss during the current quarter is mainly due to suppressed marketing margin on certain petroleum products which was partially offset by higher refining margin.”
LPG Buffer & Compensation Mechanism:
Under Ministry of Petroleum and Natural Gas (MoPNG) guidelines, OMCs retain price differences in a separate buffer account when market prices drop below effective customer costs.
As of June 30, 2026, BPCL carried a cumulative net negative buffer of ₹15,803.74 crore (up from ₹12,318.52 crore as of March 31, 2026). Revenue has been suppressed by this amount.
MoPNG approved a subsidy compensation of ₹7,594.00 crore to cover under-recoveries incurred up to March 31, 2026, payable in 12 monthly installments starting November 2025. BPCL recognized ₹1,898.49 crore under Revenue from Operations in Q1 FY27.
Governance & Legal Audit Observations:
The Statutory Auditors (MM Nissim & Co LLP and Manohar Chowdhry & Associates) issued a limited review report noting non-compliance with Regulation 17(1)(a) and 17(1)(b) of SEBI LODR.
BPCL lacks the required number of Independent Directors and a Woman Director. Consequently, an Audit Committee under Section 177 of the Companies Act could not be formally constituted prior to Board approval. The financial results were directly reviewed and approved by the Board of Directors.
7. Why Results Changed (Cost & Margin Dynamics)
┌────────────────────────────────────────────────────────────────────────┐
│                   BPCL COST ANALYSIS (Q1 FY27 vs Q1 FY26)              │
├───────────────────────────────┬───────────────────┬────────────────────┤
│ Crude & Raw Materials Cost    │ ₹90,588 Cr        │ +68.74% YoY        │
│ Traded Goods Purchase         │ ₹65,348 Cr        │ +60.23% YoY        │
│ Excise Duty Collected/Paid    │ ₹8,250 Cr         │ -51.65% YoY        │
│ Total Operating Costs         │ ₹1,66,038 Cr      │ +35.91% YoY        │
└───────────────────────────────┴───────────────────┴────────────────────┘
The underlying factors that altered BPCL’s profitability profile in Q1 FY27 include:
Squeezed Marketing Margins: Retail price freezes on petrol and diesel restricted the company’s ability to pass on elevated crude procurement costs to end consumers.
Raw Material Cost Inflation: Cost of materials consumed jumped by ₹36,901.97 crore YoY (+68.74%) due to crude oil import price movements.
Purchases of Finished Traded Goods: Increased to ₹65,348.26 crore (+60.23% YoY), reflecting higher volumes purchased to meet domestic retail obligations.
Excise Duty Restructuring: Reported excise duty dropped to ₹8,250.02 crore compared to ₹17,063.24 crore in Q1 FY26 due to statutory tax adjustments.
Tax Provision Impact: Deferred tax credit of ₹1,343.05 crore partially buffered the standalone loss before tax.
8. Ratio Analysis
The financial health and efficiency metrics for BPCL as of Q1 FY27 are summarized below:
| Financial Ratio | Q1 FY27 | Q4 FY26 | Q1 FY26 | Target / Normative Direction |
Debt to Equity Ratio (times) | 0.19 | 0.11 | 0.12 | Low Leverage (<0.5x is conservative) |
Current Ratio (times) | 0.83 | 0.89 | 0.88 | Working Capital Efficiency (>1.0x preferred) |
Debt Service Coverage Ratio (DSCR) | 0.20 | 1.42 | 1.79 | Debt Repayment Cushion (>1.5x preferred) |
Interest Service Coverage Ratio (ISCR) | Negative* | 13.84 | 18.75 | Interest Coverage Ability |
Operating Margin (%) | (3.98%) | 5.11% | 6.32% | Core Operational Profitability |
Net Profit Margin (%) | (1.17%) | 4.17% | 5.28% | Bottom-line Efficiency |
Debtor Turnover Ratio (times) | 28.86 | 22.35 | 15.29 | Receivables Collection Speed |
Inventory Turnover Ratio (times) | 2.85 | 2.79 | 2.96 | Stock Liquidation Efficiency |
*ISCR turned negative during Q1 FY27 due to loss before tax.
9. Industry & Competitor Analysis
BPCL operates alongside major public and private sector refiners in India’s downstream oil sector.
| Metric / Parameter | BPCL (Q1 FY27) | Indian Oil (IOCL) | HPCL | Reliance Industries |
| Market Capitalization | ~₹1,34,428 Cr | ~₹2,01,086 Cr | ~₹86,283 Cr | ~₹17,91,435 Cr |
| Primary Revenue Model | Downstream Refining/Mktg | Downstream Refining/Mktg | Downstream Refining/Mktg | Integrated Energy/Retail |
| Domestic Market Presence | Second Largest OMC | Largest OMC | Third Largest OMC | Private Retailer |
| P/E Multiple (TTM) | ~5.12x – 5.63x | ~4.78x | ~4.78x | ~23.97x |
| Promoter Stake | 52.98% | 51.50% | 54.90% | 50.00% |
  DOMESTIC RETAIL FUEL MARKET SHARE (OMCs)
  =============================================
  IOCL      ████████████████████████ (Approx. 40-42%)
  BPCL      █████████████████ (Approx. 28-30%)
  HPCL      █████████████ (Approx. 24-25%)
  Private   ██ (Approx. 4-5%)
10. Share Price Analysis
On July 22, 2026, BPCL stock traded with increased volatility following the Q1 FY27 financial disclosure:
┌────────────────────────────────────────────────────────────────────────┐
│                   BPCL TRADING SUMMARY (JULY 22, 2026)                 │
├───────────────────────────────┬────────────────────────────────────────┤
│ Previous Close                │ ₹319.35                  │
│ Open Price                    │ ₹317.50                  │
│ Day High                      │ ₹321.70                  │
│ Day Low                       │ ₹308.10                  │
│ NSE Closing Price             │ ₹309.55 (-3.07%)         │
│ Total Traded Volume (NSE)     │ 9.78 Million Shares      │
└───────────────────────────────┴────────────────────────────────────────┘
Price Returns Overview
1-Week Return: +4.58%
1-Month Return: +3.48%
6-Month Return: -9.26%
1-Year Return: -6.78%
52-Week Range: ₹266.60 (April 2, 2026) to ₹391.65 (February 5, 2026)
11. Brokerage & Analyst View
Sell-side market sentiment reflects a split perspective:
┌────────────────────────────────────────────────────────────────────────┐
│                      ANALYST CONSENSUS BREAKDOWN                       │
├────────────────────────────────────────────────────────────────────────┤
│ █ BUY (40%)        - Focus on cheap valuation & dividend yield      │
│ █ HOLD / NEUTRAL (45%) - Awaiting marketing margin normalization      │
│ █ SELL / UNDERPERFORM (15%) - Margin risks & oil price volatility     │
└────────────────────────────────────────────────────────────────────────┘
Bullish Arguments: Focus on BPCL’s trading multiple (~5.1x TTM P/E), high dividend yield (~5.5% – 7.2%), clean balance sheet (0.19x debt-to-equity), and potential government compensation for under-recoveries.
Bearish / Cautionary Arguments: Focus on unpredictable marketing margins on retail fuels, rising crude input costs, and corporate governance issues regarding board independent director appointments.
12. Risk Factors
Retail Price Suppression Risk: Inability to adjust pump prices when global crude prices spike directly squeezes marketing margins.
Volatile Gross Refining Margins (GRM): Global product cracks can fluctuate based on refinery additions and geopolitical events.
Government Subsidy Delays: Timing and quantum of budget allocations for LPG under-recoveries create cash flow mismatches.
Foreign Currency Risk: Crude oil import purchases billed in USD expose BPCL to Rupee devaluation risks.
Board Governance Compliance: Lack of independent and woman directors remains an audit flag under SEBI rules.
13. Investment Thesis
Bull Case Scenario
Global crude oil prices moderate, restoring retail fuel marketing margins.
Government accelerates subsidy disbursements for negative LPG buffer balances.
Upstream assets (Mozambique LNG, Brazil E&P) start contributing steady cash flows.
Bear Case Scenario
Crude oil prices remain elevated while retail fuel prices remain capped.
Refining margins compress due to global overcapacity.
Working capital debt rises to fund operational losses.
14. What Investors Should Watch Next
MoPNG Subsidy Disbursements: Tracking the monthly ₹632.83 crore compensation payouts for LPG under-recoveries.
Global Crude Oil Benchmarks: Brent crude price movements, which directly determine BPCL’s raw material costs.
Board Reconstitution: Official appointments of Independent Directors and a Woman Director to satisfy SEBI rules.
Mozambique LNG Status: Progress on BPRL’s overseas natural gas developments following Force Majeure resolution.
Final Verdict & Editorial Outlook
Editorial Analysis: BPCL’s Q1 FY27 financial report highlights the structural operational risk inherent to state-owned Oil Marketing Companies. While top-line revenue remains robust (+23% YoY), bottom-line profitability remains dependent on the alignment between landed crude costs and retail pump realisations.
Investors with a long-term horizon should track government subsidy disbursements, refining margins, and retail pricing flexibility.