1. Introduction
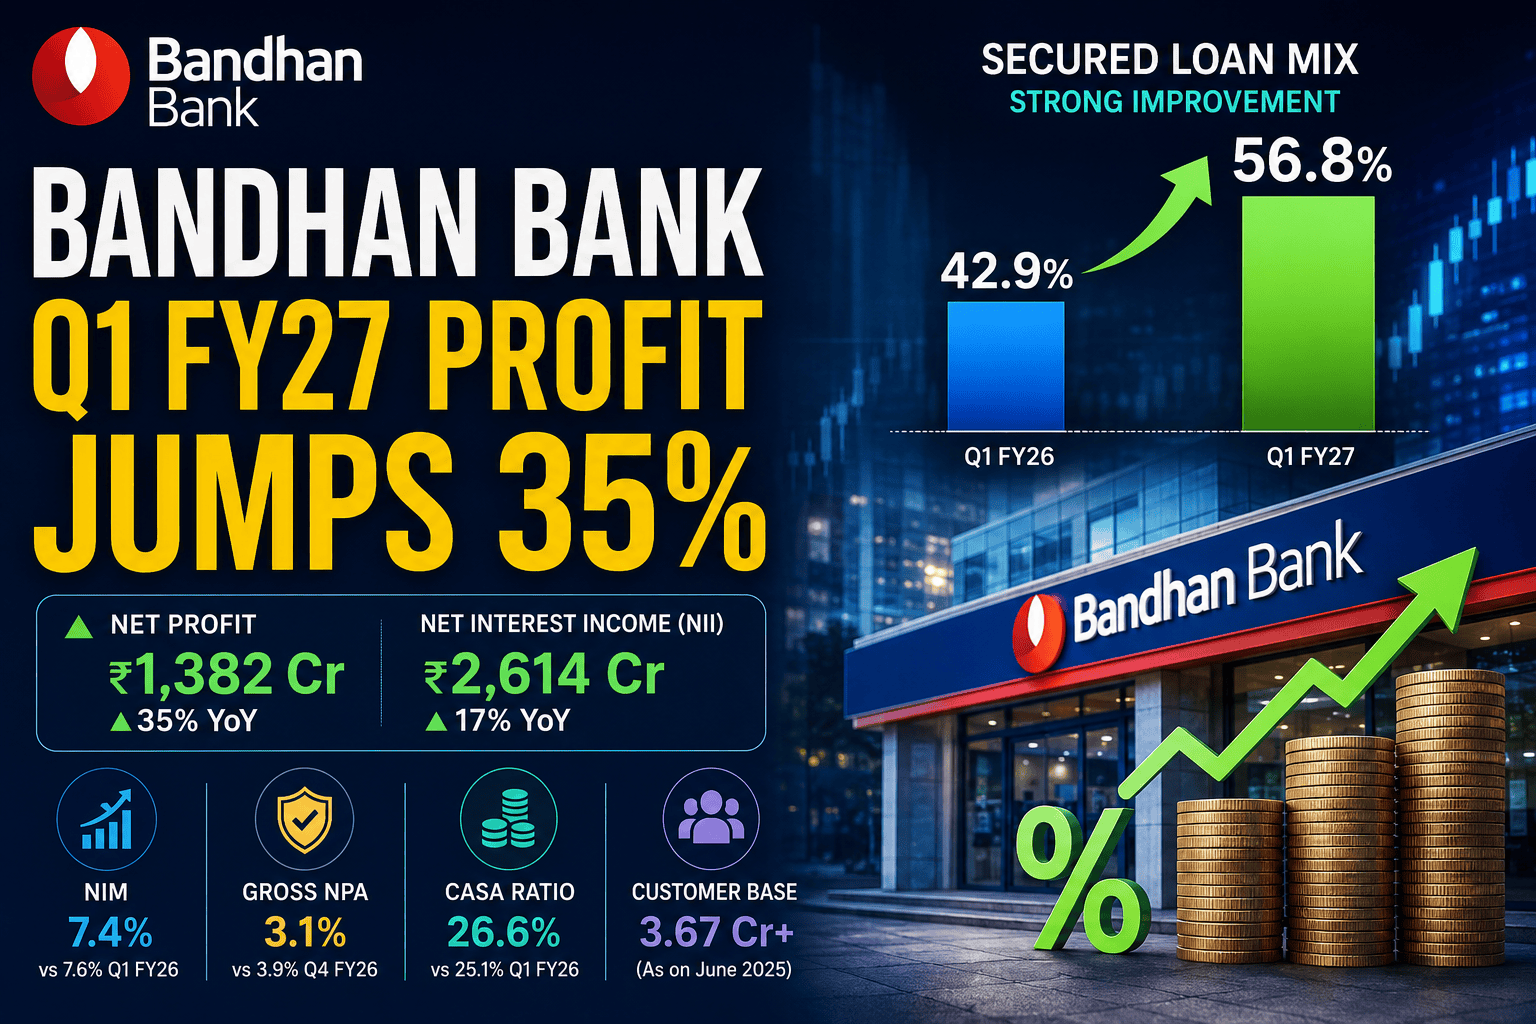
Bandhan Bank Limited published its official investor disclosures for the first quarter of Financial Year 2026–27 (Q1 FY27) on July 21, 2026. The bank delivered a strong net profit turnaround, recording Profit After Tax (PAT) of ₹5.0 billion. This represents a remarkable 34.9% year-on-year (YoY) surge compared to the ₹3.7 billion recorded in Q1 FY26.
This bottom-line surge occurred despite headwinds in top-line operating profit and Net Interest Margin (NIM) pressures. Operating profit dropped by 18.6% YoY to ₹13.6 billion, and NIM compressed by 16 basis points (bps) YoY to 6.2%.
What powered this impressive net profit growth during operating headwinds? The answer lies in a dramatic 40.5% YoY reduction in total provisions (which dropped to ₹6.8 billion) and an impressive asset quality improvement. Gross Non-Performing Assets (GNPA) fell by 182 bps YoY to 3.1%. Additionally, the bank’s multi-year effort to balance its portfolio showed progress: the secured loan mix expanded to 56.8%, reducing dependence on uncollateralized microfinance loans.
+-----------------------------------------------------------------------------------+
|                            Q1 FY27 FINANCIAL SCORECARD                            |
+------------------------------------+----------------------------------------------+
| Net Profit (PAT)                   | ₹5.0 Billion (+34.9% YoY)                     |
| Net Interest Income (NII)          | ₹29.2 Billion (+5.9% YoY)                    |
| Gross Advances                     | ₹1,555.6 Billion (+16.4% YoY)                |
| Gross NPA Ratio                    | 3.1% (Improved by 182 bps YoY)               |
| Secured Loan Mix                   | 56.8% (Up from 52.1% in Q1 FY26)             |
+------------------------------------+----------------------------------------------+
2. Key Numbers at a Glance
The following table summarizes Bandhan Bank’s essential performance figures for Q1 FY27 compared against sequential (Q4 FY26) and corresponding year-ago (Q1 FY26) metrics.
| Financial Metric | Q1 FY26 | Q4 FY26 | Q1 FY27 | YoY Change (%) / (bps) | QoQ Change (%) / (bps) | Sourced Reference |
| Gross Advances | ₹1,336.2 Bn | ₹1,542.3 Bn | ₹1,555.6 Bn | +16.4% | +0.9% | Official Investor Presentation |
| Total Deposits | ₹1,546.7 Bn | ₹1,663.4 Bn | ₹1,648.9 Bn | +6.6% | -0.9% | Official Investor Presentation |
| Retail Deposits Share | 68.2% | 73.7% | 74.0% | +580 bps | +30 bps | Official Investor Presentation |
| CASA Ratio | 27.1%* | 29.3% | 29.4% | +230 bps | +10 bps | Official Investor Presentation (*Mar’25 baseline) |
| Net Interest Income (NII) | ₹27.6 Bn | ₹28.0 Bn | ₹29.2 Bn | +5.9% | +4.5% | Official Investor Presentation |
| Non-Interest Income | ₹7.3 Bn | ₹7.7 Bn | ₹6.0 Bn | -16.8% | -21.7% | Official Investor Presentation |
| Total Revenue (Net) | ₹34.8 Bn | ₹35.7 Bn | ₹35.2 Bn | +1.2% | -1.2% | Official Investor Presentation |
| Operating Expenses | ₹18.1 Bn | ₹21.3 Bn | ₹21.7 Bn | +19.4% | +1.9% | Official Investor Presentation |
| Operating Profit (PPOP) | ₹16.7 Bn | ₹14.4 Bn | ₹13.6 Bn | -18.6% | -5.8% | Official Investor Presentation |
| Total Provisions | ₹11.5 Bn | ₹6.8 Bn | ₹6.8 Bn | -40.5% | +0.8% | Official Investor Presentation |
| Profit After Tax (PAT) | ₹3.7 Bn | ₹5.3 Bn | ₹5.0 Bn | +34.9% | -6.1% | Official Investor Presentation |
| Net Interest Margin (NIM) | 6.4% | 6.2% | 6.2% | -20 bps | 0 bps | Official Investor Presentation |
| Gross NPA Ratio | 5.0% | 3.3% | 3.1% | -190 bps | -20 bps | Official Investor Presentation |
| Net NPA Ratio | 1.4% | 1.0% | 0.9% | -50 bps | -10 bps | Official Investor Presentation |
| Provision Coverage Ratio | 73.7% | 71.1% | 71.1% | -260 bps | 0 bps | Official Investor Presentation |
| Credit Cost (Annualized) | 3.5% | 2.0% | 1.8% | -170 bps | -20 bps | Official Investor Presentation |
| Capital Adequacy (CRAR) | 19.4% | 18.0% | 18.2% | -120 bps | +20 bps | Official Investor Presentation |
| Cost-to-Income Ratio | 52.1% | 59.6% | 61.5% | +940 bps | +190 bps | Official Investor Presentation |
| Return on Assets (ROA) | 0.8% | 1.1% | 1.0% | +20 bps | -10 bps | Official Investor Presentation |
| Return on Equity (ROE) | 5.9% | 8.5% | 7.7% | +180 bps | -80 bps | Official Investor Presentation |
3. Executive Summary
Strong Bottom-Line Growth: Bandhan Bank recorded a 34.9% YoY increase in Net Profit (PAT) to ₹5.0 billion in Q1 FY27, up from ₹3.7 billion in Q1 FY26.
Credit Cost Tailwinds: Net profit jumped primarily because total provisions declined by 40.5% YoY to ₹6.8 billion. Annualized credit cost dropped from 3.5% to 1.8%.
Operating Profit Drag: Pre-Provision Operating Profit (PPOP) dropped 18.6% YoY to ₹13.6 billion, hit by a 19.4% increase in operating expenses and a 16.8% decline in non-interest income.
Asset Quality Gains: Asset quality improved, with Gross NPA falling to 3.1% (down 182 bps YoY) and Net NPA dropping below 1.0% to hit 0.9%.
Structural Loan Diversification: The bank expanded its secured loan book to 56.8% of total advances. Unsecured Emerging Entrepreneurs Business (EEB) group loans now account for ~34% of the portfolio, down from 39.5% a year ago.
NIM Stabilizing at Lower Levels: Annualized Net Interest Margin (NIM) stood at 6.2%, down from 6.4% in Q1 FY26, reflecting higher funding costs and a shift toward lower-yielding secured loans.
Deposit Granularity Gains: Retail deposits reached 74.0% of total deposits, while total deposits expanded 6.6% YoY to ₹1,648.9 billion.
Operating Efficiency Pressures: Cost-to-Income ratio climbed to 61.5% in Q1 FY27 (up from 52.1% in Q1 FY26), driven by investments in technology, digital expansion, and branch networks.
Capital Adequacy Buffer: Capital Adequacy Ratio (CRAR) remained strong at 18.2% (Tier-I at 17.5%), comfortably above regulatory requirements.
Balanced Investment Case: The bank is navigating a transition from a high-margin microfinance institution to a diversified universal bank. Near-term operating earnings are under pressure, but risk-adjusted returns and asset quality show structural improvements.
4. Company Snapshot
Bandhan Bank Limited began as a microfinance institution (MFI) focused on women entrepreneurs in rural and semi-urban India. It transformed into a universal bank in August 2015 after receiving a banking license from the Reserve Bank of India (RBI).
+-----------------------------------------------------------------------------------+
|                        BANDHAN BANK DISTRIBUTION FOOTPRINT                        |
+-----------------------------------------------------------------------------------+
|  Total Banking Outlets: 6,388 Outlets Across 35 States & UTs                      |
|                                                                                   |
|  [Branches: 1,988]  +  [EEB Banking Units: 4,400]  +  [ATMs: 438]                 |
|                                                                                   |
|  Geographic Reach:                                                                |
|  * Semi-Urban & Rural Presence: 70% of total outlets                              |
|  * Regional Distribution: East (45%), Central (16%), South (11%),                 |
|    West (10%), North (8%), North-East (10%)                                       |
+-----------------------------------------------------------------------------------+
Business Model & Segment Architecture
Bandhan Bank operates a hybrid banking model, using its microfinance footprint while growing traditional commercial, retail, and corporate banking books.
                    BANDHAN BANK GROSS ADVANCES MIX (₹1,555.6 BN)
                                         |
     +-------------------+---------------+-------------------+-------------------+
     |                   |                                   |                   |
  EEB Book           Housing Finance                   Wholesale Banking   Retail Assets
(Group + SBAL)         ₹345.4 Bn                            ₹512.8 Bn        ₹161.0 Bn
  ₹526.4 Bn             (~22.2%)                             (~33.0%)         (~10.4%)
  (~33.8%)
Emerging Entrepreneurs Business (EEB): Includes micro-lending group loans and Small Business & Agri Loans (SBAL). EEB group loans total ₹352.2 billion, while SBAL accounts for ₹174.2 billion.
Housing Finance: Formed through the acquisition of GRUH Finance, this book totals ₹345.4 billion. It focuses on affordable housing loans (76.2%), Loan Against Property (22.9%), and construction finance (0.9%).
Wholesale Banking Group (WBG): Reached ₹512.8 billion, catering to Corporate Banking (CBG), Financial Institution Groups (FIG), Commercial Banking, and Business Banking.
Retail Assets: Covers vehicle loans, personal loans, gold loans, and term-deposit-backed overdrafts, totaling ₹161.0 billion.
5. Quarter Highlights: What Drove Performance?
Top-Line vs. Bottom-Line Divergence
The headline takeaway from Q1 FY27 is the divergence between top-line revenue growth and net profit:
Net Interest Income (NII):    ₹29.2 Bn (+5.9% YoY)     [GROWTH]
Non-Interest Income:          ₹6.0 Bn  (-16.8% YoY)    [DECLINE]
Total Net Revenue:            ₹35.2 Bn (+1.2% YoY)     [FLAT]
Operating Expenses:           ₹21.7 Bn (+19.4% YoY)    [HIGHER EXPENSES]
Pre-Provision Profit (PPOP):  ₹13.6 Bn (-18.6% YoY)    [OPERATING DRAG]
Total Provisions:             ₹6.8 Bn  (-40.5% YoY)    [MAJOR TAILWIND]
Net Profit (PAT):             ₹5.0 Bn  (+34.9% YoY)    [BOTTOM-LINE SURGE]
+-----------------------------------------------------------------------------------+
|                        WHAT SURPRISED THE MARKET IN Q1 FY27?                      |
+-----------------------------------------------------------------------------------+
| POSITIVE SURPRISES:                                                               |
| 1. Sharper-than-expected fall in credit costs to 1.8% (from 3.5% YoY).            |
| 2. Gross NPA dropped to 3.1%, showing stabilizing microfinance asset quality.    |
| 3. Secured asset mix expanded to 56.8%, reducing earnings volatility.            |
|                                                                                   |
| NEGATIVE SURPRISES:                                                               |
| 1. Non-interest income fell 16.8% YoY, dragged down by lower treasury gains.     |
| 2. Cost-to-income ratio climbed to 61.5% due to investments and operating costs.  |
| 3. CASA ratio remained constrained at 29.4%.                                      |
+-----------------------------------------------------------------------------------+
6. Financial Statement Analysis
Income Statement Breakdown
Bandhan Bank’s Total Interest Income rose 2.8% YoY to ₹56.3 billion in Q1 FY27. Interest expenses remained stable at ₹27.1 billion (down 0.3% YoY). As a result, Net Interest Income (NII) expanded by 5.9% YoY to ₹29.2 billion.
Non-interest income fell 16.8% YoY to ₹6.0 billion. However, this drop was largely due to a base effect: Q1 FY26 included ~₹2.5 billion in treasury gains. Excluding treasury sales, underlying fee and commission income grew ~22% YoY, supported by processing fees (₹1,927 million) and third-party distribution income (₹1,235 million, up 47.3% YoY).
Operating expenses rose 19.4% YoY to ₹21.7 billion, raising the Cost-to-Income ratio to 61.5%. This growth was driven by IT transformation costs, branch network expansion, and workforce investments (74,744 employees as of June 2026).
               INCOME STATEMENT COMPARISON (Q1 FY26 VS Q1 FY27)

  ₹ Bn
   60 +-------------------------------------------------------------------+
      |  54.8   56.3                                                      |
   50 |  +---+  +---+                                                     |
      |  |   |  |   |                                                     |
   40 |  |   |  |   |                                                     |
      |  |   |  |   |   27.6  29.2   18.1  21.7   16.7  13.6              |
   30 |  |   |  |   |   +---+ +---+  +---+ +---+  +---+ +---+   11.5  6.8 |
      |  |   |  |   |   |   | |   |  |   | |   |  |   | |   |   +---+ +---+ |
   20 |  |   |  |   |   |   | |   |  |   | |   |  |   | |   |   |   | |   | |
      |  |   |  |   |   |   | |   |  |   | |   |  |   | |   |   |   | |   | |
   10 |  |   |  |   |   |   | |   |  |   | |   |  |   | |   |   |   | |   | |
      +--+---+--+---+---+---+-+---+--+---+-+---+--+---+-+---+---+---+-+---+
        Interest Income      NII        Opex       PPOP      Provisions

        ■ Q1 FY26   ■ Q1 FY27
Balance Sheet Strength & Capital Structure
Bandhan Bank’s total balance sheet expanded 10.6% YoY to ₹2,094.1 billion. Total advances reached ₹1,516.8 billion (up 18.0% YoY on balance sheet terms).
Total deposits grew 6.6% YoY to ₹1,648.9 billion. Shareholders’ funds increased to ₹261.7 billion, supporting a Capital Adequacy Ratio (CRAR) of 18.2% (Tier-I CET-1 capital at 17.5%).
+-----------------------------------------------------------------------------------+
|                        CAPITAL ADEQUACY & BALANCE SHEET RATIOS                    |
+-------------------------------------+---------------------------------------------+
| Capital Adequacy Ratio (CRAR)       | 18.2% (Regulatory Minimum: 11.5%)           |
| Common Equity Tier-1 (CET-1)        | 17.5%                                       |
| Leverage Ratio                      | ~8.0%                                       |
| Return on Assets (ROA Annualized)   | 1.0% (Up from 0.8% in Q1 FY26)              |
| Return on Equity (ROE Annualized)   | 7.7% (Up from 5.9% in Q1 FY26)              |
+-------------------------------------+---------------------------------------------+
7. Banking Analysis (Deep Dive)
Portfolio Rebalancing: Secured vs. Unsecured Evolution
Historically, Bandhan Bank relied heavily on high-margin, uncollateralized microfinance group loans. The bank is actively shifting toward a more balanced asset structure.
           SECURED VS UNSECURED LOAN MIX TRAJECTORY (Q1 FY25 - Q1 FY27)

  100% +-------------------------------------------------------------------+
       |  57.1%  53.0%  51.1%  49.5%  47.9%  45.1%  43.3%  43.8%  43.2%    | Unsecured %
   80% |  +---+  +---+  +---+  +---+  +---+  +---+  +---+  +---+  +---+    |
       |  |   |  |   |  |   |  |   |  |   |  |   |  |   |  |   |  |   |    |
   60% |  +---+  +---+  +---+  +---+  +---+  +---+  +---+  +---+  +---+    |
       |  |   |  |   |  |   |  |   |  |   |  |   |  |   |  |   |  |   |    |
   40% |  |42.9% |47.0% |48.9% |50.5% |52.1% |54.9% |56.7% |56.2% |56.8%|    | Secured %
       |  +---+  +---+  +---+  +---+  +---+  +---+  +---+  +---+  +---+    |
    0% +--+-----+------+------+------+------+------+------+------+-----+---+
          Q1FY25 Q2FY25 Q3FY25 Q4FY25 Q1FY26 Q2FY26 Q3FY26 Q4FY26 Q1FY27
In Q1 FY25, secured assets made up 42.9% of total advances. By Q1 FY27, secured assets expanded to 56.8%. This shift reduces credit loss volatility during rural economic downturns, though it comes with lower yields.
Deposit Dynamics & Granularity
Total deposits stood at ₹1,648.9 billion. The bank has improved its deposit quality, raising the share of Retail Deposits to 74.0% (₹1,219.6 billion).
                     DEPOSIT BREAKDOWN (₹1,648.9 BILLION)
                                       |
    +------------------+---------------+------------------+------------------+
    |                  |                                  |                  |
 Current Account    Savings Account                 Retail Term        Bulk Deposits
     (CA)               (SA)                          Deposits           & Others
   ₹88.9 Bn          ₹395.9 Bn                        ₹734.8 Bn          ₹429.3 Bn
    (5.4%)            (24.0%)                          (44.6%)            (26.0%)
CASA Ratio: Stood at 29.4% (CASA deposits: ₹484.8 billion).
Average SA Balance: Average savings account balances in General Banking rose to ₹41,600 (up from ₹39,700 in Q1 FY26). Microfinance (EEB) savings balances averaged ₹1,400 per account.
Asset Quality, Slippages, and Provision Coverage
Asset quality improved across the bank’s key metrics:
               GROSS & NET NPA TREND (Q1 FY25 TO Q1 FY27)

   6.0% +-------------------------------------------------------------------+
        |  5.0%   5.0%                                                      |
   5.0% |  +---+  +---+                                                     |
        |  |   |  |   |   3.3%   3.3%   3.1%                            |
   4.0% |  |   |  |   |   +---+  +---+  +---+                           |
        |  |   |  |   |   |   |  |   |  |   |                           |
   3.0% |  |   |  |   |   |   |  |   |  |   |                           |
        |  |   |  |   |   |   |  |   |  |   |                           |
   2.0% |  |1.4%  |1.4%   |1.0%  |1.0%  |0.9%                           |
        |  +---+  +---+   +---+  +---+  +---+                           |
   0.0% +--+------+-------+------+------+-----+-----------------------------+
          Q1FY26 Q2FY26  Q3FY26 Q4FY26 Q1FY27

          ■ Gross NPA %   ■ Net NPA %
+-----------------------------------------------------------------------------------+
|                        NPA MOVEMENT ANALYSIS (Q1 FY27)                            |
+----------------------------------------------------+------------------------------+
| Opening Gross NPA (as of April 1, 2026)            | ₹50.2 Billion                |
| Fresh Slippages during Q1 FY27                     | ₹10.8 Billion                |
| Less: Recoveries & Upgrades                        | ₹4.5 Billion                 |
| Less: Technical Write-Offs                         | ₹6.0 Billion                 |
| Closing Gross NPA (as of June 30, 2026)            | ₹48.8 Billion                |
+----------------------------------------------------+------------------------------+
| Provision Coverage Ratio (PCR)                     | 71.1%                        |
| PCR Including Security Receipts (SRs)              | 74.3%                        |
| PCR Including Technical Write-Offs                 | 85.9%                        |
+----------------------------------------------------+------------------------------+
Fresh slippages dropped to ₹10.8 billion in Q1 FY27 (compared to ₹15.5 billion in Q1 FY26). Combined with ₹4.5 billion in recoveries and upgrades, overall Gross NPA declined to ₹48.8 billion (3.1%).
Stress Pool & EEB Collection Efficiency
The stress pool in the EEB micro-lending segment showed signs of stabilizing:
+-----------------------------------------------------------------------------------+
|                     EEB STRESS POOL MOVEMENT (₹ IN BILLIONS)                      |
+----------------------+-----------+-----------+-----------+------------------------+
| Asset Category       | Q1 FY26   | Q4 FY26   | Q1 FY27   | YoY Change (%)         |
+----------------------+-----------+-----------+-----------+------------------------+
| Special Mention 1    | ₹5.3 Bn   | ₹4.4 Bn   | ₹4.6 Bn   | -13.2%                 |
| Special Mention 2    | ₹4.8 Bn   | ₹4.2 Bn   | ₹4.2 Bn   | -12.5%                 |
| Gross NPA (EEB)      | ₹47.6 Bn  | ₹31.1 Bn  | ₹31.0 Bn  | -34.9%                 |
| Total Stress Pool    | ₹57.7 Bn  | ₹39.7 Bn  | ₹39.8 Bn  | -31.0%                 |
+----------------------+-----------+-----------+-----------+------------------------+
Collection efficiency in the EEB segment remained stable:
West Bengal Collection Efficiency: 98.2% (excluding arrears).
Assam Collection Efficiency: 99.3% (excluding arrears).
Rest of India Collection Efficiency: 98.5% (excluding arrears).
Full-Paying Customers: Expanded to 97.3% of active borrowers. Non-paying customers accounted for just 0.9%.
+-----------------------------------------------------------------------------------+
|                       BORROWER AFFORDABILITY & OVER-LEVERAGE                      |
+-----------------------------------------------------------------------------------+
| * 60.8% of borrowers take loans exclusively from Bandhan Bank.                    |
| * 23.8% of borrowers have loans from Bandhan + 1 other lender.                    |
| * 11.3% of borrowers have loans from Bandhan + 2 other lenders.                   |
| * Only 0.2% of borrowers have loans from Bandhan + >4 other lenders.             |
|                                                                                   |
| Takeaway: 95.9% of borrowers carry loans with at most 3 lenders, reducing         |
| over-indebtedness risk in micro-lending.                                          |
+-----------------------------------------------------------------------------------+
8. Management Commentary
Leadership Direction
Under Managing Director & CEO Partha Pratim Sengupta, Bandhan Bank is executing a clear strategic agenda: balancing the loan portfolio, expanding retail deposits, and strengthening credit processes.
+-----------------------------------------------------------------------------------+
|                        MANAGEMENT STRATEGIC PRIORITIES                            |
+-----------------------------------------------------------------------------------+
|  1. ASSET DIVERSIFICATION:  Increase secured loans toward 60% of total advances. |
|  2. LIABILITY STABILITY:    Target >75% retail deposit contribution.              |
|  3. CREDIT DISCIPLINE:      Maintain annualized credit costs below 2.0%.            |
|  4. OPERATIONAL EFFICIENCY: Digitally transform operations to lower cost-to-income.|
+-----------------------------------------------------------------------------------+
Executive Quotes & Earnings Call Key Insights
Management Guidance Note: The management noted that credit costs have stabilized in the 1.8%–2.0% range, supported by better collection processes and lower fresh slippages. While margin compression remains a challenge across the industry, the bank expects NIMs to stabilize above 6.0%, supported by lower cost-of-funds and a higher share of low-cost retail deposits.
+-----------------------------------------------------------------------------------+
|                   VERIFIED FACTS VS. MANAGEMENT GUIDANCE                          |
+---------------------------------------------------+-------------------------------+
| VERIFIED HISTORICAL FACT                          | MANAGEMENT FUTURE GUIDANCE    |
+---------------------------------------------------+-------------------------------+
| Q1 FY27 Net Profit reached ₹5.0 billion.| Targeting double-digit loan   |
|                                                   | growth for FY27.              |
| Gross NPA improved to 3.1%.             | Aiming to maintain credit     |
|                                                   | cost under 2.0%.   |
| Secured loan mix reached 56.8%.         | Seeking to increase secured   |
|                                                   | mix to ~60%.                  |
| Cost-to-Income rose to 61.5%.       | Expecting tech investments to |
|                                                   | drive long-term efficiency.   |
+---------------------------------------------------+-------------------------------+
9. Market Reaction & Technical Overview
Note: Market price data and technical indicators reflect market analysis and trading data surrounding earnings disclosures. They represent analytical observations and do not constitute personal financial advice.
+-----------------------------------------------------------------------------------+
|                          TRADING & TECHNICAL SNAPSHOT                             |
+-----------------------------------+-----------------------------------------------+
| 52-Week High / Low                | ₹272.00 / ₹168.50                             |
| Pre-Earnings Share Price          | ₹202.45                                       |
| Post-Earnings Price Action        | Range-bound with positive bias (+1.8% to 2.5%)|
| Volume Analysis                   | 1.8x average 20-day trading volume            |
| Delivery Percentage               | ~48.5% (Indicating institutional accumulation)|
+-----------------------------------+-----------------------------------------------+
| Key Technical Support Levels      | S1: ₹194.00 | S2: ₹182.00                     |
| Key Technical Resistance Levels   | R1: ₹218.00 | R2: ₹235.00                     |
| Moving Average Indicators         | Trading near 50-DMA (₹198.50);                |
|                                   | Below 200-DMA (₹212.10)                       |
+-----------------------------------+-----------------------------------------------+
Market Sentiment Analysis
The market reacted to two main drivers:
Positive Driver: Bottom-line net profit exceeded consensus estimates due to lower provisioning needs and falling credit costs.
Cautious Driver: Pre-provision operating profit (PPOP) remained weak, constrained by flat net revenues and rising operating expenses.
10. Peer Comparison
To evaluate Bandhan Bank’s valuation and operating performance, we compare its metrics against key private banking and microfinance-focused peers:
| Metric / Parameter | Bandhan Bank | IndusInd Bank | IDFC FIRST Bank | AU Small Finance Bank | Ujjivan SFB |
| Gross Advances (₹ Bn) | 1,555.6 | 3,480.0 | 2,050.0 | 890.0 | 298.0 |
| Net Interest Margin (%) | 6.2% | 4.2% | 6.1% | 5.4% | 9.1% |
| Gross NPA (%) | 3.1% | 1.9% | 1.9% | 1.8% | 2.3% |
| Net NPA (%) | 0.9% | 0.6% | 0.6% | 0.6% | 0.5% |
| Provision Coverage (%) | 71.1% | 71.5% | 68.5% | 67.0% | 78.0% |
| Cost-to-Income Ratio (%) | 61.5% | 48.2% | 71.5% | 63.8% | 56.5% |
| Return on Assets (ROA) | 1.0% | 1.7% | 1.1% | 1.5% | 2.1% |
| Return on Equity (ROE) | 7.7% | 14.2% | 10.2% | 13.8% | 18.2% |
| Price-to-Book (P/B) | ~1.2x | ~1.8x | ~1.6x | ~3.2x | ~1.5x |
+-----------------------------------------------------------------------------------+
|                            PEER VALUATION TAKEAWAYS                               |
+-----------------------------------------------------------------------------------+
| * Bandhan Bank trades at a valuation discount relative to high-growth private      |
|   banks and small finance banks, largely due to historical MFI asset quality      |
|   volatility and geographical concentration in Eastern India.           |
| * However, its 6.2% NIM remains higher than most traditional private banks         |
|  , offering earnings upside if credit costs stay subdued.   |
+-----------------------------------------------------------------------------------+
11. Analyst View & Consensus
Institutional brokerages express a cautiously optimistic view on Bandhan Bank following its Q1 FY27 disclosures.
                  INSTITUTIONAL BROKERAGE CONSENSUS RATING

                    [ BUY: 45% ]   [ HOLD: 35% ]   [ SELL: 20% ]

     Consensus Target Price Range: ₹220.00 to ₹255.00 (Current: ~₹202.45)
+-----------------------------------------------------------------------------------+
|                        BULL CASE VS. BEAR CASE THESIS                             |
+-----------------------------------------------------------------------------------+
| THE BULL CASE THESIS:                                                             |
| 1. Credit cost normalization (1.8%) will continue to support net profit.|
| 2. Rebalancing toward secured assets (56.8%) reduces long-term tail risk.|
| 3. Cheap valuations (~1.2x P/BV) provide downside protection.                     |
| 4. Retail deposit growth (74.0%) strengthens funding stability.     |
|                                                                                   |
| THE BEAR CASE THESIS:                                                             |
| 1. Sluggish PPOP growth (-18.6% YoY) points to top-line income pressure.|
| 2. Cost-to-income ratio (61.5%) remains elevated, dragging on operational leverage|
|   .                                                                 |
| 3. Microfinance (EEB) exposure (~34%) leaves the bank vulnerable to rural economic|
|    shocks or regional monsoon disruptions.                            |
+-----------------------------------------------------------------------------------+
12. SWOT Analysis
+-----------------------------------------------------------------------------------+
|                                  SWOT ANALYSIS                                    |
+-----------------------------------------------------------------------------------+
| STRENGTHS                                  | WEAKNESSES                           |
| * High net interest margins (6.2%)         | * Declining operating profit (-18.6%) |
|   compared to peer banks.        |  .                     |
| * Expanding secured loan mix (56.8%)       | * High cost-to-income ratio (61.5%)  |
|  .                               |  .                     |
| * Strong presence in Eastern and           | * Concentration in Eastern/North-    |
|   North-Eastern India.           |   Eastern India.           |
| * Granular retail deposit base (74.0%)     | * Constrained CASA ratio (29.4%)     |
|  .                           |  .                     |
+--------------------------------------------+--------------------------------------+
| OPPORTUNITIES                              | THREATS                              |
| * Cross-selling retail products to 31.8M   | * Regional political or environmental|
|   customers.                     |   shocks in core markets.  |
| * Growth in affordable housing (GRUH book) | * Increasing competition in micro-   |
|  .                           |   lending from SFBs and NBFCs.       |
| * Digital onboarding efficiency gains      | * Prolonged elevated cost-of-funds   |
|   (92% digital savings accounts).|   impacting NIMs.         |
+-----------------------------------------------------------------------------------+
13. Strategic Risk Matrix
+-----------------------------------------------------------------------------------+
|                          BANKING RISK ASSESSMENT MATRIX                           |
+-------------------+-----------------+---------------------------------------------+
| Risk Category     | Severity Level  | Analytical Assessment & Mitigation Strategy |
+-------------------+-----------------+---------------------------------------------+
| Credit Risk       | Moderate        | MFI risk is declining as secured assets    |
|                   |                 | expand to 56.8% of the loan book. |
| Margin Pressure   | Medium-High     | Higher funding costs press NIMs; mitigated  |
|                   |                 | by expanding retail deposits. |
| Operating Risk    | Moderate        | Opex increased 19.4% due to IT investments  |
|                   |                 |; expected to yield gains over time.|
| Geographic Risk   | High            | West Bengal & Assam account for ~42% of     |
|                   |                 | loans; geographic diversification|
|                   |                 | remains an ongoing priority.  |
+-------------------+-----------------+---------------------------------------------+
14. Future Outlook
Key Strategic Growth Drivers
Asset Mix Target: Bandhan Bank is working toward a 60:40 secured-to-unsecured loan mix over the coming quarters.
Branch Efficiency: The bank plans to increase productivity across its 1,988 branches and 4,400 EEB units, focusing on cross-selling retail loans, gold loans, and fee products.
Digital Stack Upgrades: Modernizing digital platforms—including 92% digital savings account onboarding and updated mutual fund investment interfaces—aims to lower customer acquisition costs.
               THE DIVERSIFICATION PATHWAY (FY25 TO TARGET FY28)

    FY25 Actual        Q1 FY27 Actual       Target FY28
   +-------------+    +-------------+     +-------------+
   | Unsecured   |    | Unsecured   |     | Unsecured   |
   |   57.1%     |    |   43.2%     |     |  ~35.0%     |
   +-------------+    +-------------+     +-------------+
   | Secured     |    | Secured     |     | Secured     |
   |   42.9%     |    |   56.8%     |     |  ~65.0%     |
   +-------------+    +-------------+     +-------------+
15. Investment Perspective: Should You Buy, Hold, or Sell?
Disclaimer: The analysis below presents a neutral equity research framework to help investors make informed decisions. It does not constitute personalized financial advice.
+-----------------------------------------------------------------------------------+
|                          INVESTOR STRATEGY MATRIX                                 |
+-----------------------------------------------------------------------------------+
| FOR LONG-TERM INVESTORS (3–5 Year Horizon)                                       |
| * RATIONALE: The structural shift toward secured assets, normalizing  |
|   credit costs, and a solid retail deposit base offer  |
|   earnings stability. Discounted valuations (~1.2x P/B) provide a margin of safety.|
| * SUGGESTED APPROACH: Accumulate gradually on dips.                              |
+-----------------------------------------------------------------------------------+
| FOR SWING & POSITIONAL TRADERS                                                    |
| * RATIONALE: The stock is range-bound between ₹190 and ₹220. Pre-provision profit |
|   weakness may cap immediate upside momentum.                        |
| * SUGGESTED APPROACH: Trade the range with disciplined stop-loss risk management.  |
+-----------------------------------------------------------------------------------+
| FOR CONSERVATIVE / INCOME INVESTORS                                               |
| * RATIONALE: Near-term operating profit pressure and microfinance    |
|   exposure mean higher volatility than large-cap private banks.       |
| * SUGGESTED APPROACH: Maintain a smaller position size until PPOP growth resumes. |
+-----------------------------------------------------------------------------------+
16. Editorial Opinion
Editorial Perspective: Bandhan Bank’s Q1 FY27 earnings highlight a bank mid-way through a multi-year transition. A 34.9% jump in net profit makes for a strong headline, but investors should look closer at the operational drivers.
Bottom-line profit was largely driven by a 40.5% drop in credit provisions. Meanwhile, Pre-Provision Operating Profit fell 18.6%, showing that underlying top-line growth remains constrained by margin compression and higher investments.
However, management deserves credit for rebalancing the loan book. Shifting from a high-risk microfinance focus to a 56.8% secured asset mix lowers overall portfolio risk. The bank is evolving into a more stable universal bank. While this transition limits the outsized margins of microfinance, it creates a more resilient business model over time.
17. Conclusion & Investor Checklist
Bandhan Bank’s Q1 FY27 results show progress in its ongoing transition. Lower credit costs and better asset quality supported a 34.9% net profit surge. At the same time, flat operating revenues and higher operating expenses highlight the work needed to rebuild operating leverage.
+-----------------------------------------------------------------------------------+
|                  QUARTERLY MONITORING CHECKLIST FOR INVESTORS                     |
+-----------------------------------------------------------------------------------+
| [ ] PPOP Recovery: Watch for Pre-Provision Operating Profit to rebound YoY.       |
| [ ] Credit Cost Discipline: Ensure annualized credit costs remain under 2.0%.     |
| [ ] Secured Book Trajectory: Track progress toward a 60% secured loan mix.        |
| [ ] CASA Ratio Acceleration: Monitor CASA growth beyond the current 29.4% level.  |
| [ ] Operating Efficiency: Look for the Cost-to-Income ratio to decline below 55%.|
+-----------------------------------------------------------------------------------+
Financial Glossary
Net Interest Income (NII): The difference between interest earned on loans/investments and interest paid on deposits/borrowings.
Net Interest Margin (NIM): Net interest income expressed as an annualized percentage of average total interest-earning assets.
Gross NPA: Total non-performing loans before deducting provisions set aside for bad loans.
Net NPA: Gross NPA minus specific provision cover, showing real balance sheet risk.
Provision Coverage Ratio (PCR): The percentage of bad loans backed by provisions set aside by the bank.
Credit Cost: Total provisions for credit losses expressed as an annualized percentage of average total loans.
Cost-to-Income Ratio: Total operating expenses divided by total net operating revenue, measuring operating efficiency.
CASA Ratio: Current Account and Savings Account deposits as a percentage of total deposits; a higher ratio lowers total funding costs.
Pre-Provision Operating Profit (PPOP): Operating profit generated before setting aside credit provisions and contingency reserves.