1. Introduction
In an environment where retail housing finance often faces elevated borrowing costs and fierce competition from commercial banks, retail investors frequently ask: Can a specialized affordable housing financier maintain hyper-growth while keeping asset quality intact?
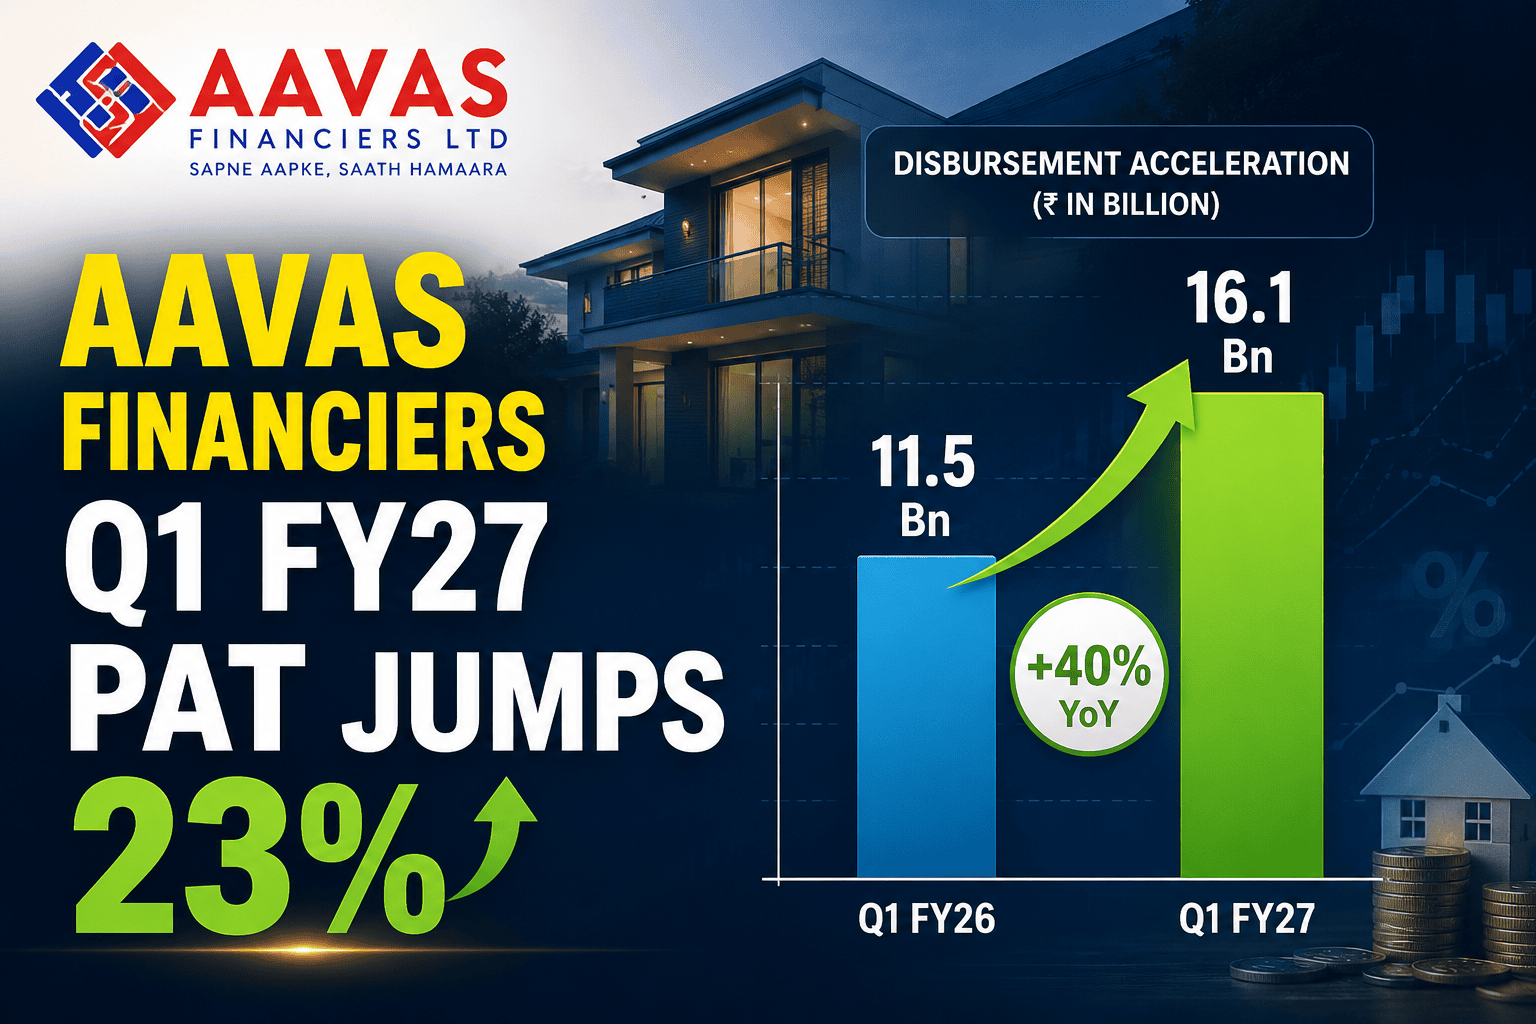
AAVAS Financiers Limited provided a definitive answer on July 21, 2026, releasing its financial results for the first quarter of Financial Year 2026–27 (Q1 FY27). The Jaipur-headquartered Housing Finance Company (HFC) delivered an impressive operational performance: loan disbursements surged 41% year-on-year (YoY) to ₹16,139 million, while Net Profit (PAT) expanded 23% YoY to ₹1,713 million.
+-----------------------------------------------------------------------------------+
|                            Q1 FY27 FINANCIAL SCORECARD                            |
+------------------------------------+----------------------------------------------+
| Net Profit (PAT)                   | ₹1,713 Million (+23.0% YoY)                   |
| Disbursements                      | ₹16,139 Million (+41.0% YoY)                  |
| Assets Under Management (AUM)      | ₹239.3 Billion (+15.4% YoY)                  |
| Net Interest Margin (NIM)          | 7.70% (Expanded +22 bps YoY)                 |
| Cost-to-Income Ratio               | 43.7% (Improved by 254 bps YoY)              |
| Gross Stage 3 (GNPA)               | 1.11% (Improved by 11 bps YoY)               |
+------------------------------------+----------------------------------------------+
What made this quarter stand out was not just the top-line disbursement acceleration, but a sharp 254-bps YoY improvement in the Cost-to-Income ratio to 43.7% and an expansion of NIMs to 7.70%. By combining AI-led underwriting, automated digital sourcing, and tight risk controls, AAVAS demonstrated early results from its execution philosophy: “People. Performance. Perseverance.”
📌 Key Takeaway: AAVAS started FY27 with balanced growth—accelerating loan disbursements (+41% YoY), maintaining net spreads above 5.0%, reducing operating expenses relative to assets, and keeping Gross Stage 3 NPAs near historic lows at 1.11%.
2. Key Highlights at a Glance
The summary table below highlights AAVAS Financiers’ core operational and financial performance for Q1 FY27 compared against sequential (Q4 FY26) and corresponding year-ago (Q1 FY26) reporting periods:
| Financial / Operational Metric | Q1 FY26 | Q4 FY26 | Q1 FY27 | YoY Change (%) / (bps) | QoQ Change (%) / (bps) | Primary Sourced Reference |
| Assets Under Management (AUM) | ₹207,397 Mn | ₹234,517 Mn | ₹239,306 Mn | +15.4% | +2.0% | Official Investor Presentation |
| Disbursements | ₹11,454 Mn | ₹23,481 Mn | ₹16,139 Mn | +40.9% | -31.3% | Official Investor Presentation |
| Interest Income on Loans | ₹5,598.4 Mn | ₹6,120.6 Mn | ₹6,335.1 Mn | +13.2% | +3.5% | Official Investor Presentation |
| Interest Expenses | ₹2,736.0 Mn | ₹2,763.0 Mn | ₹2,952.1 Mn | +7.9% | +6.8% | Official Investor Presentation |
| Net Interest Income (NII/NIM) | ₹3,543.4 Mn | ₹4,385.4 Mn | ₹4,138.9 Mn | +16.8% | -5.6% | Official Investor Presentation |
| Operating Expenses | ₹1,639.5 Mn | ₹2,011.2 Mn | ₹1,809.9 Mn | +10.4% | -10.0% | Official Investor Presentation |
| Credit Costs | ₹112.6 Mn | ₹66.5 Mn | ₹128.0 Mn | +13.7% | +92.5% | Official Investor Presentation |
| Profit Before Tax (PBT) | ₹1,791.3 Mn | ₹2,307.6 Mn | ₹2,201.0 Mn | +22.9% | -4.6% | Official Investor Presentation |
| Profit After Tax (PAT) | ₹1,392.3 Mn | ₹1,816.7 Mn | ₹1,712.7 Mn | +23.0% | -5.7% | Official Investor Presentation |
| Diluted EPS (Non-Annualized) | ₹17.5 | ₹22.8 | ₹21.5 | +22.9% | -5.7% | Official Investor Presentation |
| Net Interest Margin (NIM) | 7.48% | 8.45% | 7.70% | +22 bps | -75 bps | Official Investor Presentation |
| Spread | 5.11% | 5.20% | 5.06% | -5 bps | -14 bps | Official Investor Presentation |
| Yield on Assets | 13.13% | 12.82% | 12.70% | -43 bps | -12 bps | Official Investor Presentation |
| Cost of Borrowing (CoB) | 8.02% | 7.62% | 7.64% | -38 bps | +2 bps | Official Investor Presentation |
| Cost-to-Income Ratio | 46.3% | 45.9% | 43.7% | -254 bps | -220 bps | Official Investor Presentation |
| Opex-to-Assets Ratio | 3.46% | 3.88% | 3.37% | -9 bps | -51 bps | Official Investor Presentation |
| Gross Stage 3 (GNPA) | 1.22% | 1.05% | 1.11% | -11 bps | +6 bps | Official Investor Presentation |
| Net Stage 3 (NNPA) | 0.84% | 0.67% | 0.71% | -13 bps | +4 bps | Official Investor Presentation |
| 1+ Days Past Due (1+ DPD) | 4.15% | 3.12% | 3.76% | -39 bps | +64 bps | Official Investor Presentation |
| Capital Adequacy (CRAR) | 51.4% | 44.6% | 44.7% | -670 bps | +10 bps | Official Investor Presentation |
| Return on Assets (ROA) | 2.94% | 3.50% | 3.19% | +25 bps | -31 bps | Official Investor Presentation |
| Return on Equity (ROE) | 12.56% | 14.67% | 13.34% | +78 bps | -133 bps | Official Investor Presentation |
3. Company Snapshot & Business Model
AAVAS Financiers Limited (formerly known as Au Housing Finance Limited) is a specialized housing finance company that provides affordable home loans and property loans to low- and middle-income families across India.
+-----------------------------------------------------------------------------------+
|                        AAVAS FINANCIERS DISTRIBUTION FOOTPRINT                    |
+-----------------------------------------------------------------------------------+
|  Active Customer Base: 275,869 Accounts Across 415,000+ Families Served           |
|                                                                                   |
|  [Branch Count: 440]   +   [Towns Covered: 2,600+]   +   [States/UTs: 15]        |
|                                                                                   |
|  Footprint Strategy:                                                              |
|  * Tier 3+ Center Concentration: >80% of total branches                           |
|  * Geographic Core: Rajasthan (25%), Gujarat (13%), MP (12%), UP (12%), MH (11%)  |
|  * Contiguous Branch Expansion: Deepening footprint in adjacent geographies       |
+-----------------------------------------------------------------------------------+
Targeted Borrower Profile & Niche Underwriting
AAVAS addresses an underserved market segment in suburban and rural India:
Target Income Group: 54% of AUM caters to Economically Weaker Sections (EWS) and Low Income Groups (LIG), with an average customer household income of ~₹0.53 million (~₹44,000/month).
Occupation Breakdown: 62% self-employed borrowers (small shopkeepers, traders, local service providers) vs. 38% salaried individuals.
Small Ticket Focus: 83% of total loan accounts have ticket sizes below ₹1.5 million (₹15 Lakhs), with an overall Average Ticket Size (ATS) on AUM of ₹1.02 million.
Conservative Collateralization: Average Loan-to-Value (LTV) at origination stands at 55%, providing a substantial equity buffer against borrower default.
                     AAVAS AUM SEGMENT BREAKDOWN (₹239.3 BN)
                                        |
     +----------------------------------+----------------------------------+
     |                                  |                                  |
Home Loans (HL)              Micro, Small & Medium (MSME)       Loan Against Property (LAP)
  ₹153.2 Bn                              ₹55.0 Bn                            ₹31.1 Bn
   (64%)                                  (23%)                               (13%)
4. Q1 FY27 Financial Results Breakdown
Income Statement Analysis
                 QUARTERLY NET PROFIT (PAT) TREND (₹ MILLION)

  ₹ Mn
  2,000 +-------------------------------------------------------------------+
        |                                                            1,817  |
  1,750 |                                                  1,713   +---+    |
        |                                        1,607     +---+   |   |    |
  1,500 |                                +---+   |   |     |   |   |   |    |
        |                      1,460     |   |   |   |     |   |   |   |    |
  1,250 |            1,392     +---+     |   |   |   |     |   |   |   |    |
        |            +---+     |   |     |   |   |   |     |   |   |   |    |
  1,000 +------------+---+-----+---+-----+---+---+---+-----+---+---+---+----+
                   Q1 FY26    Q2 FY26   Q3 FY26 Q4 FY26   Q1 FY27 Q4 FY26

                   ■ Consolidated PAT (₹ Mn)
During Q1 FY27, AAVAS Financiers generated Interest Income on Loans of ₹6,335.1 million, marking a 13.2% YoY growth. Net Interest Income (including assignment income and non-interest operational fees) expanded by 16.8% YoY to ₹4,138.9 million.
Interest expenses rose 7.9% YoY to ₹2,952.1 million, demonstrating effective funding cost management.
               INCOME & EXPENSE BREAKDOWN (Q1 FY26 VS Q1 FY27)

  ₹ Mn
  7,000 +-------------------------------------------------------------------+
        |  5,598  6,335                                                     |
  6,000 |  +---+  +---+                                                     |
        |  |   |  |   |                                                     |
  5,000 |  |   |  |   |                                                     |
        |  |   |  |   |   3,543 4,139                                       |
  4,000 |  |   |  |   |   +---+ +---+   2,736 2,952   1,640 1,810             |
        |  |   |  |   |   |   | |   |   +---+ +---+   +---+ +---+   1,392 1,713
  3,000 |  |   |  |   |   |   | |   |   |   | |   |   |   | |   |   +---+ +---+
        |  |   |  |   |   |   | |   |   |   | |   |   |   | |   |   |   | |   |
  2,000 +--+---+--+---+---+---+-+---+---+---+-+---+---+---+-+---+---+---+-+---+
           Loan Interest      NII/NIM       Int Expense    Opex       PAT (Net)

           ■ Q1 FY26   ■ Q1 FY27
Operating expenses increased by 10.4% YoY to ₹1,809.9 million. Because operating revenues grew faster (+16.8%) than operating expenses (+10.4%), AAVAS benefited from positive operating leverage, leading Profit Before Tax (PBT) up by 22.9% YoY to ₹2,201.0 million.
5. Deep-Dive: Loan Book, AUM & Disbursement Dynamics
Disbursement Surge
Disbursements rebounded in Q1 FY27, reaching ₹16,139 million (+40.9% YoY). This acceleration was driven by an operational overhaul, improved sales force productivity, and faster credit decisioning.
           DISBURSEMENT & AUM TRAJECTORY (Q1 FY26 TO Q1 FY27)

  ₹ Bn
   250 +-------------------------------------------------------------------+
       |                                                 234.5   239.3     |  AUM (₹ Bn)
   200 |                               213.6   222.0     +---+   +---+     |
       |             207.4             +---+   +---+     |   |   |   |     |
   150 |             +---+             |   |   |   |     |   |   |   |     |
       |             |   |             |   |   |   |     |   |   |   |     |
   100 |             |   |             |   |   |   |     |   |   |   |     |
       |             |   |             |   |   |   |     |   |   |   |     |
    50 |   11.5      |   |   15.6      |   |17.2   |   23.5  | 16.1  |     |  Disbursements
       |  +---+      +---+  +---+      +---+---+   +---+---+ +---+---+     |  (₹ Bn)
     0 +--+---+------+---+--+---+------+---+---+---+---+---+-+---+---+-----+
         Q1 FY26            Q2 FY26        Q3 FY26     Q4 FY26   Q1 FY27
AAVAS’s focus on primary residential mortgages remained evident, with Home Loans expanding 38% YoY during the quarter.
+-----------------------------------------------------------------------------------+
|                     DISBURSEMENT MIX BY PRODUCT (Q1 FY27)                         |
+------------------------------------+----------------------------------------------+
| Product Category                   | Percentage Share (Disbursements)             |
+------------------------------------+----------------------------------------------+
| Home Loans (HL)                    | 56% (Average Ticket Size: ₹1.46 Million)     |
| MSME Loans                         | 32% (Average Ticket Size: ₹1.16 Million)     |
| Loan Against Property (LAP)        | 13% (Average Ticket Size: ₹1.01 Million)     |
+------------------------------------+----------------------------------------------+
| Borrowing Occupation Share         | 66% Self-Employed | 34% Salaried             |
+------------------------------------+----------------------------------------------+
6. Spread, Yields & Net Interest Margin (NIM) Analysis
A key strength for AAVAS is its ability to maintain healthy margins across interest rate cycles.
                SPREAD & YIELD DYNAMICS (Q1 FY26 TO Q1 FY27)

  14.0% +-------------------------------------------------------------------+
        |  13.13%   13.08%    13.02%    12.82%    12.70%                    | Yield on Loans
  12.0% |  +------+--+------+---+------+--+------+--+------+                |
        |                                                                   |
  10.0% |                                                                   |
        |   7.48%     8.04%     8.01%     8.45%     7.70%                   | NIM (%)
   8.0% |  +------+--+------+---+------+--+------+--+------+                |
        |   8.02%     7.85%     7.68%     7.62%     7.64%                   | Cost of Borrowing
   6.0% |  +------+--+------+---+------+--+------+--+------+                |
        |   5.11%     5.23%     5.34%     5.20%     5.06%                   | Spread (%)
   4.0% +--+------+--+------+---+------+--+------+--+------+----------------+
           Q1 FY26   Q2 FY26   Q3 FY26   Q4 FY26   Q1 FY27
+-----------------------------------------------------------------------------------+
|                        MARGIN & YIELD SUMMARY (Q1 FY27)                           |
+-------------------------------------+---------------------------------------------+
| Gross Yield on Loan Portfolio       | 12.70% (Reflects 10-bps PLR cut in June '26)|
| Average Cost of Borrowings (CoB)    | 7.64% (Consistently low vs. HFC peers)      |
| Net Interest Spread                 | 5.06% (Maintained above management target)  |
| Net Interest Margin (Annualized)    | 7.70% (Up 22 bps YoY from 7.48%)            |
+-------------------------------------+---------------------------------------------+
Yields moderated slightly to 12.70%, reflecting a cumulative 25-bps reduction in AAVAS’s Prime Lending Rate (PLR)—15 bps in March 2026 and 10 bps in June 2026. However, because the contractual cost of borrowings remained low at 7.64%, the net interest spread remained healthy at 5.06%.
7. Operational Efficiency & Tech-Led Transformation
AAVAS continues to invest in technology to improve operational scale and turnaround times:
               COST-TO-INCOME & OPEX-TO-ASSETS TRAJECTORY

   50.0% +-------------------------------------------------------------------+
         |  46.3%                                                            |
   45.0% |  +---+     43.7%     42.9%     45.9%     43.7%                    | Cost-to-Income %
         |  |   |     +---+     +---+     +---+     +---+                    |
   40.0% |  |   |     |   |     |   |     |   |     |   |                    |
         +--+---+-----+---+-----+---+-----+---+-----+---+--------------------+
    4.0% |  3.46%     3.51%     3.44%     3.88%     3.37%                    | Opex to Assets %
   3.0%  |  +---+     +---+     +---+     +---+     +---+                    |
         +--+---+-----+---+-----+---+-----+---+-----+---+--------------------+
           Q1 FY26   Q2 FY26   Q3 FY26   Q4 FY26   Q1 FY27
+-----------------------------------------------------------------------------------+
|                         AI & DIGITAL TRANSFORMATION DRIVERS                       |
+-----------------------------------------------------------------------------------+
|  1. LOGIN TO DECISION TAT: Reduced from 13 days (peak) to 6 days in Q1 FY27.     |
|  2. AI-BASED UNDERWRITING: 100% of applications scored via Business Rule Engine.  |
|  3. AUTOMATED VERIFICATION: First Time Right (FTR) document submission at 47.8%.  |
|  4. GEN AI VOICE BOT: Handles collection calls in 5 languages (English, Hindi,   |
|     Gujarati, Marathi, Kannada); resolved ~15,000 calls without human agents.     |
|  5. PAPERLESS WORKFLOWS: >80% adoption of digital e-signing and electronic docs.  |
+-----------------------------------------------------------------------------------+
8. Asset Quality & Risk Architecture
Asset quality remained strong, supported by an in-house underwriting model where legal, technical, credit, and risk control unit (RCU) assessments are conducted internally.
                 STAGE 3 NPAs & 1+ DPD MOVEMENTS (% OF AUM)

   5.0% +-------------------------------------------------------------------+
        |  4.15%                                                            |
   4.0% |  +---+      3.99%     3.80%     3.12%     3.76%                   | 1+ DPD (%)
        |  |   |      +---+     +---+     +---+     +---+                   |
   3.0% |  |   |      |   |     |   |     |   |     |   |                   |
        +--+---+------+---+-----+---+-----+---+-----+---+-------------------+
   2.0% |  1.22%      1.11%     1.19%     1.05%     1.11%                   | Gross Stage 3
   1.0% |  0.84%      0.79%     0.68%     0.67%     0.71%                   | Net Stage 3
   0.0% +--+---+------+---+-----+---+-----+---+-----+---+-------------------+
           Q1 FY26   Q2 FY26   Q3 FY26   Q4 FY26   Q1 FY27
+-----------------------------------------------------------------------------------+
|                       EXPECTED CREDIT LOSS (ECL) PROVISIONS                       |
+---------------------+-----------------------+------------------+------------------+
| Loan Category       | Principal Outstanding | ECL Provision    | Provision Cover  |
+---------------------+-----------------------+------------------+------------------+
| Stage 1 (Standard)  | ₹183,929 Mn (97.45%)  | ₹369 Mn          | 0.20%            |
| Stage 2 (SMA 1&2)   | ₹2,717 Mn (1.44%)     | ₹265 Mn          | 9.76%            |
| Stage 3 (GNPA)      | ₹2,101 Mn (1.11%)     | ₹773 Mn          | 36.80%           |
+---------------------+-----------------------+------------------+------------------+
| Total Portfolio     | ₹188,747 Mn (100.0%)  | ₹1,407 Mn        | 0.75%            |
+---------------------+-----------------------+------------------+------------------+
Lifetime cumulative credit write-offs stand at 12 bps (0.12%) against cumulative lifetime disbursements of ₹425 billion.
9. Balance Sheet Strength & Liability Management
AAVAS maintains a well-diversified funding structure:
                       BORROWINGS MIX BY SOURCE (₹207.1 BN)
                                         |
     +-------------------+---------------+-------------------+-------------------+
     |                   |                                   |                   |
 Term Loans           Direct          NHB Refinance       Non-Convertible     Commercial Paper
 (Banks)            Assignment            Facility          Debentures          & Bank CC
 ₹111.8 Bn           ₹55.9 Bn             ₹20.7 Bn           ₹18.6 Bn            ₹2.1 Bn
   (54%)              (27%)                (10%)               (9%)                (1%)
+-----------------------------------------------------------------------------------+
|                        LIQUIDITY & CREDIT RATING SUMMARY                          |
+-------------------------------------+---------------------------------------------+
| Cash & Liquid Investments           | ₹17,820 Million                             |
| Documented Un-availed Bank Lines    | ₹4,850 Million                              |
| Total Immediate Liquidity Buffer    | ₹23,680 Million                             |
| Long-Term Credit Ratings            | CARE AA (Stable) | ICRA AA (Stable)        |
| Short-Term Credit Rating            | ICRA A1+ (Highest safety grade)             |
+-------------------------------------+---------------------------------------------+
Asset-Liability Matching (ALM)
The company maintains positive cumulative cash inflows across all time buckets. Average borrowing maturity stands at 130 months, comfortably exceeding loan assets’ behavioural duration. Additionally, 71% of loan assets are floating-rate, matching the 84% floating-rate liability structure.
10. Financial Ratio Analysis & ROE Tree
DuPont ROE Analysis Trend
The ROE Tree below illustrates the drivers of Return on Equity (calculations based on Average Total Assets):
| Metric (% of Avg Total Assets) | FY22 | FY23 | FY24 | FY25 | FY26 | Q1 FY27 |
| Interest Income | 11.46% | 11.53% | 11.56% | 11.62% | 11.75% | 11.80% |
| Interest Expense | (4.84%) | (4.90%) | (5.59%) | (5.78%) | (5.55%) | (5.50%) |
| Net Interest Income (NII) | 6.62% | 6.63% | 5.98% | 5.84% | 6.21% | 6.30% |
| Fee & Other Income | 1.17% | 1.32% | 1.65% | 1.54% | 1.29% | 1.10% |
| Direct Assignment Gain | 0.44% | 0.33% | 0.29% | 0.26% | 0.43% | 0.30% |
| Net Total Income (NIM) | 8.23% | 8.28% | 7.91% | 7.64% | 7.93% | 7.70% |
| Operating Expenses | (3.45%) | (3.69%) | (3.58%) | (3.32%) | (3.54%) | (3.37%) |
| Pre-Provision Profit (PPOP) | 4.78% | 4.60% | 4.34% | 4.32% | 4.39% | 4.33% |
| Credit Costs | (0.23%) | (0.10%) | (0.16%) | (0.15%) | (0.17%) | (0.24%) |
| Profit Before Tax (PBT) | 4.55% | 4.49% | 4.17% | 4.17% | 4.22% | 4.09% |
| Tax Expenses | (0.98%) | (0.97%) | (0.89%) | (0.90%) | (0.93%) | (0.90%) |
| Return on Assets (ROA) | 3.58% | 3.51% | 3.28% | 3.27% | 3.29% | 3.19% |
| Financial Leverage (x) | 3.83x | 4.02x | 4.25x | 4.32x | 4.23x | 4.18x |
| Return on Equity (ROE) | 13.72% | 14.09% | 13.94% | 14.12% | 13.93% | 13.34% |
11. Management Commentary & Execution Priorities
In the Q1 FY27 presentation disclosures, executive leadership highlighted operational progress:
Management Commentary Highlights:
“We have started the year on a strong note, disbursing loans worth ₹16.1 billion (+41% YoY). Our monthly AUM addition improved by nearly 50% YoY, enabling us to achieve in three months what previously took close to five months. Net profit grew 23% YoY, supported by an 18% YoY growth in NII, a 22-bps expansion in NIM to 7.70%, and a 254-bps improvement in our Cost-to-Income ratio to 43.7%. Asset quality remains pristine, with 1+ DPD at 3.76% and GNPA at 1.11%.”
+-----------------------------------------------------------------------------------+
|                        CORE STRATEGIC MANAGEMENT PRIORITIES                       |
+-----------------------------------------------------------------------------------+
|  1. AUM ACCELERATION: Target high-teens AUM growth (~18–20%) for FY27.           |
|  2. PRODUCTIVITY DRIVE: Increase disbursement per officer and branch revenue.     |
|  3. GEOGRAPHIC EXPANSION: Contiguous expansion in Tier 3+ regions across 15 states|
|    .                                                                 |
|  4. SOURCING MIX: Expand direct sourcing (CSC, e-Mitra, IPPB) to lower acquisition|
|     costs.                                                          |
|  5. RISK DISCIPLINE: Maintain Stage 3 NPAs near ~1.0% with low write-offs.|
+-----------------------------------------------------------------------------------+
12. Comprehensive SWOT Analysis
+-----------------------------------------------------------------------------------+
|                                  SWOT ANALYSIS                                    |
+---------------------------------------------------+-------------------------------+
| STRENGTHS                                         | WEAKNESSES                    |
| * High net interest margins (7.70%) & spreads     | * Regional concentration: Top 3 states|
|   (5.06%).                          |   (RJ, MH, GJ) = 64% of AUM.|
| * Low-cost borrowing profile (7.64%)| * Higher Opex-to-Assets ratio (3.37%) |
|   backed by AA ratings.             |   vs. large HFCs.   |
| * Conservative LTVs (55%) and small ticket sizes  | * Elevated exposure to self-employed  |
|   (₹1.02 Mn).                       |   informal income borrowers (62%).|
+---------------------------------------------------+-------------------------------+
| OPPORTUNITIES                                     | THREATS                       |
| * Massive structural deficit in rural affordable  | * Aggressive pricing competition from |
|   housing across India.                           |   banks in high-ticket loans.     |
| * Operational leverage gains from AI decisioning  | * Macroeconomic shocks impacting informal|
|  .                                     |   cash flows in rural markets.    |
| * Scaling direct sourcing partnerships (e-Mitra,  | * Potential interest rate fluctuations|
|   IPPB).                            |   affecting borrowing costs.      |
+-----------------------------------------------------------------------------------+
13. Strategic Risk Matrix
+-----------------------------------------------------------------------------------+
|                           CORPORATE RISK ASSESSMENT MATRIX                        |
+-------------------+-----------------+---------------------------------------------+
| Risk Domain       | Exposure Level  | Analytical Assessment & Mitigation Strategy |
+-------------------+-----------------+---------------------------------------------+
| Credit Loss Risk  | Low-Moderate    | Informal borrower profile offset by low     |
|                   |                 | LTVs (55%) and internal underwriting.|
| Margin Compression| Low             | Matched floating-rate asset-liability mix   |
|                   |                 | mitigates rate volatility.       |
| Geographic Risk   | Moderate        | Rajasthan represents 33% of AUM; |
|                   |                 | contiguous expansion active in 15 states.|
| Liquidity Risk    | Low             | Strong cash buffer of ₹23.7 Bn covers       |
|                   |                 | debt obligations.                |
+-------------------+-----------------+---------------------------------------------+
14. Future Outlook & Industry Catalysts
AUM Growth Target: Management’s operational updates suggest potential AUM growth in the high-teens (~18%–20%) for FY27, supported by branch vintage maturation (65% of branches are >3 years old).
Cost-to-Income Trajectory: Operating leverage from digitized underwriting is expected to keep the Cost-to-Income ratio below 44%.
Credit Cost Stability: Credit costs are projected to remain within 15–25 bps, supported by stable 1+ DPD trends.
               HISTORICAL VS PROJECTED FINANCIAL METRICS

  Metric                FY25 Actual     FY26 Actual     Q1 FY27 Actual    FY27 Guidance
  --------------------------------------------------------------------------------------
  Disbursement Growth    10% YoY         11% YoY         +41% YoY          >20% Target
  AUM Growth             18% YoY         15% YoY         +15.4% YoY        18-20% Target
  Cost-to-Income         43.4%           44.7%           43.7%             <44% Target
  Gross Stage 3          1.08%           1.05%           1.11%             ~1.0% Target
  ROA                    3.27%           3.29%           3.19%             >3.2% Target
15. What This Means for Investors: Buy, Hold, or Sell Framework
Disclaimer: The following decision matrix provides an analytical framework for evaluation and does not constitute personalized investment advice.
+-----------------------------------------------------------------------------------+
|                             INVESTOR STRATEGY MATRIX                              |
+-----------------------------------------------------------------------------------+
| FOR LONG-TERM COMPOUNDING INVESTORS                                               |
| * THESIS: Strong choice in affordable housing finance due to robust margins      |
|   (7.70%), low write-offs (0.12%), and high capital adequacy (44.7%).|
| * ACTION: Suitable for gradual accumulation during market corrections.           |
+-----------------------------------------------------------------------------------+
| FOR SHORT-TERM TRADERS                                                            |
| * THESIS: Strong Q1 performance provides positive momentum, though quarterly     |
|   disbursements show seasonal patterns (Q1 lower than Q4).              |
| * ACTION: Watch key technical support levels and volume momentum post-earnings.  |
+-----------------------------------------------------------------------------------+
| FOR INSTITUTIONAL & VALUE INVESTORS                                               |
| * THESIS: Supported by strong institutional backing (CVC Capital at 48.88%)  |
|   and high ROA profile (~3.2%).                                     |
| * ACTION: Monitor AUM growth trajectory toward the high-teens target.            |
+-----------------------------------------------------------------------------------+
16. Editorial Opinion
Editorial Perspective: AAVAS Financiers’ Q1 FY27 results show solid operational execution. A 41% jump in loan disbursements alongside a 23% rise in Net Profit demonstrates that management’s focus on sales productivity, AI-assisted decisioning, and branch efficiency is yielding results.
What stands out is asset quality control: keeping Gross Stage 3 NPAs at 1.11% while serving informal, self-employed borrowers reflects strong underwriting discipline. With spreads held above 5% and capital adequacy at 44.7%, AAVAS remains well-positioned in the affordable housing segment.
17. Conclusion & Investor Checklist
AAVAS Financiers Limited delivered a strong Q1 FY27 performance, combining accelerated disbursements (+41%), healthy profit growth (+23%), expanding interest margins (7.70%), and disciplined asset quality (GNPA at 1.11%).
+-----------------------------------------------------------------------------------+
|                     QUARTERLY MONITORING CHECKLIST FOR INVESTORS                  |
+-----------------------------------------------------------------------------------+
| [ ] AUM Acceleration: Track if full-year AUM growth reaches the 18-20% target.     |
| [ ] Spread Preservation: Monitor net interest spread relative to the 5.0% floor  |
|    .                                                                |
| [ ] Early Buckets Stress: Watch 1+ DPD trajectory (currently at 3.76%).|
| [ ] Opex Discipline: Verify if Cost-to-Income remains below 44%.    |
| [ ] Geographic Mix: Monitor growth momentum in expansion states outside Rajasthan |
|    .                                                                |
+-----------------------------------------------------------------------------------+