

1. Introduction
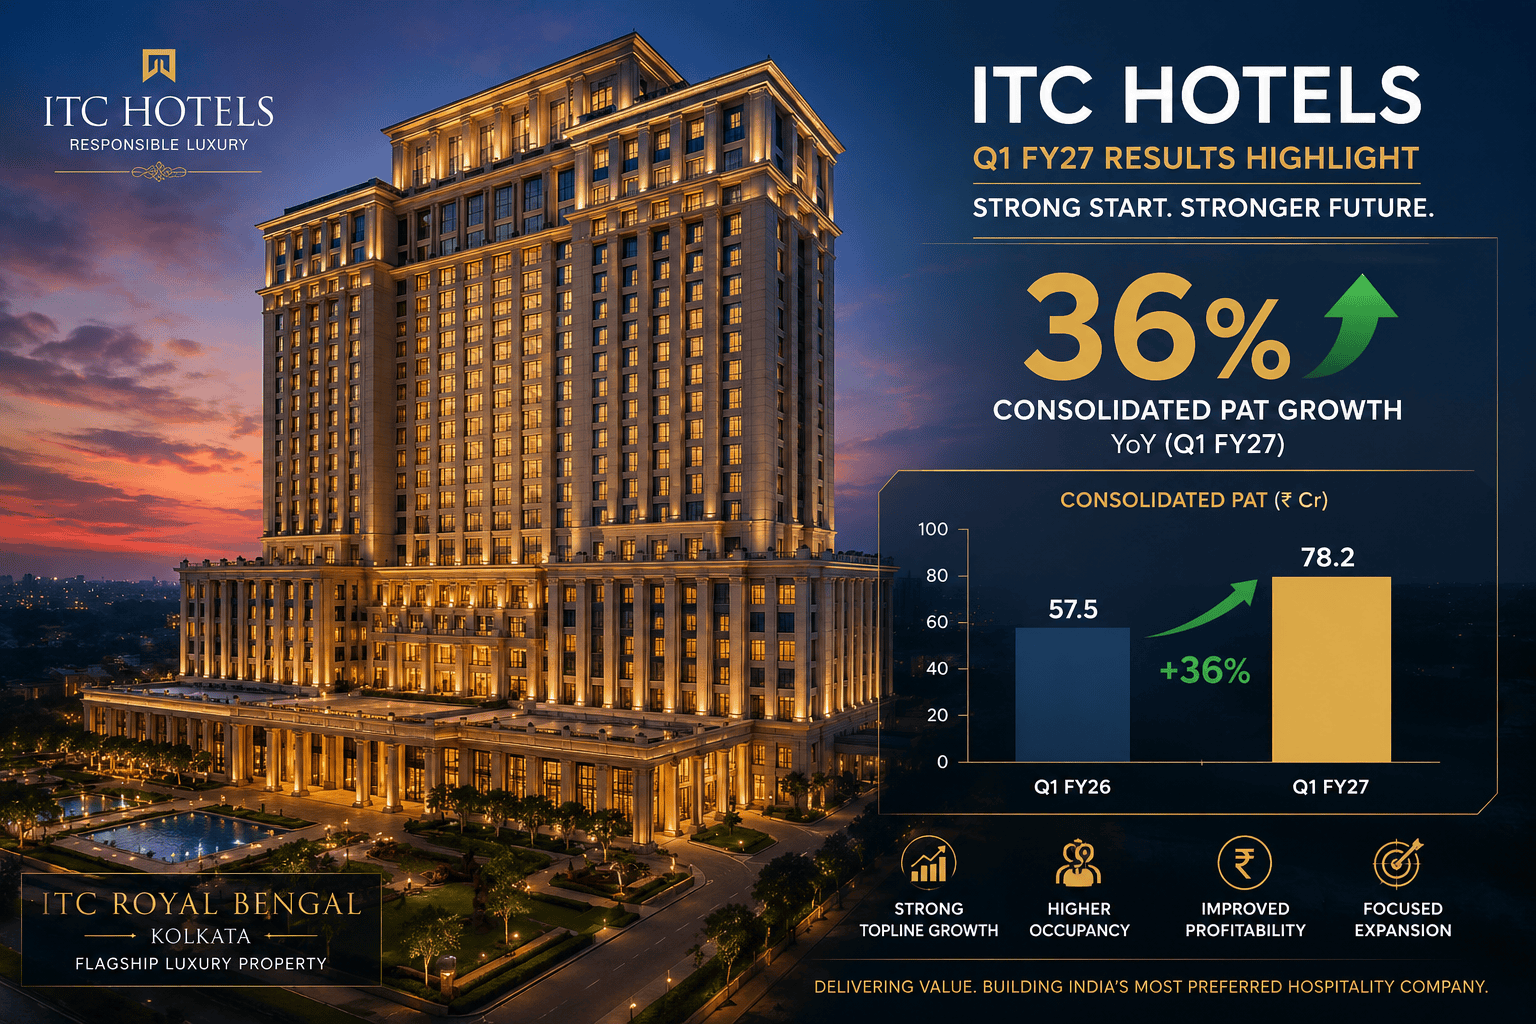
On July 16, 2026, the Board of Directors of ITC Hotels Limited finalized and approved the corporate entity’s unaudited financial disclosures for the first quarter of the fiscal year 2027. Operating in a volatile global macro environment marked by air travel uncertainties linked to the West Asia conflict, the premier hospitality powerhouse displayed outstanding operational agility and balance sheet resilience. Turning near-term market volatility into an opportunity for growth, ITC Hotels scaled its consolidated revenue from operations to ₹936 crore, marking a 15% expansion year-on-year. Crucially, the company’s consolidated Profit After Tax (PAT) surged by 36% to ₹182 crore, highlighting the structural tailwinds powering India’s domestic premium hospitality supercycle. For equity researchers and retail investors alike, this report serves as a definitive case study in structural business re-engineering through a modern, hyper-focused portfolio model.
                  ┌─────────────────────────────────────────┐
                  │        ITC HOTELS LIMITED (CONSO)       │
                  └────────────────────┬────────────────────┘
                                       │
         ┌─────────────────────────────┼─────────────────────────────┐
         ▼                             ▼                             ▼
┌──────────────────┐          ┌──────────────────┐          ┌──────────────────┐
│ Operational Rev  │          │    Conso PBT     │          │    Conso PAT     │
│   ₹936 Crore     │          │    ₹245 Crore     │          │    ₹182 Crore     │
│   (+15% YoY)     │          │    (+32% YoY)     │          │    (+36% YoY)     │
└──────────────────┘          └──────────────────┘          └──────────────────┘
2. Executive Summary: The Q1 FY27 Institutional Scorecard
Topline Expansion Matrix: Consolidated operations hit ₹936 cr (up 15% YoY), driven by strong retail room booking curves and expanding food and beverage pipelines.
Operating EBITDA Performance: Operating EBITDA rose 19% to ₹292 cr, confirming solid cost management across properties.
Enhanced Margin Ratios: Standalone EBITDA margins stabilized at 32%, while consolidated margins reached 31%.
Operational Key Realization: Revenue Per Available Room (RevPAR) recorded an 8% increase YoY, driven by a 4% increase in the Average Daily Rate (ADR) and a 290 basis point expansion in total occupancy.
Asset-Right Footprint Run: The managed business vector added 8 property signatures this quarter, pushing the managed ecosystem beyond the 200-hotel milestone.
Inorganic Strategy Integration: The acquisition of Kumarakom Resort & Spa was completed. A separate deal to acquire 100% of GHK Hospitality for ₹155 cr will fully transition Welcomhotel Ahmedabad into the owned asset segment.
International Resilience: Colombo-based luxury asset ITC Ratnadipa achieved positive EBITDA while sustaining local market leadership.
Sustainability Edge: Total captive renewable configuration scaled to 52.4 MW, further expanding the company’s leading portfolio of green credentials.
3. Company Snapshot & Demerged Structural Edge
ITC Hotels Limited represents a legacy of luxury and premium hospitality experiences, operating across multiple market niches through a successful cross-branded strategy. The structural configuration spans distinct pricing tiers:
                              ITC HOTELS GROUP
                                     │
      ┌────────────────┬─────────────┴───┬─────────────┬────────────────┐
      ▼                ▼                 ▼             ▼                ▼
┌───────────┐   ┌─────────────┐   ┌─────────────┐   ┌───────┐   ┌───────────────┐
│ITC Hotels │   │ Mementos &  │   │Welcomhotel  │   │Fortune│   │WelcomHeritage │
│  (Luxury) │   │   Storii    │   │(Upper Up-   │   │(Mid-  │   │  (Heritage    │
└───────────┘   │ (Bespoke/   │   │   scale)    │   │scale) │   │   Leisure)    │
                │ Experience) │   └─────────────┘   └───────┘   └───────────────┘
                └─────────────┘
Following its high-profile demerger from parent ITC Limited, the standalone hospitality vehicle functions with complete capital allocation autonomy. This structure allows the portfolio to be scaled via a dual-engine approach: maintaining owned flagship hotels in primary metros to preserve brand equity while aggressively deploying the capital-light managed model across high-potential Tier 2 and Tier 3 leisure destinations.
4. Q1 FY27 Financial Result Snapshot
Consolidated & Standalone Performance Matrix
The following table provides a complete breakdown of the unaudited corporate financial results released for the period ended June 30, 2026:
| Core Financial Metric (in ₹ Crore) | Standalone Q1 FY27 | Standalone Q1 FY26 | YoY Change (%) | Consolidated Q1 FY27 | Consolidated Q1 FY26 | YoY Change (%) |
| Operational Revenue | 808 | 744 | +9.0% | 936 | 816 | +15.0% |
| Other Operational Income | 51 | 39 | +30.0% | 59 | 44 | +32.0% |
| Total Gross Revenue | 859 | 744 | +10.0% | 995 | 860 | +16.0% |
| Total Operating Expenses | 546 | 506 | +8.0% | 644 | 571 | +13.0% |
| Operating EBITDA | 263 | 237 | +11.0% | 292 | 245 | +19.0% |
| EBITDA Margin Profile (%) | 32% | 32% | +57 bps | 31% | 30% | +123 bps |
| Depreciation & Amortization | 73 | 73 | +1.0% | 104 | 102 | +2.0% |
| Finance Costs / Interest | 3 | 3 | +1.0% | 2 | 2 | +21.0% |
| Profit Before Tax (PBT) | 237 | 201 | +18.0% | 245 | 185 | +32.0% |
| Tax Allocation Provision | 60 | 51 | +18.0% | 66 | 55 | +20.0% |
| Reported Profit After Tax (PAT) | 177 | 150 | +18.0% | 182 | 134 | +36.0% |
Data Source: Official Investor Disclosures, Exchange Filings, and Presentation Materials dated July 16, 2026. Financial metrics are rounded off to the nearest absolute integer for analytical clarity.
5. Deep Financial Analysis: Topline, Operating Ratios & Cost Structures
A detailed look at the consolidated numbers shows that revenue from operations (excluding Branded Residences) achieved a robust 10% structural growth run. Total operating revenue expanded to ₹936 cr, showing that the company successfully managed the initial travel demand dampening seen across early April 2026.
Consolidated Expense vs Margin Proportions (As % of Operational Topline):
┌────────────────────────────────────────────────────────┐
│ Operating EBITDA Margin Target                         │ 31%
└────────────────────────────────────────────────────────┘
┌────────────────────────────────────────────────────────┐
│ Other Combined Operational Costs Mix                   │ 28.1%
└────────────────────────────────────────────────────────┘
┌───────────────────────────────────────────┐
│ People & Labor Allocation Cost Pool       │ 24.6%
└───────────────────────────────────────────┘
The underlying cost items reveal strong corporate efficiencies:
Total Employee Costs: Maintained tightly at 24.6% of operational revenue on a comparable consolidated structure, down from 24.9% in the prior year.
Energy and Utility Costs: Stabilized efficiently at a low of 5.3% of revenue, down from 5.4% YoY. This reflects the structural savings coming from new captive green energy investments.
Other Operating Costs: Rose slightly to 28.1% of revenue from 27.6% YoY, showing near-term inflationary inputs from procurement supply chains.
Absolute EBITDA expansion (+19% consolidated) outpaced revenue growth (+15%), showing the operational leverage inherent in premium hotel models when high-margin retail occupancy grows.
6. Core Operational Metrics: ADR, Occupancy & RevPAR Engineering
Consolidated Portfolio Indicators (Excluding Branded Residences)
During the quarter, the key metric group tracked as follows:
Occupancy Expansion: Reached 74%, up 290 basis points from the 71% base recorded in the corresponding quarter last fiscal year.
Average Daily Rate (ADR): Rose to ₹11,310, marking a 4% increase over the base of ₹10,880.
Revenue Per Available Room (RevPAR): Scaled up by 8% to hit ₹8,380 vs the benchmark ₹7,740.
Consolidated RevPAR Multi-Year Trend Chart (in ₹):
FY25 Q1:  ██████████████████████████████ 6,780
FY26 Q1:  ████████████████████████████████████ 7,740
FY27 Q1:  █████████████████████████████████████████ 8,380
Expert Take on Market Premium: ITC Hotels preserved a significant 33% RevPAR premium relative to luxury, upper upscale, and upscale domestic competitors. This outperformance highlights the pricing power of its flagship properties and strong corporate guest preferences.
Revenue Mix Dynamics
The internal breakdown reveals excellent structural balance:
Room Revenue: Reached ₹430 crore (up 8% YoY). This growth was driven by high-margin corporate transient and leisure retail bookings, which successfully offset the high baseline visibility seen in the MICE and wedding blocks last year.
Food & Beverage (F&B) Revenue: Stood at ₹361 crore (up 11% YoY), supported by excellent premium dining banquet activity and specialty restaurant performance.
Management Fees: Surged by 35% to ₹49 crore, directly reflecting the growth of properties operating under the asset-right hotel layout.
7. Management Commentary & Capital-Allocation Disclosures
The official corporate comments point to a strong macro tailwind despite near-term turbulence. While global expansion indicators are moderating, India continues to operate as the world’s fastest-growing major economy, supported by IMF projections of a 6.4% real GDP pace for FY27 and an upwardly revised 6.7% for FY28.
Regarding corporate strategy, the team highlighted two clear priorities:
Strict Cost Control: Continuously improving underlying energy, procurement, and labor run-rates by embedding AI frameworks and automated analytics across property workflows.
Asset-Light Scaling: Programmatically expanding management footprint parameters while targeting an organic allocation framework where roughly 10-12% of cumulative cash balances are directed to upgrading owned properties and executing value-accretive brownfield projects.
8. Segment Breakdown & Strategic Brand Architecture
The total asset footprint of the hotel chain grew across distinct internal sub-brands:
Global Asset Brand Ledger (As of June 30, 2026)
| Asset Brand Identifier | Operational Hotel Count | Active Operational Keys | Pipeline Property Configuration | Total Keys (Active + Pipeline) |
| ITC Hotels (Flagship Luxury) | 17 | 4,861 | 2 | 5,266 |
| Mementos (Bespoke Luxury) | 2 | 181 | 2 | 601 |
| Storii (Premium Experiential) | 11 | 389 | 14 | 1,248 |
| Welcomhotel (Upper Upscale) | 31 | 3,440 | 26 | 6,891 |
| Fortune (Midscale Business) | 59 | 4,423 | 27 | 6,673 |
| WelcomHeritage (Leisure Archetype) | 36 | 1,078 | 3 | 1,186 |
| Aggregated Portfolio Baseline | 156 | 14,372 | 77 | 22,334 |
Note: Pipeline metrics explicitly account for ongoing owned developments, signed third-party managed additions, and corporate extensions across existing operational layouts.
9. Inorganic Footprint Acceleration: The Ahmedabad & Kumarakom Deals
ITC Hotels accelerated its domestic growth engine this quarter via two notable inorganic transactions:
Welcomhotel Ahmedabad Transition
The company entered into definitive purchase agreements to acquire 100% equity stake in GHK Hospitality and Infrastructures Limited (GHK) for an Enterprise Value of ₹155 crore on a debt-free and cash-free basis.
Asset Details: A 130-key operational hotel situated in Ahmedabad’s high-demand commercial nerve center, close to the Sabarmati Riverfront and the airport.
Strategic Justification: The asset was already managed by ITC Hotels under an existing services framework. Fully acquiring the property enables faster time-to-market compared to greenfield developments and allows the company to capture upside through property upgrades and institutional synergies.
Kumarakom Asset Repositioning
The transaction to acquire Kumarakom Resort & Spa in Kerala was fully finalized. A comprehensive asset renovation program is underway, with plans to officially relaunch the property as a luxury branded resort by Q3 FY27.
10. International Asset Tracking: Sri Lankan Structural Performance
Located on the oceanfront skyline of Colombo, the company’s flagship international asset ITC Ratnadipa delivered an encouraging quarter.
Operational Cash Flow: Achieved positive EBITDA during the quarter while sustaining leadership in regional city RevPAR benchmarks.
Residences Monetization: The progressive handover of the ultra-luxury Sapphire Residences residential complex continued, with 16 high-end apartments successfully transferred to buyers by the end of the quarter.
Macro Context: Although Sri Lanka’s broader economy is stabilizing under IMF-supported structural reforms, regional foreign tourist arrivals moderated slightly during the quarter. However, the local operational performance confirms the property’s premium positioning.
11. Fundamental Valuation Analysis vs Listed Peers
As investors evaluate the pure-play hospitality entity, comparing core financial parameters against key listed peers highlights different valuation approaches:
Relative Peer Valuation Metrics
| Listed Corporate Entity | Q1 FY27 Revenue Growth | EBITDA Margin Baseline | Primary Strategic Model Focus | ESG USGBC Certifications Profile |
| ITC Hotels Limited | +15.0% | 31.0% | Balanced Owned / Managed Mix | World Leader (24 LEED Platinum) |
| Indian Hotels (IHCL) | Available via BSE | Higher Premium | Global Multi-Branded Footprint | Regional Portfolio |
| Chalet Hotels Ltd | Available via BSE | Developer Owned | Macro Metro Asset Heavy | Specialized Hubs |
| Lemon Tree Hotels | Available via BSE | Midscale Branded | Capital-Light Franchising | Tier 2 / 3 Focus |
Analytical Note: Post demerger, ITC Hotels carries a lean balance sheet with very little legacy debt, positioning it well to sustain a premium return ratio profile as its 7,962-key expansion pipeline turns operational.
12. Comprehensive Hospitality Industry Landscape & Tourism Trends
The structural backdrop for Indian hospitality remains fundamentally favorable. Demand growth continues to outpace new room supply across premium Tier 1 city hubs.
┌────────────────────────────────────────────────────────┐
│ Structural Drivers: Discretionary Spend Scaling        │
└────────────────────────────────────────────────────────┘
                          ▼
┌────────────────────────────────────────────────────────┐
│ Corporate Travel + Expanding MICE Capabilities         │
└────────────────────────────────────────────────────────┘
                          ▼
┌────────────────────────────────────────────────────────┐
│ Rising Infrastructure: Connectivity & Tier 2/3 Hubs    │
└────────────────────────────────────────────────────────┘
While short-term performance in April 2026 was briefly impacted by West Asia macro uncertainties, domestic occupancies staged a sharp recovery through May and June. This rapid bounce-back highlights the resilience of domestic corporate travel, expanding MICE activities, and rising discretionary spending among affluent households.
13. Forensic Operational Risk Matrix
Geopolitical Inbound Disruptions: Heightened West Asia tensions could lead to prolonged spikes in jet fuel pricing or disrupt long-haul international flights, capping recovery in foreign tourist arrivals.
Cost Input Inflation: Rising costs across raw food groups, premium provisions, and localized operational inputs could compress margin expansion if pricing power faces resistance.
Currency Volatility Risks: Fluctuations in the Sri Lankan Rupee directly impact the comprehensive accounting value of overseas entities, as seen in the ₹210 crore foreign exchange translation adjustment within this quarter’s comprehensive income statement.
14. Future Outlook & the 2031 Key Expansion Matrix
The corporate development roadmap is anchored to an ambitious 2031 Key Expansion Matrix:
Institutional Evolution Blueprint (Operating keys):
2026 Asset Base:  ██████████████ 14,300+ Keys (40% Owned / 60% Managed)
2031 Target Base: ██████████████████████ 22,000+ Keys (33% Owned / 67% Managed)
To support this asset-right trajectory, the upcoming pipeline features:
Owned Flagship Assets: Under-construction greenfield luxury properties in Puri and Visakhapatnam, alongside design developments for a major new build in New Delhi.
Managed Network Expansion: A pipeline of 74 hotels containing over 7,200 managed keys, ensuring highly capital-efficient future growth.
15. Reality Check: Fact vs Misconception Ledger
Misconception: The expansion of the asset-light managed model will dilute the brand’s premium luxury status.
Fact: Managed growth is highly selective. Dedicated lifestyle brands like Storii (reaching the 25-hotel milestone this quarter) allow capital-efficient expansion while preserving the core flagship luxury brand identity.
Misconception: Near-term global travel disruptions present an immediate systemic threat to the company’s profitability.
Fact: Strong domestic travel and robust food and beverage revenues (+11% YoY) provide an excellent buffer, helping sustain a 36% jump in quarterly profits.
16. Structured Actionable Investor Perspectives
For Long-Term Structural Investors: The combination of asset-light execution, high RevPAR premiums (33%), and a clean balance sheet positions the stock well for stable capital compounding.
For Quality-Focused Growth Allocators: The steady growth in management fees (+35%) provides highly recurring, high-margin fee revenue that should expand return ratios over time.
For Systematic SIP Investors: The hospitality sector is inherently cyclical, making regular allocations a practical approach to smooth out seasonal valuation swings.
17. Editorial Opinion (Clearly Labeled)
EDITORIAL OPINION: ITC Hotels’ Q1 FY27 financial presentation shows a corporate turnaround strategy working in harmony. By stepping out from under the conglomerate umbrella of its parent, the management team has successfully proven it can maintain operational discipline on its own. The real highlight of this performance is the 35% growth in management fees. This shows the company is successfully executing its capital-light strategy rather than just discussing it.
However, long-term investors should watch a few key areas. The ₹210 crore translation adjustment to comprehensive income highlights the risks of international expansion in volatile markets like Sri Lanka. Additionally, while flagships in major metros continue to perform exceptionally well, success over the next five years will depend on whether new managed locations in Tier 2 and Tier 3 cities can maintain the company’s historic luxury pricing power. Overall, the operational foundation looks excellent, but the corporate model must show it can replicate these high metro margins across its expanding managed footprint.
18. Conclusion & Core Implementation Summary
ITC Hotels Limited has delivered a high-quality opening quarter for FY27, marked by a 36% expansion in consolidated profit to ₹182 crore. Strong execution across room revenue channels, expanding food and beverage lines, and rising management fee contributions helped successfully offset near-term global macro pressures. Backed by an aggressive asset-light pipeline and clear inorganic additions, the company remains well-positioned to benefit from India’s structural tourism tailwinds. Investors should continue to monitor pipeline execution and room yield metrics over the upcoming seasonal cycles.



