

1. Introduction
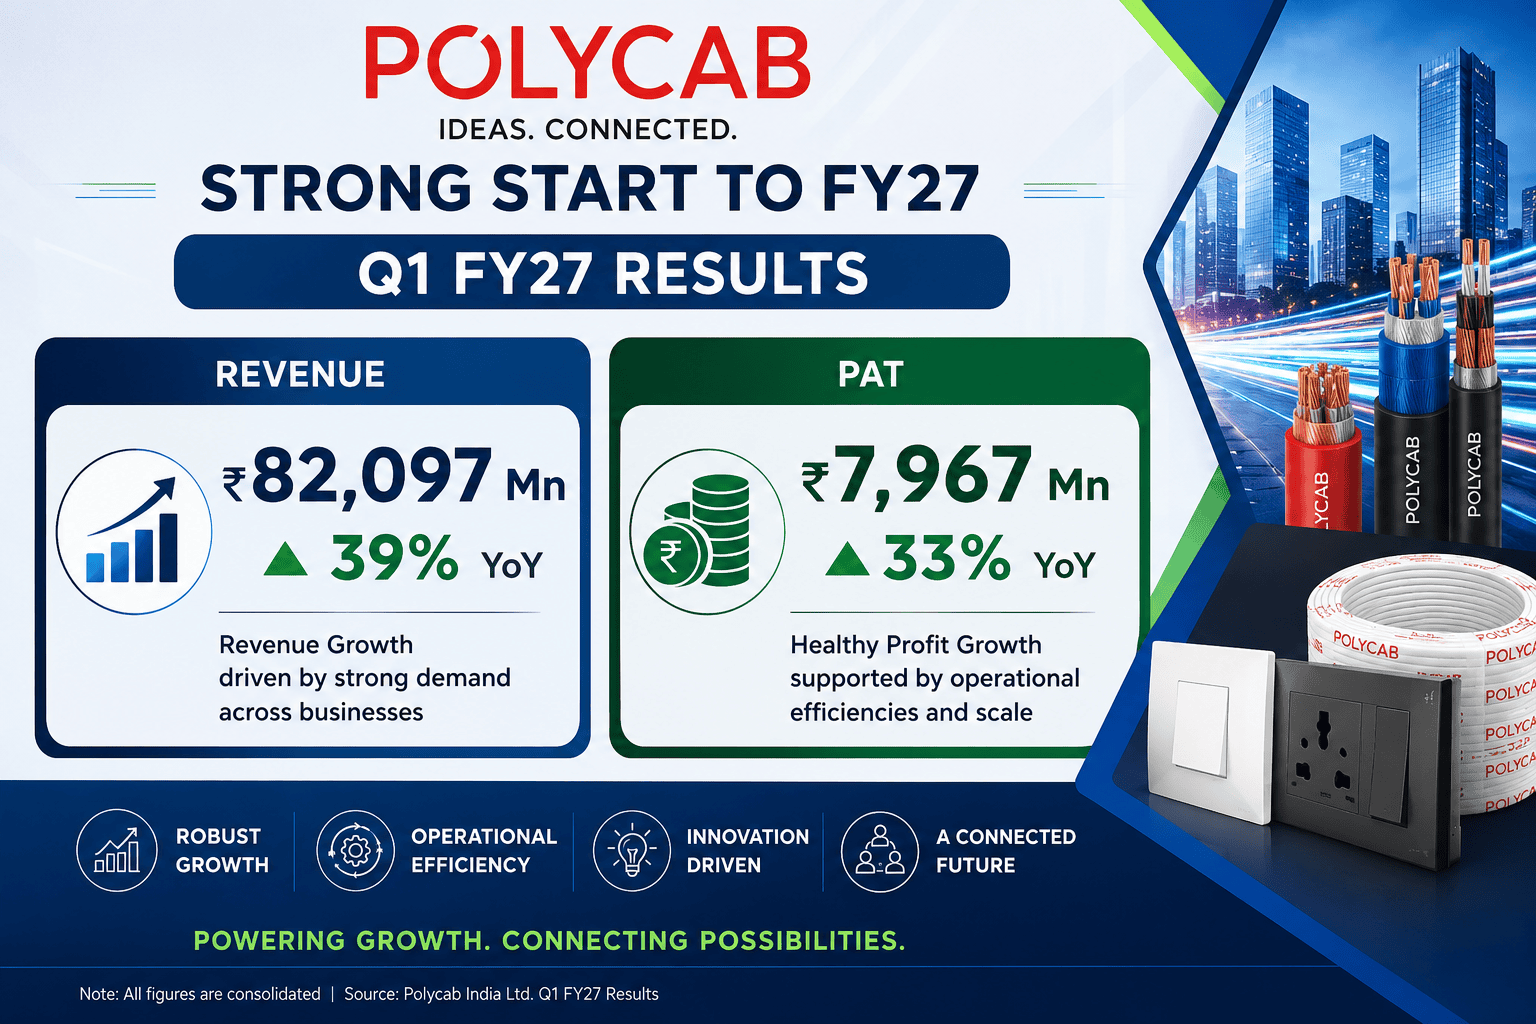
On July 16, 2026, corporate India received one of its most illuminating balance sheet disclosures of the current earnings cycle. Polycab India Limited, the absolute market leader in the domestic Wires and Cables (W&C) space, officially submitted its unaudited financial statements for the first quarter of the fiscal year 2027 to the exchanges. The numbers indicate a powerful operational run: consolidated revenue scaled to ₹82,097 million, marking an explosive 39% year-on-year (YoY) growth pattern. Even more striking for institutional observers was the net profitability outperformance, with Profit After Tax (PAT) surging 33% YoY to ₹7,967 million.
This acceleration matters immensely to market practitioners. As a key cyclical bellwether, Polycab’s core infrastructure execution and its concurrent transformation in the Fast Moving Electrical Goods (FMEG) domain act as vital benchmarks for consumer demand and domestic capital expenditure trends across the wider Indian economy.
2. Executive Summary: 10 Key Takeaways
Top-Line Acceleration: Consolidated operational revenue reached ₹82,097 million, expanding 39% YoY, driven by sustained domestic demand pipelines.
Sequential Seasonality: Revenues cooled by 7% quarter-on-quarter (QoQ) from the seasonally intense Q4 FY26 high of ₹88,645 million, aligned with expected monsoon deceleration.
EBITDA Scale Expansion: Operating EBITDA expanded 32% YoY to hit ₹11,362 million.
Margin Consolidation: Standalone EBITDA margins stabilized at 13.8%, demonstrating strong input cost pass-through despite copper and aluminum macro changes.
Record Breaking FMEG Run: The FMEG division registered a record-shattering quarter with revenues growing 71% YoY to ₹7,612 million.
FMEG Profitability Re-rating: FMEG segment EBIT margins hit a high of 8.0%, jumping up from a baseline of 2.1% in Q1 FY26.
International Deceleration: Exports de-grew by 13% YoY, contributing 3.3% to the absolute top-line mix, reflecting localized project timelines.
EPC Profit Optimization: Despite an 11% top-line pullback, EPC segment EBIT margins expanded by approximately 330 basis points YoY to reach 11.0%.
Cash Flow Excellence: Net Cash Position remains formidable at ₹39,900 million, supporting internal organic expansion programs.
Working Capital Efficiency: Net Working Capital days were optimized down to a low of 3 days on a closing basis, down from 12 days at FY26 close.
3. Company Overview & Strategic Moat
Polycab India Limited occupies an absolute leadership position within the Indian institutional landscape. The firm stands as the premier scale producer of electrical solutions nationwide, leveraging an expansive manufacturing presence and deep distribution channels.
                  ┌─────────────────────────────────────────┐
                  │          POLYCAB INDIA LIMITED          │
                  └────────────────────┬────────────────────┘
                                       │
         ┌─────────────────────────────┼─────────────────────────────┐
         ▼                             ▼                             ▼
┌──────────────────┐          ┌──────────────────┐          ┌──────────────────┐
│ Wires & Cables   │          │      FMEG        │          │      EPC         │
│  (87.2% Rev Mix) │          │  (9.3% Rev Mix)  │          │  (3.5% Rev Mix)  │
└──────────────────┘          └──────────────────┘          └──────────────────┘
The underlying corporate strategy is currently anchored to Project Spring—an institutionalized blueprint built to scale internal capabilities, enhance digital supply networks, and systematically drive higher premium product margins. This structure allows Polycab to actively pass through base metal commodity increases, protecting core margins while continuing aggressive market share captures across both B2B infrastructure projects and consumer B2C product channels.
4. Q1 FY27 Results Snapshot
To track core performance with analytical precision, the following detailed financial architecture highlights Polycab’s consolidated income statement metrics across sequential and annual horizons:
Consolidated Earnings Matrix
| Financial Metric (in ₹ Millions) | Q1 FY27 | Q4 FY26 | Q1 FY26 | YoY Change (%) | QoQ Change (%) |
| Revenue from Operations | 82,097 | 88,645 | 59,060 | +39.0% | -7.4% |
| Cost of Goods Sold (COGS) | 62,520 | 67,867 | 43,188 | +44.8% | -7.9% |
| Gross Contribution | 19,577 | 20,777 | 15,872 | +23.3% | -5.8% |
| Employee Benefit Costs | 2,615 | 1,931 | 2,189 | +19.5% | +35.4% |
| Other Operating Expenses | 5,601 | 7,233 | 5,107 | +9.7% | -22.6% |
| EBITDA | 11,362 | 11,613 | 8,576 | +32.5% | -2.2% |
| EBITDA Margin (%) | 13.8% | 13.1% | 14.5% | -70 bps | +70 bps |
| Other Income | 1,049 | 604 | 799 | +31.3% | +73.7% |
| Depreciation & Amortization | 1,029 | 978 | 857 | +20.1% | +5.2% |
| Finance Costs | 800 | 746 | 513 | +55.9% | +7.2% |
| Profit Before Tax (PBT) | 10,582 | 10,493 | 8,006 | +32.2% | +0.8% |
| Tax Expense | 2,616 | 2,637 | 2,009 | +30.2% | -0.8% |
| Profit After Tax (PAT) | 7,967 | 7,856 | 5,997 | +32.8% | +1.4% |
| PAT Margin (%) | 9.7% | 8.9% | 10.2% | -50 bps | +80 bps |
What This Means for Investors: The underlying data shows that while gross contribution margins saw compressed percentage points due to rapid commodity spikes, pure operational leverage at the employee and fixed overhead level helped sustain absolute EBITDA performance.
5. Key Drivers Behind the Numbers
Understanding the variables impacting Polycab’s balance sheet requires evaluating three distinct corporate tailwinds:
Robust Realization Trends: Base metals—specifically LME copper and aluminum—saw elevated macro pricing. Polycab’s established pricing power enables programmatic distribution adjustments, protecting aggregate returns.
The Domestic Wires Structural Outperformance: Within the core domestic business, pure-play retail building wires outpaced industrial cables. This dynamic directly corresponds to a highly resilient real estate execution cycle across major Indian urban hubs.
Operating Leverage Scaling: FMEG scaling showcases operational optimization at its best. By utilizing existing capacity and distribution infrastructure, the massive 71% volume surge was executed without adding linear operational costs, immediately translating into margin gains.
6. Segment-Wise Operational Deep-Dive
A. Wires & Cables (W&C) Segment
The primary operational engine generated ₹71,553 million in segment revenue, up 39% YoY from ₹51,312 million.
Wires & Cables Segment Mix Analysis:
┌────────────────────────────────────────────────────────┐
│ Domestic W&C Business (+39% YoY Expansion)             │ 96.7%
└────────────────────────────────────────────────────────┘
┌──────────────────────┐
│ International (Exports)                                │ 3.3%
└──────────────────────┘
Operational Execution: Segment EBIT arrived at ₹9,533 million with a stable margin profile of 13.3%.
Export Headwinds: The international export book faced a 13% YoY correction down to ₹2,671 million. Management maintains this remains entirely tied to localized delivery timelines rather than structural systemic failure.
B. Fast Moving Electrical Goods (FMEG) Segment
The growth standout delivered its highest-ever quarterly performance of ₹7,612 million, reflecting a massive 71% YoY leap.
Solar Scale: Solar equipment lines continued to be the main driver, scaling by more than 2x YoY to retain its rank as the leading expansion vector in the consumer portfolio.
Margin Transition: The segment’s EBIT surged to ₹606 million, yielding an 8.0% margin layout. This positions the division right on track to meet its long-range Project Spring milestone of 8–10% baseline EBITDA margins by fiscal year 2030.
C. Engineering, Procurement, and Construction (EPC) Segment
Revenue Realization: Revenue fell 11% YoY to ₹3,077 million, matching typical capital infrastructure lifecycle milestones.
Efficiency Gains: EBIT scaled beautifully by 26% YoY to ₹338 million, showing a notable 330 basis points margin optimization to hit 11.0%.
7. Financial Balance Sheet & Capital Allocation Analysis
Balance Sheet Position
| Key Balance Sheet Parameters (₹ Millions) | June 2026 | March 2026 | June 2025 |
| Fixed Assets (Net Block) | 50,965 | 48,794 | 39,489 |
| Cash & Liquid Bank Balances | 4,835 | 8,825 | 9,153 |
| Treasury Mutual Fund Investments | 35,441 | 34,048 | 20,453 |
| Long-Term Borrowings | 358 | 393 | 392 |
| Short-Term Borrowings | 694 | 932 | 663 |
| Net Cash Position | 39,900 | 41,940 | 31,160 |
Efficiency Metrics (Closing Basis)
Receivable Days: Stable at 39 days, demonstrating tight collection discipline.
Inventory Days: Managed at 96 days to preserve supply line optionality.
Payable Days: Stretched effectively to 132 days, enhancing short-term float.
Net Working Capital Cycle: Compressed down to a tight 3 days on a closing basis.
Polycab Net Working Capital Cycle Journey (Days):
FY24:       ████████████████████████████████████████████ 48
FY25:       ███████████████████████████████████████████ 49
FY26:       ████████████ 12
Q1 FY27:    ██ 3
8. Industry Context & Competitive Dynamics
The broader Indian electrical space continues to ride a deep corporate investment cycle. As grid capacity upgrades accelerate alongside urban real estate developments, high-quality manufacturing distribution holds a distinct advantage.
Compared to smaller peers, Polycab’s scale benefits look clear:
Raw Material Security: Uninterrupted institutional sourcing pathways allow large-scale manufacturing runs even during volatile global tracking windows.
Unmatched Distribution Reach: A massive distributor network allows rapid channel fill, making the rollout of high-margin premium products far more effective than regional options can match.
9. Brokerage Consensus & Educational Market View
Shareholding Matrix (As of June 30, 2026)
Promoter Group: 61%
Foreign Institutional Investors (FII): 19%
Domestic Institutional Investors (DII): 5%
QIB + AIF Pools: 3%
Retail/Public Allocations: 13%
Shareholding Distribution Chart:
┌───────────────────────────────────────────┐
│ Promoter (61%)                            │
└───────────────────────────────────────────┘
┌──────────────┐
│ FII (19%)    │
└──────────────┘
┌───────────┐
│ Public(13%)│
└───────────┘
┌────┐
│DII5%│
└────┘
Technical Education Angle
Following this clear earnings outperformance, market observers typically watch the institutional accumulation index. Rather than trying to predict short-term price movements, look for key volume-supported consolidation bases and support structures near major long-term moving averages to assess institutional demand.
10. Reality Check: Fact vs. Misconception
Misconception: The sequential 7% pullback in top-line revenue indicates structurally weakening execution.
Fact: The capital goods sector is fundamentally seasonal. Q4 traditionally experiences peak project billings, while Q1 naturally moderates due to monsoon dynamics across the country.
Misconception: High base metal pricing is an immediate structural risk to Polycab’s margin viability.
Fact: The corporate model leverages robust channel pass-through capabilities, as evidenced by total absolute EBITDA expanding 32% YoY to ₹11,362 million.
11. Structured Risk Matrix
Commodity Volatility: Sharp, sudden spikes in international LME copper/aluminum tables can cause short-term margin friction before pricing adjustments catch up.
Export Headwinds: A prolonged global macro slowdown could extend the current 13% export contraction, impacting long-term geographical balance plans.
Working Capital Reversals: The current ultra-low 3-day closing working capital cycle is exceptionally tight. Any delays in vendor cycles could cause this to return toward normal historical baselines.
12. Strategic Outlook & “What to Watch Next”
As Polycab enters the remainder of the fiscal year 2027, the structural foundation looks well-defined. Market participants should focus on tracking:
Whether the FMEG division can reliably hold its improved 8.0% EBIT margin baseline toward the Project Spring target.
The deployment speed of the ₹3,166 million quarterly capex run into new production lines.
The stabilization and recovery of export shipments back toward mid-single-digit contribution levels.
13. Investor Takeaways & Actionable Frameworks
For Long-Term Strategic Allocators: The combination of structural top-line expansion (+39%), low leverage, and an efficient working capital cycle highlights strong corporate fundamentals.
For Growth Investors: The FMEG turnaround shows that the team can successfully scale a secondary business line, adding a strong new growth option to the company.
For Systematic SIP Allocators: As a key beneficiary of India’s multi-year capex and real estate expansion, systematic investing helps balance short-term market valuation swings.
14. Editorial Opinion (Clearly Labeled)
EDITORIAL OPINION: Polycab India’s Q1 FY27 financial presentation shows a high-performing business firing on almost all cylinders. The real standout this quarter is not the core Wires and Cables performance—which remains solid due to macro tailwinds—but the structural improvement within the FMEG business. Historically viewed by the market as a low-margin drag on corporate returns, the FMEG segment’s move to an 8.0% EBIT margin shows real operational leverage and the successful premiumization of the product mix.
However, prudent investors should maintain a balanced perspective. The drop in exports (-13%) indicates that scaling global markets remains an uphill battle. Additionally, the incredibly tight 3-day working capital cycle leaves very little room for operational error. If vendor financing costs rise, this metric could easily normalize upward. Overall, the corporate engine shows exceptional operational strength, but long-term upside depends on maintaining these domestic margin gains while turning around international export growth.
15. Conclusion & Verification Ledger
Polycab India Limited has delivered a high-quality Q1 FY27 performance, defined by ₹82,097 million in consolidated revenue and a ₹7,967 million net profit. Strong domestic real estate activity and clean execution in the premium FMEG segments helped offset softer international numbers. Backed by a healthy ₹39,900 million net cash buffer, the company’s financial profile remains exceptionally solid as it enters the next phase of the fiscal year.



