

1. Introduction
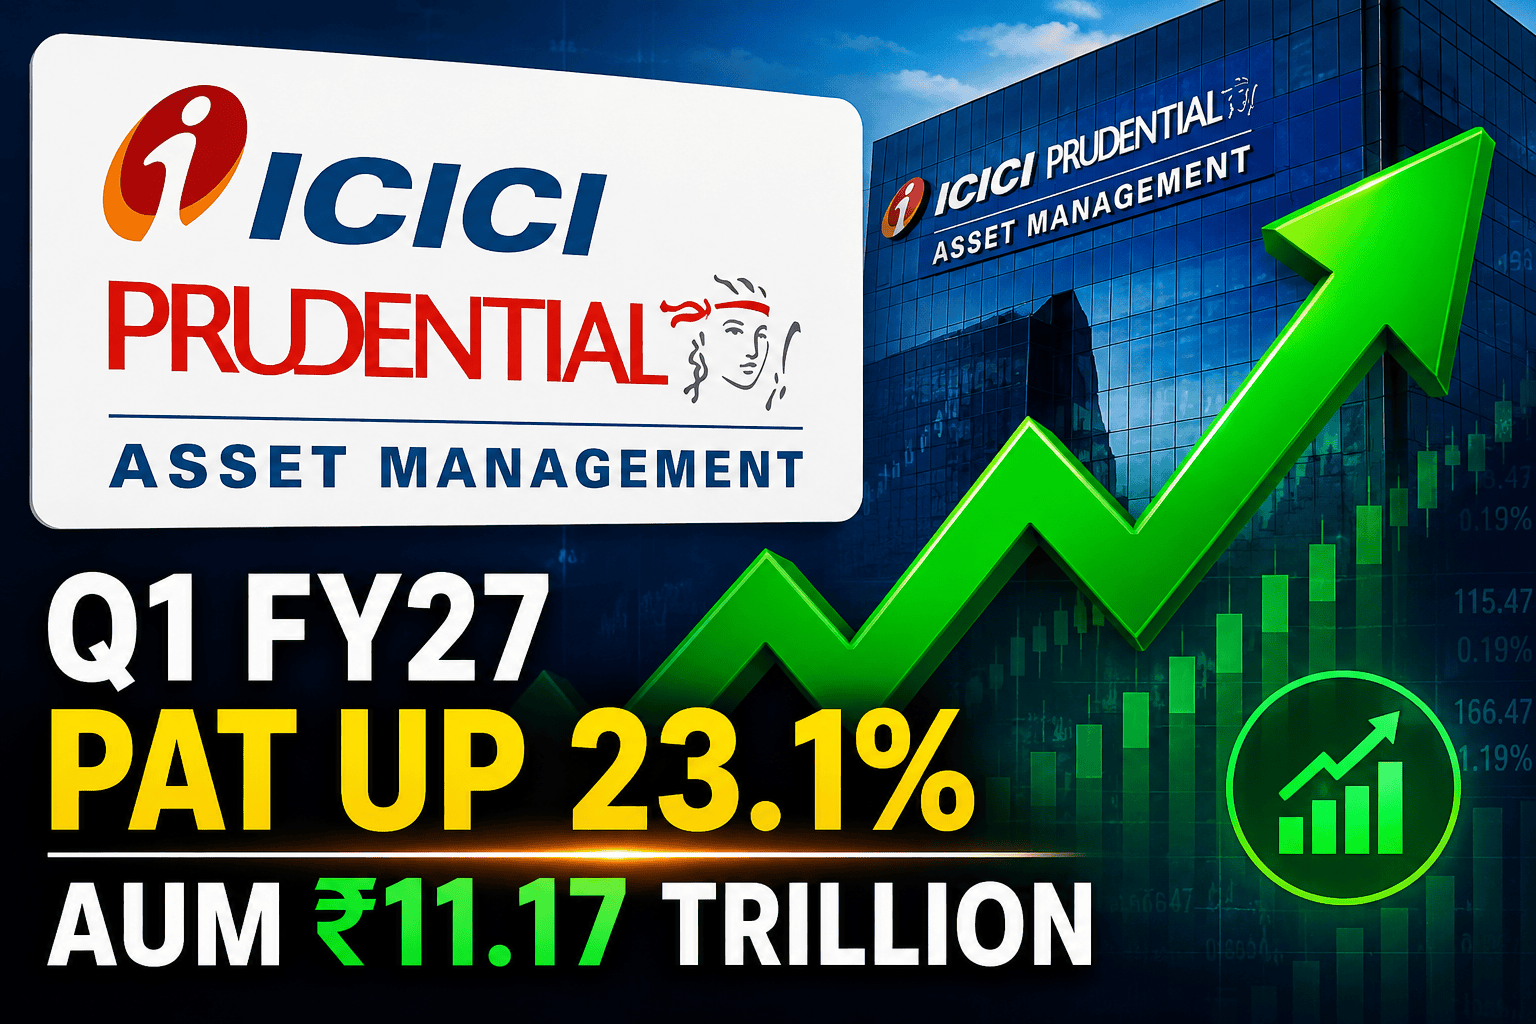
In a quarter characterized by massive retail participation and soaring equity markets, ICICI Prudential Asset Management Company (AMC) Limited has delivered a resounding financial performance for Q1 FY27 (quarter ended June 30, 2026). The standout metric? A striking 23.1% year-on-year (YoY) surge in Profit After Tax (PAT), reaching ₹9.64 billion (₹9,646.3 million).
This profitability was driven by a robust expansion in its asset base, with Total Mutual Fund Quarterly Average Assets Under Management (QAAUM) crossing the ₹11 trillion mark to settle at ₹11,172.22 billion—an 18.3% YoY growth. Furthermore, the AMC solidified its industry dominance by capturing a 13.5% market share in Active MF QAAUM (the highest in the industry) and a staggering 26.6% market share in Equity Hybrid MF QAAUM.
For institutional allocators, SIP investors, and financial market observers, ICICI Prudential AMC’s latest scorecard highlights more than just top-line revenue growth; it showcases extreme operational leverage, boasting an annualized Return on Equity (ROE) of 89.9%. Let us deconstruct these earnings to understand what is driving this growth, how management is leveraging Agentic AI, and what risks lie ahead in the highly competitive Indian asset management landscape.
2. Executive Summary
Here are the critical 10 takeaways from ICICI Prudential AMC’s Q1 FY27 results:
Profitability Surge: PAT increased by 23.1% YoY to ₹9,646.3 million.
Revenue Expansion: Operating Revenue grew by 17.6% YoY to ₹15,642.2 million.
AUM Milestone: Total MF QAAUM grew 18.3% YoY to ₹11,172.22 billion.
Market Share Dominance: Retained the highest market share in Active MF QAAUM at 13.5% and Equity Hybrid MF QAAUM at 26.6%.
Equity Tilt: MF Equity Schemes QAAUM grew 19.8% YoY to ₹6,312.15 billion, indicating strong retail risk appetite.
Stellar Capital Efficiency: The company reported an extraordinary annualized ROE of 89.9%.
SIP Traction: Systematic transactions (SIP/STP) for the month of June 2026 reached ₹48.72 billion, up from ₹42.45 billion in June 2025.
Customer Base Expansion: Unique customer count grew by 14.5% YoY to 17.3 million.
Alternates Growth: The Alternates and PMS QAAUM reached ₹794.46 billion.
Strategic AI Deployment: Implementation of Agentic AI, Gen AI smart search, and AI-driven outbound calls to drive operational efficiency.
3. Company Snapshot
ICICI Prudential Asset Management Company Ltd., incorporated in 1993, is one of India’s oldest and most formidable asset management firms, boasting a history spanning over 30 years.
Business Model: The AMC operates across multiple verticals, including managing mutual funds, providing portfolio management services (PMS), managing alternative investment funds (AIF), and providing offshore advisory services.
Guiding Philosophy: The company operates under “The Trust Compass,” focusing on Customer First, Profitable Growth, and Risk Management.
Distribution Network: The AMC possesses a massive distribution moat, encompassing over 116,000 empanelled distribution partners (Mutual Fund Distributors, National Distributors, and Banks). It services clients through 286 offices, including international branches in Dubai and Gift City.
Channel Mix: As of June 2026, 29.5% of its QAAUM comes from Direct channels, while 70.5% originates from Non-Direct channels (MFDs contribute 36.2%, National Distributors 15.9%, Banks 10.7%, and ICICI Bank 7.7%).
Human Capital: The organization employs a robust workforce of 3,813 personnel.
4. Q1 FY27 Earnings Snapshot
The financial performance of ICICI Prudential AMC demonstrates exceptional scale and cost control. Below is the verified data from their official Q1 FY27 investor presentation.
Table 1: Core Financial Performance (in ₹ Millions)
| Metric | Q1 FY27 (Jun ’26) | Q1 FY26 (Jun ’25) | YoY Growth | Q4 FY26 (Mar ’26) | QoQ Growth |
| Operating Revenue | 15,642.2 | 13,306.7 | +17.6% | 15,419.2 | +1.4% |
| Total Income | 17,450.2 | 14,775.2 | +18.1% | 14,520.5 | +20.2% |
| Total Expenses | 4,643.7 | 4,155.6 | +11.7% | 4,061.9 | +14.3% |
| Operating Profit | 10,998.5 | 9,151.1 | +20.2% | 11,357.3 | -3.2% |
| Profit Before Tax (PBT) | 12,806.5 | 10,619.6 | +20.6% | 10,458.6 | +22.4% |
| Profit After Tax (PAT) | 9,646.3 | 7,836.4 | +23.1% | 7,685.8 | +25.5% |
(Note: Comparative data has been restated to include the effect of the acquired business of ICICI Venture, accounted as a common control transaction w.e.f April 1, 2025.)
Table 2: Asset Under Management (AUM) Highlights (in ₹ Billions)
| Asset Class | Q1 FY27 QAAUM | Q1 FY26 QAAUM | YoY Growth | Market Share |
| Total MF QAAUM | 11,172.22 | 9,442.47 | +18.3% | 13.4% |
| Active MF QAAUM | 9,246.98 | 8,031.53 | +15.1% | 13.5% |
| MF Equity Schemes | 6,312.15 | 5,267.90 | +19.8% | 14.0% |
| MF Equity Hybrid | 2,215.41 | 1,774.57 | +24.8% | 26.6% |
5 Key Numbers Panel
89.9% – Annualized Return on Equity (ROE) for Q1 FY27.
17.3 Million – Total unique customer count.
₹48.72 Billion – Monthly systematic transactions (SIP/STP) logged in June 2026.
0.52% – Operating Revenue Yield.
29.5% – Proportion of AUM sourced through the “Direct” channel.
5. Financial Performance Analysis
A forensic look at ICICI Prudential AMC’s income statement reveals a textbook example of high operating leverage, a characteristic trait of top-tier asset managers.
Revenue Drivers: The 17.6% YoY growth in Operating Revenue (₹15,642.2 million) was directly propelled by the 18.3% YoY expansion in Total MF QAAUM. The AMC maintains a stable Operating Revenue Yield of 0.52%. This stability in yield, despite industry-wide fee compression pressures, indicates that the company is successfully offsetting lower yields in passive products by steering inflows toward higher-yielding active equity and hybrid schemes.
Expense Trends & Margin Expansion: While Operating Revenue grew by 17.6%, Total Expenses grew at a slower pace of 11.7% YoY (₹4,643.7 million). This delta between revenue growth and expense growth is the essence of operational leverage.
Employee Benefits Expense: Rose by 11.0% YoY to ₹2,039.9 million.
Fees and Commission Expense: Rose by 20.1% YoY to ₹1,236.9 million, aligning with the growth in AUM and non-direct channel distribution.
Operating Margin: The AMC reported an Operating Margin of 0.37%.
Capital Efficiency: Asset management is inherently an asset-light business, but an annualized ROE of 89.9% for Q1 FY27 is exceptionally high. It reflects maximum efficiency in utilizing shareholder equity to generate net profits.
6. Segment-wise Performance
The composition of an AMC’s AUM dictates its revenue quality. Equity assets typically command higher management fees compared to debt or liquid assets.
Equity & Hybrid Dominance: MF Equity Schemes QAAUM (₹6,312.15 billion) and Equity Hybrid MF QAAUM (₹2,215.41 billion) are the twin engines of profitability. Together, they represent a significant portion of the active AUM. The 24.8% YoY growth in Equity Hybrid schemes is particularly notable, indicating a strong investor preference for asset-allocation products.
Debt & Liquid Funds: Debt MF QAAUM stood at ₹1,925.24 billion (growing 2.0% QoQ), while Liquid MF QAAUM was ₹675.64 billion (contracting 6.6% QoQ). Liquid funds generally display seasonal volatility.
Passive Funds: Passive MF QAAUM experienced robust sequential growth of 4.5% QoQ, reaching ₹1,410.94 billion. The rise of passives aligns with broader industry trends where institutional and savvy retail investors utilize ETFs and Index funds for core portfolio allocation.
Alternates & PMS: Branded as a “Boutique within an Institutional Framework,” this high-yield segment saw Alternates QAAUM hit ₹794.46 billion. This comprises PMS (₹289.96 billion), AIF (₹227.37 billion), and Assets under Advisory (₹277.13 billion). The acquisition of management rights for identified Category II AIFs from ICICI Venture further bolsters this segment.
7. Management Strategy & Commentary
While specific verbatim quotes were not detailed in the earnings presentation, the strategic disclosures paint a clear picture of management’s forward-looking priorities.
Digital Transformation & Agentic AI: Management is aggressively investing in technology to drive scale without proportional cost increases. Key focus areas include:
Investment AI: Utilizing AI for auto-summarizing reports, earnings calls, and IPO documents, and building a conversational layer over investment data.
Customer & Distribution: Deploying Gen AI for smart searches, App Voice Mode, and personalized communication tailored for distributors and Relationship Managers.
Operational Efficiencies: Implementing “Agentic AI” to autonomously resolve service tickets, manage escalations, and execute AI-driven outbound VRM auto-calls.
Management’s clear directive is to increase customer engagement while building resiliency and isolated recovery protocols via enhanced security and compliance initiatives.
8. Valuation Analysis
Note: The provided Q1 FY27 presentation does not disclose current market capitalization, share price, or forward P/E multiples for ICICI Prudential AMC. However, institutional investors typically evaluate AMCs using the following frameworks:
Price-to-Earnings (P/E): AMCs are valued on their ability to generate consistent PAT. A 23.1% YoY PAT growth typically supports premium P/E multiples.
Market Cap to AUM: A standard industry valuation metric. Investors gauge the premium an AMC commands based on its proportion of high-yielding equity AUM versus low-yielding debt AUM.
Dividend Yield: Asset-light businesses like AMCs often distribute a significant portion of profits as dividends, making them attractive to yield-seeking investors.
Independent Editorial Opinion: Given the massive 89.9% ROE and strong equity market share, ICICI Prudential AMC’s fundamentals justify a strong institutional valuation premium, provided equity markets remain stable.
9. Industry Outlook & Peer Context
ICICI Prudential AMC operates in a highly penetrated yet rapidly growing Indian mutual fund industry.
Industry Tailwinds: According to AMFI data cited in the presentation, the Mutual Fund Industry QAAUM grew to a staggering ₹46.73 trillion by June 2026, representing a 36.5% YoY growth. A crucial driver is the financialization of savings in India, evidenced by Industry Unique Investors climbing to 61.9 million (a 12.1% YoY growth). Furthermore, Industry SIP Flows for June 2026 reached ₹317.81 billion, providing AMCs with a predictable, sticky source of monthly capital.
Peer Comparison Framework: ICICI Prudential AMC competes in an oligopolistic market alongside giants like HDFC AMC, Nippon Life India AMC, SBI Mutual Fund, and Aditya Birla Sun Life AMC. ICICI stands out with its 13.5% market share in Active MF QAAUM. Its massive 26.6% market share in the Equity Hybrid category specifically differentiates it from peers, acting as a competitive moat during periods of pure-equity market volatility.
10. Risks to the Investment Thesis
Despite the stellar Q1 FY27 performance, investing in AMC stocks carries inherent sector-specific risks.
Bear Case (Risks):
Market Volatility Risk: AMC revenues are highly correlated to underlying equity market levels. A severe market correction would instantly reduce AUM and, consequently, management fee revenues.
Yield Compression: As the industry matures, regulatory pressures from SEBI regarding Total Expense Ratios (TER) or a rapid consumer shift toward low-cost Passive Funds (which grew to ₹1.41 trillion for ICICI) could compress operating revenue yields.
Distribution Costs: High dependence on Non-Direct channels (70.5% of QAAUM) means the AMC must continually manage commission payouts to retain distributor loyalty.
Bull Case (Opportunities):
The continued structural shift of Indian household savings from physical assets (gold, real estate) to financial assets.
Operational leverage achieved through Agentic AI and digital autonomous operations, which can drive PAT growth even if AUM growth normalizes.
11. Investor Takeaways
For Long-Term Investors: The 89.9% ROE and 17.6% revenue growth highlight a fundamentally superior business model. The AMC is a direct proxy to India’s long-term economic growth and capital market expansion.
For SIP Investors (in ICICI Funds): The firm’s heavy investment in “Investment AI” for research and its market leadership in Active management (13.5% market share) indicate a robust infrastructure aimed at alpha generation.
For Institutional Investors: Keep a close watch on the Operating Revenue Yield. If ICICI can maintain the 0.52% yield amidst the rise of passive investing, it signifies supreme pricing power and product mix management.
12. Conclusion
ICICI Prudential AMC’s Q1 FY27 results are a testament to the power of scale and strategic asset allocation. By growing its Profit After Tax by 23.1% YoY to ₹9.64 billion and pushing its Total MF QAAUM past ₹11.17 trillion, the company has cemented its leadership position. The aggressive integration of AI across customer service, distribution, and investment research suggests that management is not resting on its laurels but actively future-proofing the organization.
While broader equity market valuations pose a macro risk, the internal mechanics of ICICI Prudential AMC—evidenced by its spectacular 89.9% ROE—remain exceptionally sound. Investors should monitor SIP retention rates and the growth of the high-margin Alternates business in the coming quarters to validate the long-term investment thesis.
Engagement Optimization Modules
Did You Know? ICICI Prudential AMC utilizes “Agentic AI” to autonomously resolve customer service tickets and execute intelligent outbound auto-calls, effectively turning technology into a digital workforce that scales without adding proportional human resource costs.
SWOT Analysis (Educational)
Strengths: Massive 116,000+ distribution network; 26.6% market share in Equity Hybrid funds.
Weaknesses: High dependence on broad equity market performance for revenue growth.
Opportunities: Rapid scaling of the ₹794.46 billion Alternates & PMS business to ultra-HNIs.
Threats: SEBI regulatory changes regarding expense ratios; relentless rise of zero-fee passive index funds.
Discussion Question for Readers: With 29.5% of ICICI Prudential AMC’s AUM coming from Direct channels, do you believe traditional Mutual Fund Distributors (MFDs) will lose relevance, or will hybrid advisory models dominate by 2030? Let us know your thoughts in the comments below!



