

Overview
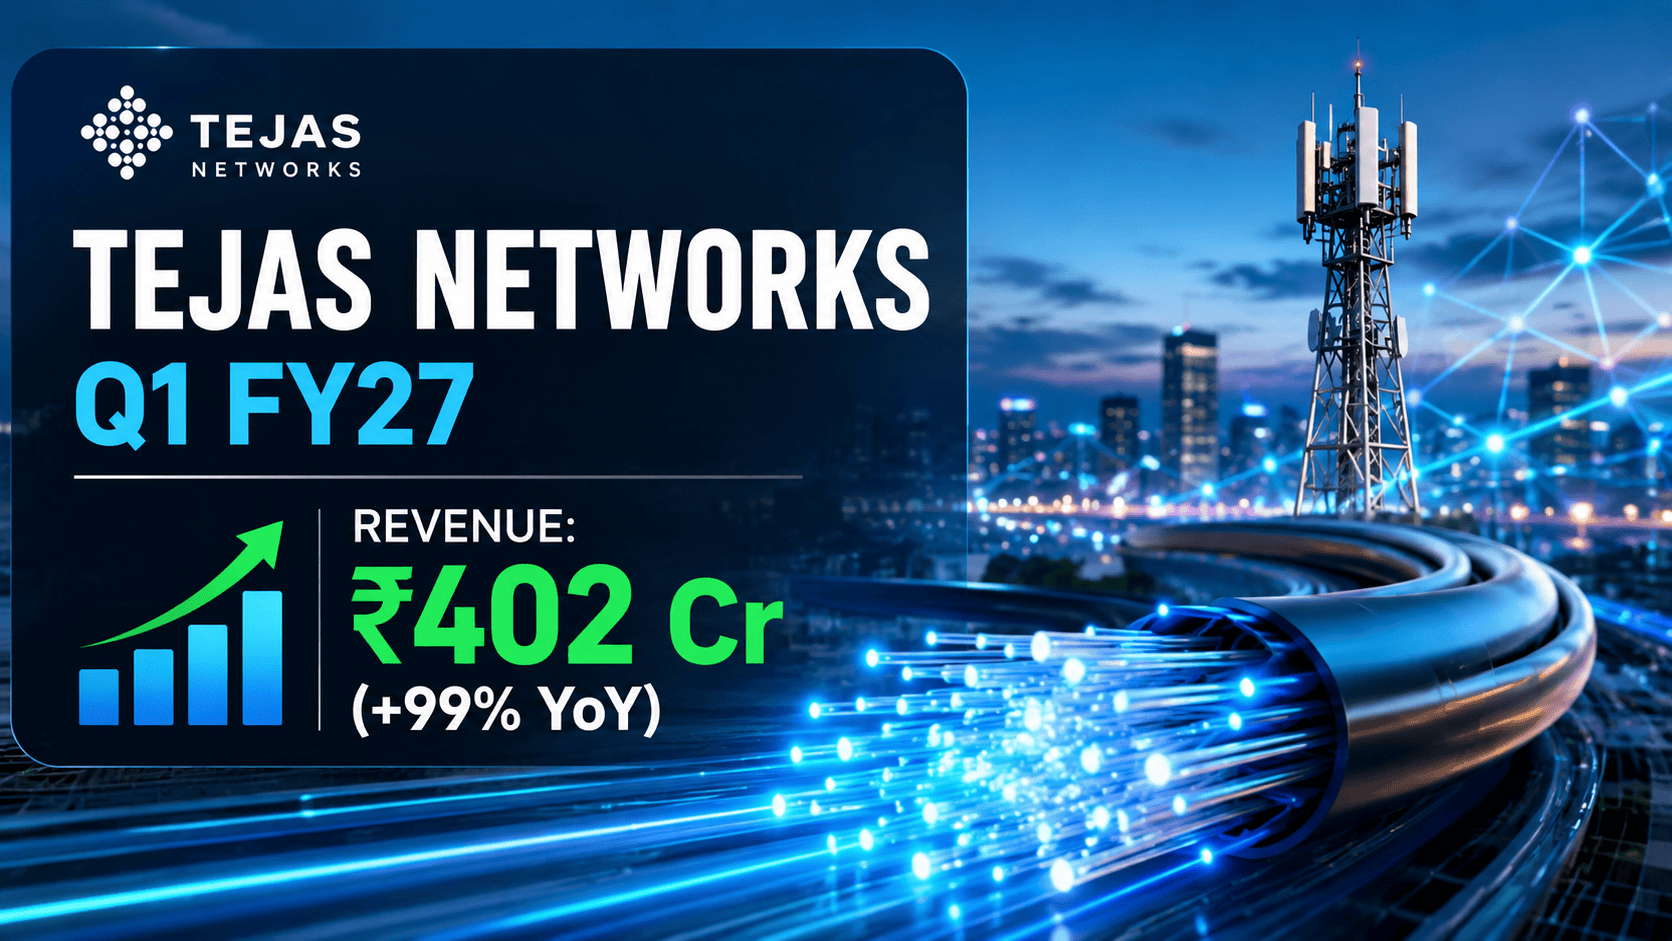
Tejas Networks Limited (NSE: TEJASNET | BSE: 540595) has officially released its unaudited standalone and consolidated financial results for the first quarter ending June 30, 2026 (Q1 FY27). The Tata Group-backed telecom and data networking pioneer continues to present a dual-narrative investment case: unprecedented top-line growth driven by large-scale domestic execution alongside ongoing bottom-line drag caused by heavy ongoing research and development (R&D) outlays, financing costs, and elevated depreciation schedules.
+-----------------------------------------------------------------------------------+
|                            Q1 FY27 HIGHLIGHTS SNAPSHOT                            |
+-----------------------------------------------------------------------------------+
|  • Consolidated Revenue: ₹402.16 Cr (Up +99.1% YoY vs ₹201.98 Cr)                 |
|  • Consolidated Net Loss: ₹(202.24) Cr (Slightly widened vs ₹(193.87) Cr YoY)     |
|  • Consolidated EBITDA Loss: Narrowed to ~₹(100) Cr (vs ₹(136) Cr in Q1 FY26)     |
|  • Standalone Revenue: ₹401.95 Cr (Up +99.1% YoY vs ₹201.93 Cr)                  |
|  • Standalone Net Loss: ₹(202.24) Cr (vs ₹(193.91) Cr in Q1 FY26)                 |
|  • Key Execution Driver: BSNL 4G/5G pan-India rollout & BharatNet Phase III        |
+-----------------------------------------------------------------------------------+
Why Q1 FY27 Financial Results Matter to Investors
For global and domestic institutional investors across the United States, the United Kingdom, Europe, and India, Tejas Networks serves as a primary barometer for India’s indigenous telecom equipment manufacturing ambitions (Make in India) and the execution capabilities of the Tata Telecom ecosystem.
                  +-----------------------------------+
                  |  TATA SONS TELECOM INFRA HUB      |
                  +-----------------+-----------------+
                                    |
            +-----------------------+-----------------------+
            |                                               |
            v                                               v
+-----------------------+                       +-----------------------+
|  Tejas Networks Ltd   |                       |  Tata Consultancy     |
|  (Optical/Radio HW)   |                       |  Services (Systems)   |
+-----------+-----------+                       +-----------+-----------+
            |                                               |
            +-----------------------+-----------------------+
                                    |
                                    v
                  +-----------------------------------+
                  |  BSNL 4G/5G & BharatNet Phase 3   |
                  +-----------------------------------+
The Q1 FY27 earnings release is particularly critical due to three structural factors:
Validation of Execution Velocity: Demonstrates whether supply chain bottlenecks from prior fiscal years have cleared to allow smooth delivery of the BSNL pan-India 4G/5G network deployment.
Margin Stabilization vs. Cost of Scaling: Examines whether operating leverage is kicking in as revenues approach quarterly run-rates above ₹400 crore.
Export and Commercial Diversification: Measures the company’s ability to transition from government-led domestic order dependency to high-margin private operator deployments and international exports (e.g., the NEC Corporation 5G Massive MIMO partnership).
Immediate Market Reaction
Following the announcement of the quarterly results on July 27, 2026, the equity market reflected a mixed reaction. While top-line expansion met or exceeded market expectations—doubling year-over-year—the persistent net loss prevented an immediate valuation re-rating.
Trading Context: The stock traded near ₹430–₹440 on the NSE, within its 52-week band of ₹294.00 to ₹761.60.
Market Capitalization: Stands at approximately ₹8,800 Crore to ₹9,700 Crore.
Investor Sentiment: Analysts note that while operational losses (EBITDA) are contracting, the equity market is awaiting a clear timeline for positive Net Profit After Tax (PAT) before driving a re-rating toward historical highs.
Comprehensive Financial Analysis
Unaudited Financial Performance (Standalone & Consolidated)
Note on Disclosures: All data presented below is sourced directly from Tejas Networks Limited’s Unaudited Financial Results filed with the BSE and NSE for the quarter ended June 30, 2026.
Consolidated Financial Statement (₹ in Crore)
| Financial Metric | Q1 FY27 (Unaudited) | Q4 FY26 (Unaudited) | Q1 FY26 (Unaudited) | Full Year FY26 (Audited) |
| Revenue from Operations | ₹402.16 | ₹332.69 | ₹201.98 | ₹1,103.28 |
| Other Income | ₹8.97 | ₹10.28 | ₹9.55 | ₹33.38 |
| Total Income | ₹411.13 | ₹342.97 | ₹211.53 | ₹1,136.66 |
| Cost of Materials Consumed | ₹132.09 | ₹297.07 | ₹123.13 | ₹820.51 |
| Purchases of Stock-in-Trade | ₹16.04 | ₹51.53 | ₹20.02 | ₹78.06 |
| Changes in Inventories | ₹109.05 | ₹(139.56) | ₹(26.84) | ₹(131.59) |
| Employee Benefits Expense | ₹105.24 | ₹99.78 | ₹95.82 | ₹404.60 |
| Finance Costs | ₹85.07 | ₹72.04 | ₹74.77 | ₹302.83 |
| Depreciation & Amortization | ₹94.35 | ₹100.84 | ₹96.46 | ₹402.73 |
| Allowance for ECL | ₹8.08 | ₹21.79 | ₹18.18 | ₹61.06 |
| Other Expenses | ₹132.02 | ₹120.28 | ₹107.34 | ₹552.47 |
| Total Expenses | ₹681.94 | ₹623.77 | ₹508.88 | ₹2,490.67 |
| Profit / (Loss) Before Tax (PBT) | ₹(270.81) | ₹(280.80) | ₹(297.35) | ₹(1,354.01) |
| Tax Expense / (Benefit) | ₹(68.57) | ₹(69.46) | ₹(103.48) | ₹(445.12) |
| Profit / (Loss) After Tax (PAT) | ₹(202.24) | ₹(211.34) | ₹(193.87) | ₹(908.89) |
| Basic & Diluted EPS (₹) | ₹(11.37) | ₹(11.90) | ₹(10.99) | ₹(51.35) |
YoY and QoQ Growth Comparison Table
                  +-----------------------------------+
                  |      REVENUE GROWTH TRAJECTORY    |
                  +-----------------------------------+
  ₹500 Cr +
          |                                     ₹402 Cr
  ₹400 Cr +                        ₹333 Cr       [+++++]
          |                        [+++++]       [+++++]
  ₹300 Cr +                        [+++++]       [+++++]
          |           ₹202 Cr      [+++++]       [+++++]
  ₹200 Cr +           [+++++]      [+++++]       [+++++]
          |           [+++++]      [+++++]       [+++++]
  ₹100 Cr +           [+++++]      [+++++]       [+++++]
          +-------------------------------------------+
                      Q1 FY26      Q4 FY26       Q1 FY27
| Metric | Q1 FY27 | Q1 FY26 (YoY) | YoY Change (%) | Q4 FY26 (QoQ) | QoQ Change (%) |
| Consolidated Revenue | ₹402.16 Cr | ₹201.98 Cr | +99.11% | ₹332.69 Cr | +20.88% |
| Standalone Revenue | ₹401.95 Cr | ₹201.93 Cr | +99.05% | ₹331.76 Cr | +21.16% |
| EBITDA Loss | ~₹(100) Cr | ~₹(136) Cr | Contracted 26.5% | ~₹(107) Cr | Contracted 6.5% |
| Consolidated PAT | ₹(202.24) Cr | ₹(193.87) Cr | Widened 4.31% | ₹(211.34) Cr | Narrowed 4.31% |
Detailed Financial Analysis: Revenue, Expenses & Margins
Top-Line Revenue Dynamics
Consolidated revenue grew by 99.1% YoY to reach ₹402.16 Crore in Q1 FY27, compared to ₹201.98 Crore in Q1 FY26. On a quarter-over-quarter basis, top-line growth expanded by 20.88% from ₹332.69 Crore in Q4 FY26.
This momentum is primarily anchored by execution scale-ups in key domestic projects, notably:
Supply of 4G/5G Radio Access Network (RAN) equipment for Bharat Sanchar Nigam Limited (BSNL).
High-capacity Optical Transport Network (DWDM/OTN) deliveries for national broadband backhaul.
Expense Breakdown & Margin Compression Analysis
Despite double-digit revenue expansion, Tejas Networks reported an operational loss due to cost overheads:
+-----------------------------------------------------------------------------------+
|                            Q1 FY27 COST COMPOSITION                               |
+-----------------------------------------------------------------------------------+
|  1. Material & Stock Cost:    ₹257.18 Cr  (37.7% of total expenses)             |
|  2. Other Expenses:           ₹132.02 Cr  (Includes ₹35.11 Cr Warranty Provision) |
|  3. Employee Benefits:        ₹105.24 Cr  (Substantial engineering talent base)   |
|  4. Depreciation & Amort.:    ₹94.35 Cr   (Amortization of capitalized R&D)      |
|  5. Finance Costs:            ₹85.07 Cr   (Interest on working capital debt)     |
+-----------------------------------------------------------------------------------+
Material Expenses: Total direct cost of goods sold (Cost of Materials + Stock-in-trade + Inventory changes) stood at ₹257.18 Crore. Note 5 of the financial report highlights that material costs include a reversal of inventory obsolescence provision amounting to ₹3.10 Crore for Q1 FY27, compared to a charge of ₹18.04 Crore in Q4 FY26.
Warranty Provisions: Included under Other Expenses (₹132.02 Crore) is a warranty expense provision of ₹35.11 Crore for Q1 FY27 (compared to ₹39.30 Crore in Q4 FY26). These provisions reflect potential fault rates and maintenance commitments associated with large-scale field deployments.
Financing and Amortization Drag:
Finance Costs (₹85.07 Cr): Reflect working capital borrowings required to fund large inventory and long billing cycles associated with government contracts.
Depreciation & Amortization (₹94.35 Cr): Driven by historic outlays on R&D asset capitalization and manufacturing infrastructure.
Business Segment & Product Portfolio Breakdown
Tejas Networks operates in a single primary business segment: Telecom and Data Networking Related Products and Services. However, its product and operational focus spans multiple domains:
                      +----------------------------------+
                      |   TEJAS PRODUCT PORTFOLIO FOCUS  |
                      +----------------+-----------------+
                                       |
        +------------------+-----------+-----------+------------------+
        |                  |                       |                  |
        v                  v                       v                  v
+---------------+  +---------------+       +---------------+  +---------------+
| Optical Netw. |  | Wireless RAN  |       | Fiber Access  |  | Enterprise/   |
| (DWDM / OTN)  |  | (4G / 5G)     |       | (GPON / XGS)  |  | Defense Net.  |
+---------------+  +---------------+       +---------------+  +---------------+
1. Wireless Radio Access Network (4G/5G)
Status: Core growth engine for FY26–FY27.
Key Deployments: Proprietary 4G/5G Baseband Units (BBUs) and Remote Radio Heads (RRHs) being deployed nationwide.
Global Strategic Move: Signed a major agreement with NEC Corporation to manufacture and supply high-capacity 32TR and 64TR 5G Massive MIMO radios compliant with 3GPP and O-RAN standards.
2. Optical Networking (DWDM & OTN)
Status: Stable cash flow backbone.
Use Case: Provides ultra-high-capacity transport networks for utility grids, defense backbones, and telecom operators upgrading to 100G/400G bands.
3. Broadband Access (GPON / XGS-PON)
Status: Beneficiary of BharatNet Phase III initiatives aimed at bringing fiber connectivity to rural gram panchayats.
Major Strategic Developments & Future Growth Catalysts
1. The NEC Partnership for Global 5G Infrastructure
In Q4 FY26, Tejas signed a strategic agreement with Japan’s NEC Corporation to co-develop, manufacture, and supply 5G Massive MIMO radios. This agreement serves two objectives:
Global Market Access: Allows Tejas to enter Tier-1 international telecom accounts via NEC’s global distribution network.
Diversification: Reduces direct reliance on Indian public sector procurement over the medium term.
2. AI & Data Center Networking Opportunities
With the global proliferation of Artificial Intelligence workload clusters, data centers require high-capacity, low-latency Optical Interconnects (DCI). Tejas is positioning its high-speed packet-optical transport products to address high-density data center interconnect requirements across Asia and EMEA markets.
3. R&D Capitalization & 6G Readiness
Tejas Networks continues to re-invest heavily in software-defined hardware architectures. Through its subsidiary Saankhya Labs, the company is pursuing advances in Direct-to-Mobile (D2M) broadcasting, satellite communication payloads, and next-generation 6G wireless IP creation.
SWOT Analysis
+-----------------------------------------------------------------------------------+
|                                 SWOT ANALYSIS                                     |
+-----------------------------------------------------------------------------------+
|  STRENGTHS                                 |  WEAKNESSES                          |
|  • Strong Tata Group backing & capital    |  • Persistent bottom-line losses     |
|  • End-to-end IP ownership in 4G/5G/Optical|  • High finance and borrowing costs  |
|  • Strong position in PSU order books      |  • Extended working capital cycle    |
+--------------------------------------------+--------------------------------------+
|  OPPORTUNITIES                             |  THREATS                             |
|  • BharatNet Phase III & 5G SA expansions  |  • Global supply chain disruptions   |
|  • NEC Partnership for export markets      |  • Aggressive pricing by global OEMs |
|  • AI Data Center Interconnect demand      |  • Delays in government milestone pay|
+-----------------------------------------------------------------------------------+
Financial Ratios & Solvency Snapshot
| Financial Ratio | Metric Value (Q1 FY27 / Trailing) | Strategic Analyst Assessment |
| Gross Margin | ~30.5% – 35.8% | Influenced by product mix and component pricing. |
| Operating (EBITDA) Margin | Negative (~ -24.8%) | Improving YoY as revenue doubles. |
| Debt to Equity Ratio | ~0.35x – 0.50x | Borrowings driven by working capital requirements. |
| Book Value per Share | ~₹150 – ₹160 | Supported by equity additions and Tata infusions. |
Peer Comparison: Tejas Networks vs. Competitors
To provide a perspective for global investors, the table below compares Tejas Networks with domestic peer HFCL Ltd. and global network infrastructure manufacturers:
| Parameter | Tejas Networks Ltd. | HFCL Ltd. | Sterlite Technologies (STL) | Global OEMs (Cisco / Nokia) |
| Primary Focus | Wireless RAN, Optical, GPON | Optical Cables, Wi-Fi, Telecom Equipment | Optical Fiber Cables & Solutions | Enterprise & Global Carrier Infrastructure |
| Market Cap (Approx.) | ~₹8,800 – ₹9,700 Cr | ~₹31,000 – ₹34,000 Cr | ~₹18,000 Cr | $100B+ / $20B+ |
| Key Competitive Edge | In-house R&D, Tata Ecosystem, Deep 4G/5G IP | Large Cable Capacity, Enterprise & EPC execution | Integrated Fiber Manufacturing | Global Tier-1 Carrier Relationships |
| Profitability Profile | Short-term Net Losses due to scale phase | Profitable (PAT positive) | Margin pressure, restructuring | Highly Cash Generative |
Share Price Performance & Historical Valuation Context
                  +-----------------------------------+
                  |   52-WEEK PRICE RANGE (NSE: TEJASNET)
                  +-----------------------------------+
  ₹800 +
       |
  ₹700 +
       |                  [52-Wk High: ₹761.60]
  ₹600 +                             |
       |                             v
  ₹500 +
       |                 [CMP: ~₹430.00]
  ₹400 +                        |
       |                        v
  ₹300 +          [52-Wk Low: ₹294.00]
       +-------------------------------------------+
Stock Return Profile
| Period | Tejas Networks Return (%) | Market / Sector Benchmark Comparison |
| 1 Week | ~ +2.5% | Outperformed Nifty IT. |
| 1 Month | -3.5% | In-line with broader telecom equipment consolidation. |
| 6 Months | ~ +25.0% | Driven by NEC partnership and order book execution. |
| 52-Week Range | ₹294.00 – ₹761.60 | Reflects high volatility around quarterly execution cycles. |
Key Investment Risks
Investors evaluating Tejas Networks should consider the following risk factors:
Government and PSU Revenue Concentration: A significant portion of the current order book depends on public sector projects. Project milestone delays can result in extended billing cycles and elevated working capital needs.
Finance Cost Drag: With finance costs at ₹85.07 Crore in Q1 FY27, elevated interest rates directly impact bottom-line recovery.
Execution & Inventory Risks: Rapid technology transitions require managing component inventories to prevent obsolescence.
Foreign Exchange Volatility: Expanding international operations exposes the company to foreign currency fluctuations.
Investment Perspective: Bull, Bear, and Neutral Cases
                                 +------------------------+
                                 | SCENARIO VALUATION MATRIX|
                                 +-----------+------------+
                                             |
             +-------------------------------+-------------------------------+
             |                               |                               |
             v                               v                               v
  +--------------------+           +--------------------+           +--------------------+
  |     BULL CASE      |           |     BASE CASE      |           |     BEAR CASE      |
  | Target: ~₹660      |           | Target: ~₹530      |           | Target: ~₹350      |
  | Rapid international|           | Steady domestic    |           | Working capital    |
  | order conversion.   |           | execution.         |           | delays persist.    |
  +--------------------+           +--------------------+           +--------------------+
Bull Case
Core Drivers: Accelerated international revenue conversion through the NEC deal, margin expansion from proprietary 5G RAN deployments, and debt reduction via faster customer collections.
Valuation Target: Rerating toward historical peak levels (~₹660+).
Base Case (Consensus Analyst View)
Core Drivers: Steady top-line growth of 30%+ annually, gradually narrowing EBITDA losses, with full net profitability achieved as initial 5G deployment costs taper.
Valuation Target: Market consensus near ₹530.
Bear Case
Core Drivers: Working capital collection cycles remain stretched, interest costs continue to weigh on net income, and global telecom capex remains sluggish.
Valuation Support: Downside support observed around the ₹300 – ₹350 zone.
Frequently Asked Questions (FAQs)
1. What was Tejas Networks’ consolidated revenue in Q1 FY27?
Tejas Networks reported consolidated revenue from operations of ₹402.16 Crore for Q1 FY27, representing a 99.1% YoY increase.
2. What was the net profit or loss for Tejas Networks in Q1 FY27?
The company reported a consolidated net loss after tax of ₹202.24 Crore for Q1 FY27.
3. Did operating performance (EBITDA) improve during the quarter?
Yes, operational losses narrowed, with consolidated EBITDA loss contracting to approximately ₹100 Crore in Q1 FY27 from ₹136 Crore in Q1 FY26.
4. What are the main drivers of revenue growth for Tejas Networks?
Key revenue drivers include the nationwide 4G/5G network deployment for BSNL, broadband access rollouts under BharatNet, and optical backhaul upgrades.
5. What is the significance of the NEC Corporation agreement?
The partnership allows Tejas Networks to co-develop and supply 5G Massive MIMO radios globally, expanding its presence in international markets.
6. Why is Tejas Networks reporting net losses despite doubling revenue?
Net profitability remains impacted by high finance costs (interest on working capital), amortized R&D expenses, and quarterly warranty provisions.
7. Who is the parent or controlling promoter of Tejas Networks?
Tejas Networks is a subsidiary of Panatone Finvest Limited, part of the Tata Group (Tata Sons).
8. What is Tejas Networks’ primary product category?
The company designs and manufactures optical transport equipment (DWDM/OTN), wireless access (4G/5G RAN), fiber broadband systems (GPON), and packet switching devices.
9. How much did Tejas Networks spend on finance costs in Q1 FY27?
Consolidated finance costs for the quarter were ₹85.07 Crore.
10. What were the warranty expenses provided in Q1 FY27?
Other expenses for Q1 FY27 include a warranty provision of ₹35.11 Crore.
11. Does Tejas Networks have international operations?
Yes, it operates international subsidiaries including Tejas Communications Pte. Limited (Singapore), Tejas Communications (Nigeria) Limited, and Saankhya Labs Inc. (USA).
12. What was the basic Earnings Per Share (EPS) for Q1 FY27?
Consolidated basic and diluted EPS stood at ₹(11.37) per share.
13. What is the stock symbol for Tejas Networks?
The stock is listed as TEJASNET on the National Stock Exchange (NSE) and 540595 on the Bombay Stock Exchange (BSE).
14. What is the 52-week price range for Tejas Networks stock?
As per market disclosures, the stock’s 52-week high is ₹761.60 and the 52-week low is ₹294.00.
15. Where can investors view the official financial statements?
Official filings are available on the investor relations portal at [www.tejasnetworks.com](https://www.tejasnetworks.com) as well as on the NSE and BSE websites.
Conclusion
Tejas Networks Limited presents a story of top-line scaling alongside ongoing bottom-line adjustments. The doubling of top-line revenues in Q1 FY27 demonstrates execution capability for large-scale telecom infrastructure projects. However, turning top-line momentum into net earnings will require managing working capital debt, optimizing product costs, and expanding high-margin international sales.
Investors, supply chain analysts, and market participants should monitor upcoming quarterly collection trends, BSNL project completion milestones, and international deal execution through the NEC alliance.



