

Introduction:
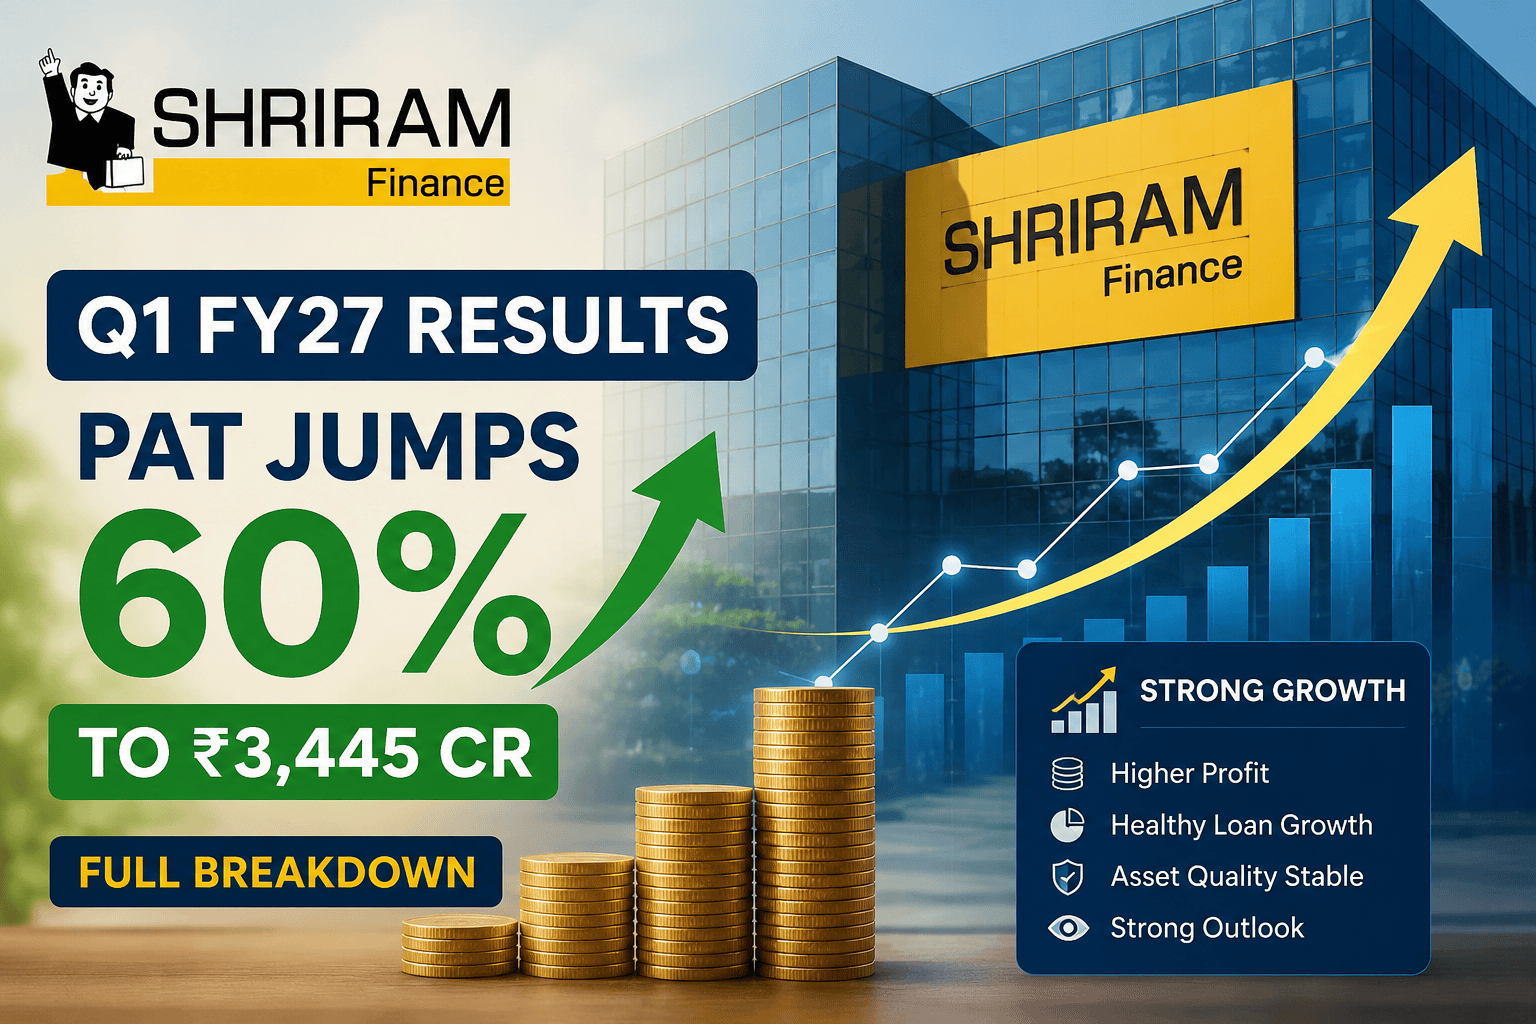
Shriram Finance Limited (SFL), India’s flagship retail asset financing Non-Banking Financial Company (NBFC), released its unaudited standalone and consolidated financial results for the first quarter of FY27 (Q1 FY27) on July 24, 2026. The quarterly numbers reveal significant operational strength, expanding profit margins, and a structural transformation in the company’s capital structure following a pivotal equity infusion from Japan’s MUFG Bank Ltd.
As one of the largest retail NBFCs in India—managing an Asset Under Management (AUM) exceeding ₹3.13 trillion—Shriram Finance serves as a vital barometer for India’s rural and semi-urban economy. The company’s core business model focuses on pre-owned commercial vehicle financing, MSME loans, two-wheeler credit, gold loans, and personal financing.
For global and domestic investors, Q1 FY27 is particularly historic. The quarter reflects the full impact of MUFG Bank’s strategic investment, where 471.12 million equity shares were allotted on April 8, 2026, for ₹39,617.98 crore, giving MUFG a 20% equity stake. This infusion has reduced debt-to-equity leverage, boosted net worth past ₹1.08 trillion, and elevated the Capital Adequacy Ratio (CRAR) to 34.17%.
================================================================================
                       SHRIRAM FINANCE Q1 FY27 DASHBOARD
================================================================================
[Net Interest Income]  --->  ₹8,055.70 Cr  (▲ 33.67% YoY)
[Profit After Tax]    --->  ₹3,444.56 Cr  (▲ 59.79% YoY)
[Total AUM]           --->  ₹3,13,798.39 Cr (▲ 15.26% YoY)
[Gross Stage 3 NPA]   --->  4.64%         (vs 4.58% QoQ)
[CRAR (Capital Ratio)]--->  34.17%        (vs 20.40% QoQ)
================================================================================
Complete Data Tables
Table 1: Quarterly Financial Performance (Standalone)
Source: Official Stock Exchange Filings & Investor Update
| Metric | Q1 FY27 (INR Cr) | Q4 FY26 (INR Cr) | Q1 FY26 (INR Cr) | YoY Growth (%) | QoQ Growth (%) |
| Total Revenue from Operations | 13,393.68 | 12,508.72 | 11,535.63 | 16.11% | 7.07% |
| Total Income | 13,412.11 | 12,527.91 | 11,541.76 | 16.21% | 7.06% |
| Interest Income | 12,909.97 | 12,087.12 | 11,173.22 | 15.54% | 6.81% |
| Finance Costs (Interest Expended) | 5,204.28 | 5,335.76 | 5,400.76 | -3.64% | -2.46% |
| Net Interest Income (NII) | 8,055.70 | 6,994.08 | 6,026.43 | 33.67% | 15.18% |
| Operating Expenses | 2,080.86 | 1,805.28 | 1,910.68 | 8.91% | 15.27% |
| Core Operating Profit | 5,974.84 | 5,188.80 | 4,115.75 | 45.17% | 15.15% |
| Impairment on Financial Instruments | 1,463.26 | 1,409.73 | 1,285.69 | 13.81% | 3.80% |
| Profit Before Tax (PBT) | 4,622.11 | 3,915.31 | 2,906.73 | 59.01% | 18.05% |
| Profit After Tax (PAT) | 3,444.56 | 3,013.57 | 2,155.73 | 59.79% | 14.30% |
| Basic EPS (₹) | 14.83 | 16.02 | 11.46 | 29.41% | -7.43% |
| Total AUM | 313,798.39 | 302,273.75 | 272,249.01 | 15.26% | 3.81% |
| Net Worth | 108,297.48 | 65,244.09 | 58,865.72 | 83.97% | 65.99% |
| Return on Assets (ROA %) | 3.93% | 3.63% | 2.76% | +117 bps | +30 bps |
| Return on Equity (ROE %) | 12.76% | 18.73% | 14.69% | -193 bps | -597 bps |
| Gross Stage 3 NPA (%) | 4.64% | 4.58% | 4.53% | +11 bps | +6 bps |
| Net Stage 3 NPA (%) | 2.33% | 2.33% | 2.57% | -24 bps | 0 bps |
| Provision Coverage Ratio (PCR %) | 50.99% | 50.34% | 44.31% | +668 bps | +65 bps |
| Capital Adequacy Ratio (CRAR %) | 34.17% | 20.40% | 20.79% | +1,338 bps | +1,377 bps |
| Cost-to-Income Ratio (%) | 25.48% | 25.32% | 29.29% | -381 bps | +16 bps |
| Net Interest Margin (NIM %) | 9.04% | 8.61% | 8.11% | +93 bps | +43 bps |
Table 2: Year-on-Year (YoY) Comparison
Source: Official Stock Exchange Filings & Investor Update
| Parameter | Q1 FY27 | Q1 FY26 | YoY Growth / Change |
| Total Income (INR Cr) | 13,412.11 | 11,541.76 | +16.21% |
| Net Interest Income (INR Cr) | 8,055.70 | 6,026.43 | +33.67% |
| Profit After Tax (INR Cr) | 3,444.56 | 2,155.73 | +59.79% |
| Basic EPS (₹) | 14.83 | 11.46 | +29.41% |
| AUM (INR Cr) | 313,798.39 | 272,249.01 | +15.26% |
| Net Worth (INR Cr) | 108,297.48 | 58,865.72 | +83.97% |
| Gross NPA (%) | 4.64% | 4.53% | +11 bps |
| Net NPA (%) | 2.33% | 2.57% | -24 bps |
| Debt-to-Equity Ratio (x) | 2.14x | 4.15x | -2.01x |
Table 3: Quarter-on-Quarter (QoQ) Comparison
Source: Official Stock Exchange Filings & Investor Update
| Parameter | Q4 FY26 | Q1 FY27 | QoQ Growth / Change |
| Total Income (INR Cr) | 12,527.91 | 13,412.11 | +7.06% |
| Net Interest Income (INR Cr) | 6,994.08 | 8,055.70 | +15.18% |
| Profit After Tax (INR Cr) | 3,013.57 | 3,444.56 | +14.30% |
| Basic EPS (₹) | 16.02 | 14.83 | -7.43% |
| AUM (INR Cr) | 302,273.75 | 313,798.39 | +3.81% |
| Net Worth (INR Cr) | 65,244.09 | 108,297.48 | +65.99% |
| Gross NPA (%) | 4.58% | 4.64% | +6 bps |
| Net NPA (%) | 2.33% | 2.33% | Flat (0 bps) |
| Debt-to-Equity Ratio (x) | 3.82x | 2.14x | -1.68x |
Note on EPS Calculation: Basic EPS dropped QoQ from ₹16.02 to ₹14.83 despite higher PAT due to the share count expansion following the preferential share allotment of 471.12 million shares to MUFG Bank Ltd on April 8, 2026.
Table 4: Business Segment Performance (AUM Breakdown)
Source: Investor Presentation Q1 FY27
| Segment | Q1 FY27 (INR Cr) | Share (%) | Q4 FY26 (INR Cr) | Q1 FY26 (INR Cr) | YoY Growth (%) | QoQ Growth (%) |
| Commercial Vehicles | 147,034.28 | 46.86% | 141,666.60 | 123,131.89 | 19.41% | 3.79% |
| Passenger Vehicles | 68,650.23 | 21.88% | 64,413.09 | 56,634.76 | 21.22% | 6.58% |
| Construction Equipment | 12,372.66 | 3.94% | 13,309.51 | 16,535.36 | -25.17% | -7.04% |
| Farm Equipment | 7,030.59 | 2.24% | 6,886.52 | 5,827.48 | 20.65% | 2.09% |
| MSME Loans | 41,962.42 | 13.37% | 41,244.61 | 38,824.26 | 8.08% | 1.74% |
| Two Wheelers | 17,813.84 | 5.68% | 17,413.98 | 15,856.30 | 12.35% | 2.30% |
| Gold Loans | 7,513.72 | 2.39% | 6,622.48 | 5,154.05 | 45.78% | 13.46% |
| Personal Loans | 11,420.65 | 3.64% | 10,716.96 | 10,284.91 | 11.04% | 6.57% |
| Total AUM | 313,798.39 | 100.00% | 302,273.75 | 272,249.01 | 15.26% | 3.81% |
Table 5: Borrowing Mix
Source: Investor Presentation Q1 FY27
| Borrowing Source | Q1 FY27 (INR Cr) | Share (%) | Q4 FY26 (INR Cr) | Q1 FY26 (INR Cr) | YoY Growth (%) |
| Non-Convertible Debentures (NCDs) | 33,020.00 | 14.19% | 39,610.00 | 39,610.00 | -16.64% |
| Public Deposits | 72,070.00 | 30.98% | 69,480.00 | 63,030.00 | 14.34% |
| Securitization | 33,110.00 | 14.23% | 38,460.00 | 38,820.00 | -14.71% |
| Subordinated Debts | 2,420.00 | 1.04% | 2,420.00 | 2,480.00 | -2.42% |
| Term Loans (Banks) | 45,050.00 | 19.36% | 49,680.00 | 47,190.00 | -4.53% |
| Working Capital Demand Loan | 0.00 | 0.00% | 1,520.00 | 2,140.00 | -100.00% |
| External Commercial Bonds (ECB) | 13,110.00 | 5.63% | 13,260.00 | 15,750.00 | -16.76% |
| ECB Loans | 33,860.00 | 14.56% | 36,260.00 | 33,810.00 | 0.15% |
| Total Borrowings | 232,640.00 | 100.00% | 250,690.00 | 242,910.00 | -4.23% |
Table 6: Asset Quality and Provision Analysis
Source: Official Stock Exchange Filings & Investor Update
| Stage / Metric | Q1 FY27 (INR Cr) | Q4 FY26 (INR Cr) | Q1 FY26 (INR Cr) | YoY Growth (%) | QoQ Growth (%) |
| Gross Stage 3 Assets | 14,478.48 | 13,743.27 | 12,199.48 | 18.68% | 5.35% |
| Stage 3 ECL Provision | 7,382.16 | 6,917.82 | 5,406.19 | 36.55% | 6.71% |
| Net Stage 3 Assets | 7,096.32 | 6,825.45 | 6,793.29 | 4.46% | 3.97% |
| Gross Stage 3 Ratio (%) | 4.64% | 4.58% | 4.53% | +11 bps | +6 bps |
| Net Stage 3 Ratio (%) | 2.33% | 2.33% | 2.57% | -24 bps | 0 bps |
| Stage 3 Coverage Ratio (PCR) | 50.99% | 50.34% | 44.31% | +668 bps | +65 bps |
| Gross Stage 2 Assets | 21,702.86 | 20,746.33 | 19,615.27 | 10.64% | 4.61% |
| Stage 2 ECL Provision | 1,689.34 | 1,664.91 | 1,618.70 | 4.36% | 1.47% |
| Gross Stage 1 Assets | 275,831.42 | 265,726.75 | 237,412.29 | 16.18% | 3.80% |
| Stage 1 ECL Provision | 9,506.82 | 9,181.18 | 8,267.52 | 14.99% | 3.55% |
Table 7: Key Valuation Metrics
Data calculated as of market close on reporting date / official filings
| Metric | Value / Status |
| Market Capitalization | Data was not available at the time of writing. |
| Price-to-Earnings (P/E) Ratio | Data was not available at the time of writing. |
| Price-to-Book (P/B) Ratio | Data was not available at the time of writing. |
| Dividend Yield | Data was not available at the time of writing. |
| Book Value Per Share (BVPS) | ₹461.78 |
| 52-Week High / Low | Data was not available at the time of writing. |
| Enterprise Value (EV) | Data was not available at the time of writing. |
| Total Shares Outstanding | 2,352.90 million |
Detailed Financial Analysis
Revenue and Profitability Analysis
Shriram Finance delivered double-digit revenue expansion during Q1 FY27, backed by consistent loan portfolio growth and lower funding expenses. Total interest income rose 15.54% YoY to ₹12,909.97 crore. Higher yielding segments such as pre-owned commercial vehicle financing, passenger vehicle credit, and gold loans drove this expansion. Total revenue from operations reached ₹13,393.68 crore, compared to ₹11,535.63 crore in Q1 FY26.
A significant highlight of the income statement is the 3.64% YoY drop in finance costs to ₹5,204.28 crore. The primary catalyst was the ₹39,617.98 crore equity primary allotment completed in April 2026. Shriram Finance deployed ₹15,000 crore toward retiring high-cost debt borrowings and ₹17,833.24 crore directly into onward retail lending. Consequently, Net Interest Income (NII) surged 33.67% YoY to ₹8,055.70 crore.
  +-----------------------------------------------------------------------+
  |              NET INTEREST INCOME (NII) TRAJECTORY                     |
  |                                                                       |
  |  Q1 FY26: ₹6,026.43 Cr  ==========================>                  |
  |  Q4 FY26: ₹6,994.08 Cr  ===============================+33.67%        |
  |  Q1 FY27: ₹8,055.70 Cr  =====================================>        |
  +-----------------------------------------------------------------------+
Net profit after tax (PAT) jumped 59.79% YoY to ₹3,444.56 crore. Net profit margins expanded to 25.68%, up from 18.68% in the same quarter last year. This margin expansion reflects both operating leverage and reduced interest expense burdens.
Net Interest Margin (NIM) and Cost Structure
Net Interest Margins (NIM) expanded significantly to 9.04% in Q1 FY27, up 93 basis points YoY from 8.11% and up 43 basis points QoQ from 8.61%. The equity capital injection helped lower overall interest expenses, while high-yielding loan originations supported average portfolio yields.
  NIM Trend:
  Q1 FY26: 8.11%
  Q4 FY26: 8.61%
  Q1 FY27: 9.04%  <--- Expansion driven by reduced debt burden
Operating expenditure rose 8.91% YoY to ₹2,080.86 crore, driven primarily by employee costs, which increased to ₹1,142.26 crore. Despite this expenditure growth, Shriram Finance improved its Cost-to-Income ratio to 25.48% (down from 29.29% in Q1 FY26). Core operating profit grew 45.17% YoY to ₹5,974.84 crore.
Loan Book Dynamics and Segmental Growth Drivers
Total Assets Under Management (AUM) reached ₹313,798.39 crore as of June 30, 2026, representing a 15.26% YoY increase.
                       AUM BREAKDOWN (Q1 FY27)
                       -----------------------
  [Commercial Vehicles]  ====================================> 46.86%
  [Passenger Vehicles]   =================> 21.88%
  [MSME Credit]          ============> 13.37%
  [Two Wheelers]         =====> 5.68%
  [Construction Equip.]  ===> 3.94%
  [Personal Loans]       ===> 3.64%
  [Gold Loans]           ==> 2.39%
  [Farm Equipment]       ==> 2.24%
Commercial Vehicle (CV) Financing: Remains the core pillar, accounting for ₹147,034.28 crore (46.86% of total AUM). Pre-owned CV demand was supported by freight movement across regional economic corridors.
Passenger Vehicle Financing: Expanded 21.22% YoY to ₹68,650.23 crore, benefiting from rising personal mobility demand in Tier-2 and Tier-3 markets.
Gold Loans: Experienced rapid growth, surging 45.78% YoY to ₹7,513.72 crore. Gold loans serve as a quick liquidity option for rural and semi-urban borrowers.
Farm & Construction Equipment: Construction equipment financing declined 25.17% YoY to ₹12,372.66 crore. Conversely, farm equipment credit grew 20.65% YoY to ₹7,030.59 crore, buoyed by favorable monsoon expectations.
MSME and Two-Wheeler Loans: MSME lending grew 8.08% YoY to ₹41,962.42 crore, while Two-Wheeler credit grew 12.35% YoY to ₹17,813.84 crore.
Asset Quality, Credit Cost, and Provisions
Gross Stage 3 Assets rose slightly to 4.64% (₹14,478.48 crore), compared to 4.58% in Q4 FY26 and 4.53% in Q1 FY26. The minor increase reflects normal seasonal softness typical during first quarters in rural asset financing.
Net Stage 3 Assets remained stable at 2.33% QoQ, down from 2.57% in Q1 FY26. Stage 3 Provision Coverage Ratio (PCR) improved to 50.99%, up from 44.31% a year ago.
  Provision Coverage Ratio (PCR) Trend:
  Q1 FY26: 44.31%
  Q4 FY26: 50.34%
  Q1 FY27: 50.99%  <--- Enhanced balance sheet strength
Impairment losses on financial instruments increased 13.81% YoY to ₹1,463.26 crore. Credit costs remained contained within management’s expected range.
Capital Adequacy, Leverage, and Liquidity Profile
The primary allotment of 471.12 million shares to MUFG Bank Ltd transformed Shriram Finance’s balance sheet structure. Net worth reached ₹108,297.48 crore, up from ₹65,244.09 crore at the end of FY26.
Capital Adequacy Ratio (CRAR): Expanded to 34.17% (Tier I capital standing at 33.40%), well above the Reserve Bank of India’s regulatory threshold of 15%.
Debt-to-Equity Leverage: Decreased from 3.82x in Q4 FY26 to 2.14x in Q1 FY27.
Liquidity Position: The Liquidity Coverage Ratio (LCR) stood at 262.54%, indicating surplus liquidity buffers.
  +-----------------------------------------------------------------------+
  |              CAPITAL ADEQUACY RATIO (CRAR) TRANSFORMED                |
  |                                                                       |
  |  Q1 FY26: 20.79%  =================================>                  |
  |  Q4 FY26: 20.40%  =================================>                  |
  |  Q1 FY27: 34.17%  ==================================================> |
  +-----------------------------------------------------------------------+
Pan-India Branch Footprint and Distribution Network
Shriram Finance operates a physical network of 3,225 branch offices across India, supported by 78,902 employees and 59,219 field team members.
                      BRANCH DISTRIBUTION NETWORK
                      ---------------------------
  [Semi-Urban & Rural] =======================================> 2,042 Branches
  [Urban Centers]      ======================> 821 Branches
  [Metro Locations]    ===========> 362 Branches
Semi-Urban and Rural Centers: 2,042 branches (63.3% of network).
Urban Locations: 821 branches (25.5% of network).
Metro Centers: 362 branches (11.2% of network).
This network allows Shriram Finance to capture rural demand while cross-selling financial products.
Macro Environment, RBI Policy, and Strategic Position
The macroeconomic background for Indian retail lending during Q1 FY27 remained generally supportive, characterized by stable rural consumption and continuous government infrastructure spending. Shriram Finance’s focal segments—pre-owned commercial vehicles, two-wheelers, and MSME credit—are closely linked to ground-level economic activity.
The Reserve Bank of India (RBI) maintains a focus on credit risk standards and asset quality disclosures across non-banking financial companies. Shriram Finance’s balance sheet deleveraging, lowered debt-to-equity ratio, and increased provision coverage ratio position it well within regulatory frameworks.
The strategic partnership with MUFG Bank Ltd opens up long-term capital channels, foreign currency borrowing options, and potential cross-border corporate synergies.
Strategic SWOT Analysis
================================================================================
                          SHRIRAM FINANCE SWOT ANALYSIS
================================================================================

 [STRENGTHS]                                [WEAKNESSES]
 • Market leader in pre-owned CVs           • Higher Stage 3 NPA relative to
 • Unmatched rural branch network             pure-play retail commercial banks
 • Strong CRAR of 34.17%                    • Exposure to cyclical cash flows in
 • Strategic backing from MUFG Bank           small road transport operators

 [OPPORTUNITIES]                            [THREATS]
 • Cross-selling gold and personal loans    • Potential rural distress from monsoon
 • Expanding digital lending capabilities     irregularities
 • Lower borrowing costs via debt ratings   • Increasing competition in retail
   upgrades                                   and MSME lending from mainstream banks
================================================================================
Investment Analysis: Bull Case vs. Bear Case
Bull Case Highlights
Strengthened Capital Structure: The ₹39,617.98 crore equity infusion boosts book value to ₹461.78 per share and provides substantial long-term lending headroom.
Margin Expansion: NIM expanded to 9.04%, driven by debt paydowns and lower reliance on high-cost borrowings.
Diversified Growth: Strong YoY growth across gold loans (+45.78%), passenger vehicles (+21.22%), and farm equipment (+20.65%) reduces single-segment risk.
Enhanced Provisioning: Stage 3 PCR increased to 50.99%, bolstering balance sheet resilience.
Bear Case Highlights
Minor NPA Increase: Gross Stage 3 NPA ticked up to 4.64%, reflecting seasonal stress among small road transport operators.
EPS Dilution: Equity expansion increased total share count to 2.35 billion shares, moderating basic EPS growth in the near term.
Construction Segment Softness: Construction equipment AUM declined 25.17% YoY due to temporary project execution delays.



