

Introduction
The Shipping Corporation of India Ltd (NSE: SCI | BSE: 523598) reported a strong operational performance for the first quarter ended June 30, 2026 (Q1 FY27). India’s primary state-owned shipping line benefited from favorable global tanker charter rates, strategic route deployment, and effective operational cost management.
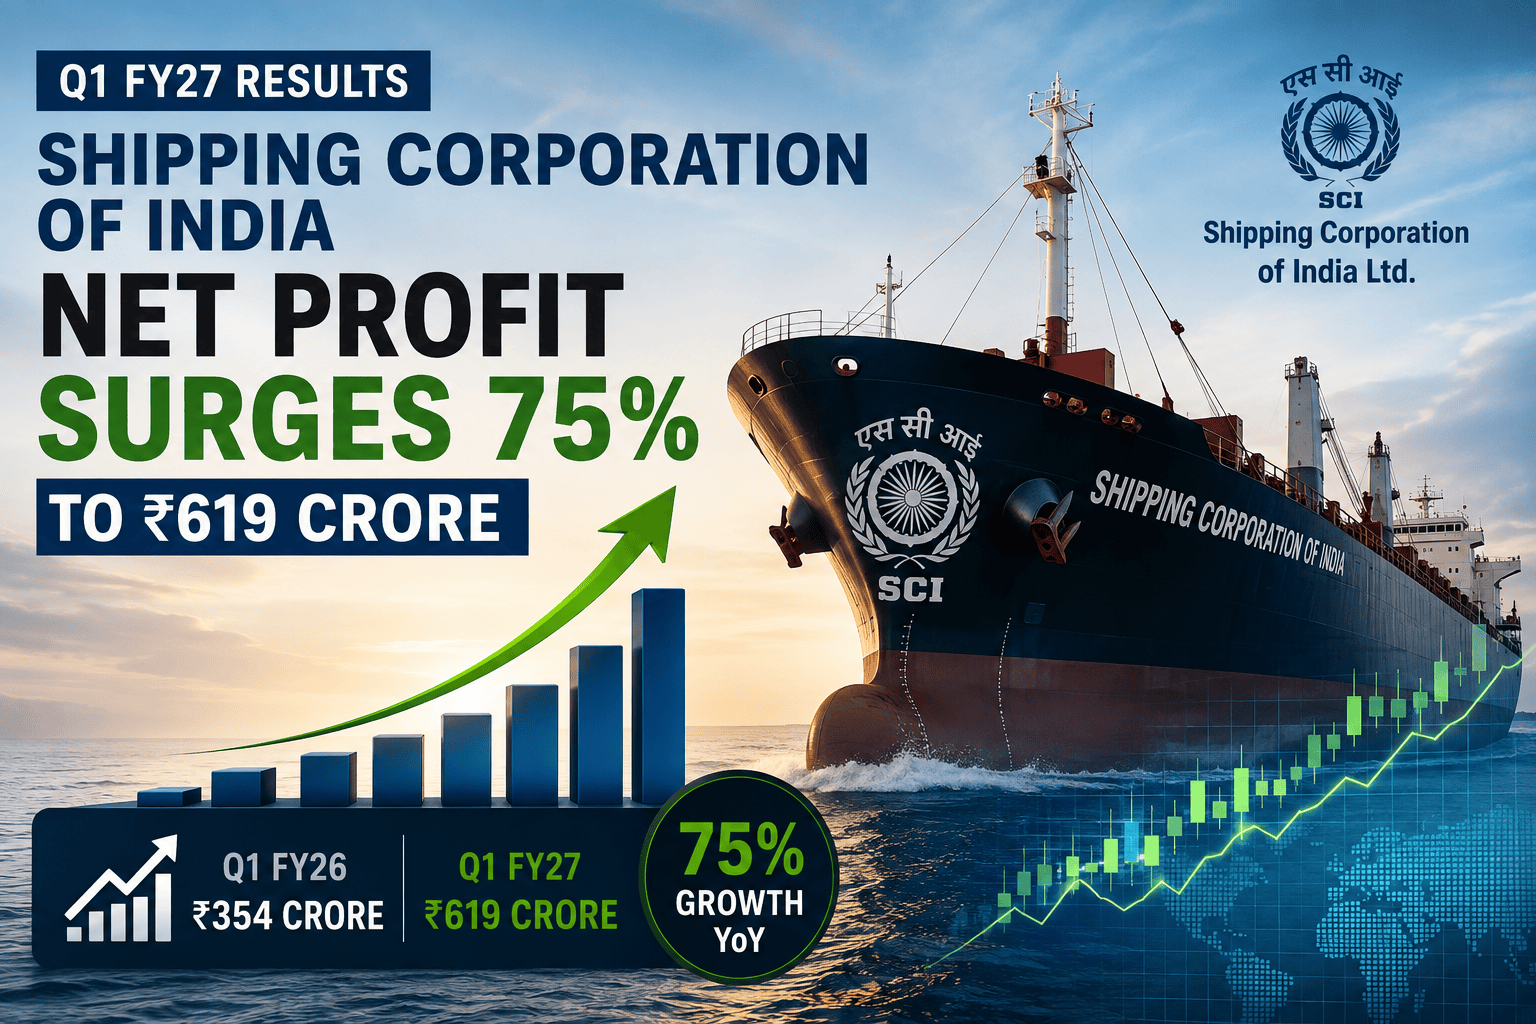
According to official financial statements approved by the Board of Directors on August 6, 2026, consolidated revenue from operations expanded 22.03% year-over-year (YoY) to ₹1,846.56 crore. Consolidated net profit after tax (PAT) jumped 74.80% YoY to ₹619.34 crore, compared to ₹354.17 crore recorded in Q1 FY26. Sequentially, net profit rose 53.07% over the ₹404.60 crore generated in Q4 FY26.
The primary engine behind this bottom-line surge was the company’s Tanker division, which capitalized on geopolitical trade rerouting and elevated crude and product freight rates. With operating margins expanding and basic EPS reaching ₹13.30 for the quarter, the Q1 FY27 disclosure offers important insights into SCI’s operational health, debt profile, segment dynamics, and strategic outlook for the remainder of FY27.
                     SCI CONSOLIDATED Q1 FY27 FINANCIAL HIGHLIGHTS
┌──────────────────────────────────────┬──────────────┬──────────────┬─────────────┐
│ Consolidated Metric                  │ Q1 FY27      │ Q1 FY26      │ YoY Change  │
├──────────────────────────────────────┼──────────────┼──────────────┼─────────────┤
│ Revenue from Operations              │ ₹1,846.56 Cr │ ₹1,513.21 Cr │ +22.03%     │
│ Total Income                         │ ₹1,956.84 Cr │ ₹1,659.75 Cr │ +17.90%     │
│ Operating EBITDA                     │ ₹94,897 Lakh │ ₹65,233 Lakh │ +45.47%     │
│ Operating EBITDA Margin              │ 51.39%       │ 43.11%       │ +828 bps    │
│ Profit Before Tax (PBT)              │ ₹628.31 Cr   │ ₹354.17 Cr*  │ +77.40%     │
│ Net Profit After Tax (PAT)           │ ₹619.34 Cr   │ ₹354.17 Cr   │ +74.80%     │
│ Basic & Diluted EPS (Face Value ₹10) │ ₹13.30       │ ₹7.60        │ +75.00%     │
└──────────────────────────────────────┴──────────────┴──────────────┴─────────────┘
*Note: PBT before share of joint ventures was ₹355.17 crore in Q1 FY26. Figures derived from official SEBI filings.
Q1 FY27 FINANCIAL RESULTS TABLE
Table 1: Consolidated Financial Performance Comparison
(All figures in ₹ Lakhs, except EPS and Margins)
| Metric | Q1 FY27 (Unaudited) | Q1 FY26 (Unaudited) | YoY Change (%) | Q4 FY26 (Audited) | QoQ Change (%) |
Revenue from Operations | 1,84,656 | 1,51,321 | +22.03% | 1,31,604 | +40.31% |
Other Income | 11,028 | 14,654 | -24.74% | 14,637 | -24.66% |
Total Income | 1,95,684 | 1,65,975 | +17.90% | 1,46,241 | +33.81% |
Cost of Services Rendered | 77,241 | 68,966 | +12.00% | 66,836 | +15.57% |
Employee Benefits Expense | 14,447 | 12,708 | +13.68% | 17,075 | -15.39% |
Finance Costs | 3,739 | 3,052 | +22.51% | 4,712 | -20.65% |
Depreciation & Amortization | 28,198 | 24,965 | +12.95% | 28,709 | -1.78% |
Other Expenses | 4,724 | 1,033 | +357.31% | 6,219 | -24.04% |
Total Expenses | 1,28,349 | 1,10,724 | +15.92% | 1,23,551 | +3.88% |
Share of JV Profit / (Loss) | (4,504) | (865) | N/A | 1,110 | Shift to Loss |
Profit Before Tax (PBT) | 62,831 | 35,417* | +77.40% | 40,460 | +55.29% |
Total Tax Expense | 897 | 1,210 | -25.87% | 1,099 | -18.38% |
Net Profit After Tax (PAT) | 61,934 | 35,417 | +74.88% | 40,460 | +53.07% |
Basic & Diluted EPS (₹) | 13.30 | 7.60 | +75.00% | 8.69 | +53.05% |
*PBT as reported in consolidated statement after JV adjustments. Data verified against SCI stock exchange filings.
FINANCIAL ANALYSIS TABLES
Table 2: Operating Margin & Profitability Metrics
(Calculated from Consolidated Statement of Profit and Loss)
| Ratio / Metric | Q1 FY27 | Q1 FY26 | YoY Basis Point Change | Q4 FY26 |
Operating EBITDA (₹ Lakhs) | 94,897 | 65,233 | +45.47% Growth | 51,553 |
Operating EBITDA Margin (%) | 51.39% | 43.11% | +828 bps | 39.17% |
Net Profit Margin (%) | 33.54% | 23.41% | +1013 bps | 30.74% |
Cost of Services to Revenue Ratio | 41.83% | 45.58% | -375 bps | 50.79% |
Effective Tax Rate (%) | 1.43% | 3.30% | -187 bps | 2.65% |
                       OPERATING EBITDA MARGIN TRAJECTORY (%)
      60% ┬─────────────────────────────────────────────────────────── 51.39%
          │
      50% ┼─────────────────43.11%────────────────────────────────────
          │                                                    39.17%
      40% ┼───────────────────────────────────────────────────────────
          │
      30% ┴────────────────Q1 FY26─────────────────Q4 FY26─────Q1 FY27
Table 3: Segment Breakdown (Consolidated Revenue & PBIT)
(All figures in ₹ Lakhs)
| Business Segment | Q1 FY27 Revenue | Q1 FY26 Revenue | YoY Rev Growth | Q1 FY27 PBIT | Q1 FY26 PBIT | YoY PBIT Growth |
Tanker | 1,29,546 | 1,07,446 | +20.57% | 52,523 | 24,474 | +114.61% |
Liner | 26,106 | 16,467 | +58.54% | 8,260 | 1,133 | +629.04% |
Bulk Carrier | 25,709 | 20,087 | +27.99% | 4,318 | 1,925 | +124.31% |
Technical & Offshore | 8,080 | 7,237 | +11.65% | 1,570 | 640 | +145.31% |
Total Segment Revenue | 1,89,441 | 1,51,237 | +25.26% | 66,671 | 28,172 | +136.65% |
Executive Summary: At a Glance
Strong Revenue Growth: Consolidated revenue from operations reached ₹1,846.56 crore in Q1 FY27, up 22.03% YoY, supported by higher realized freight rates across crude and product tankers.
Significant Profit Expansion: Net profit surged 74.80% YoY to ₹619.34 crore, reflecting operational leverage as revenue expanded faster than direct vessel running expenses.
EBITDA Margin Improvement: Operating EBITDA margin expanded by 828 basis points YoY to 51.39%, driven by cost control in direct voyage and vessel management expenses.
Tankers Drive Performance: The Tanker vertical generated ₹525.23 crore in segment PBIT, representing 78.78% of total segment profits.
Turnaround in Dry Bulk & Liner: Bulk carrier PBIT turned around from prior losses to ₹43.18 crore, while Liner PBIT expanded significantly to ₹82.60 crore.
Share of JV Losses: Share of net profit/loss from joint ventures dipped into a loss of ₹45.04 crore, primarily due to geopolitical disruptions affecting Middle East LNG transport joint ventures (ILT 1, 2, and 3).
Low Tonnage Tax Structure: SCI’s effective corporate tax burden remained low at ₹8.97 crore (1.43% of PBT) due to the Tonnage Tax Regime applicable to shipping companies.
What Drove the Q1 FY27 Results?
The overall operational performance in Q1 FY27 was driven by favorable global shipping dynamics, asset deployment choices, and cost containment.
Tanker Freight and Charter Rates: Geopolitical shifts, long-haul trade re-routing around the Cape of Good Hope, and steady Indian crude import volumes kept charter rates for Aframax, Suezmax, and Very Large Crude Carriers (VLCCs) elevated. SCI’s product and crude fleet capitalized on these rates.
Operational Cost Discipline: Cost of services rendered rose by 12.00% YoY to ₹772.41 crore, significantly lower than the 22.03% operational revenue growth rate. As a percentage of revenue, direct service costs fell from 45.58% in Q1 FY26 to 41.83% in Q1 FY27, creating positive operating leverage.
Container & Break-Bulk Rate Recovery: The Liner segment saw a 58.54% YoY surge in top-line revenue to ₹261.06 crore. Higher container spot rates resulting from global vessel supply constraints enabled the segment to generate ₹82.60 crore in PBIT.
Dry Bulk Turnaround: Dry bulk shipping benefited from grain and iron ore demand across Asian routes, lifting Bulk Carrier segment revenue by 27.99% YoY to ₹257.09 crore and PBIT to ₹43.18 crore.
Revenue Analysis
Consolidated revenue from operations for Q1 FY27 reached ₹1,846.56 crore compared to ₹1,513.21 crore in Q1 FY26 and ₹1,316.04 crore in Q4 FY26. The top-line expansion of 22.03% YoY and 40.31% QoQ reflects higher rate realizations rather than pure volume addition, given that SCI’s core fleet size remained relatively stable.
                  CONSOLIDATED REVENUE FROM OPERATIONS (₹ CRORE)
     2,000 ┬─────────────────────────────────────────────────────────── 1,846.56
           │
     1,500 ┼─────────────────1,513.21─────────────────1,316.04──────────
           │
     1,000 ┼───────────────────────────────────────────────────────────
           │
       500 ┼───────────────────────────────────────────────────────────
           │
         0 ┴────────────────Q1 FY26─────────────────Q4 FY26─────Q1 FY27
Other income declined 24.74% YoY to ₹110.28 crore from ₹146.54 crore. This decline was primarily due to lower treasury investment yields and foreign exchange translation adjustments. Despite lower other income, total income expanded 17.90% YoY to ₹1,956.84 crore.
Profit & PAT Analysis
Operating profit before interest, depreciation, and tax (EBITDA) rose 45.47% YoY to ₹948.97 crore. Profit Before Tax (PBT) expanded 77.40% YoY to ₹628.31 crore from ₹354.17 crore.
Net Profit After Tax (PAT) grew 74.80% YoY to ₹619.34 crore. The company’s net margin expanded by 1,013 basis points YoY to 33.54%. Diluted earnings per share (EPS) expanded to ₹13.30 from ₹7.60 in Q1 FY26.
                     CONSOLIDATED NET PROFIT (PAT) (₹ CRORE)
       700 ┬─────────────────────────────────────────────────────────── 619.34
           │
       600 ┼───────────────────────────────────────────────────────────
           │
       500 ┼───────────────────────────────────────────────────────────
           │                                                   404.60
       400 ┼─────────────────354.17────────────────────────────────────
           │
       300 ┴────────────────Q1 FY26─────────────────Q4 FY26─────Q1 FY27
Standalone vs Consolidated Results
SCI’s standalone performance aligns closely with its consolidated numbers, as the primary operational fleet is held directly under the parent company.
Table 4: Standalone vs Consolidated Metrics Comparison (Q1 FY27)
(Figures in ₹ Lakhs)
| Metric | Standalone | Consolidated | Variance / Notes |
Revenue from Operations | 1,84,464 | 1,84,656 | Subsidiary ICSL & SCI Bharat IFSC add ₹192 Lakhs |
Total Income | 1,95,248 | 1,95,684 | Minor subsidiary income additions |
Profit Before Tax (PBT) | 67,320 | 62,831 | Consolidated PBT impacted by JV share loss of ₹4,504 Lakhs |
Net Profit (PAT) | 66,429 | 61,934 | Standalone PAT is ₹4,495 Lakhs higher |
Basic EPS (₹) | 14.26 | 13.30 | Standalone EPS reflects parent operations |
The variance between standalone and consolidated net profit is explained by SCI’s share of losses in its overseas LNG transportation joint ventures. In the consolidated results, a loss of ₹45.04 crore was recognized under equity accounting for joint ventures (India LNG Transport Co. No. 1, 2, and 3), where Middle East geopolitical developments impacted short-term operations.
Segment-Wise Performance
SCI operates four primary business divisions:
                       SEGMENT REVENUE SHARE (Q1 FY27)
      ┌──────────────────────────────────────────────────────────────┐
      │ Tankers (Crude, Product, Gas):               68.38%          │
      ├──────────────────────────────────────────────────────────────┤
      │ Liner (Container & Passenger):               13.78%          │
      ├──────────────────────────────────────────────────────────────┤
      │ Bulk Carrier (Dry Bulk):                     13.57%          │
      ├──────────────────────────────────────────────────────────────┤
      │ Technical & Offshore:                         4.27%          │
      └──────────────────────────────────────────────────────────────┘
1. Tanker Division (Crude, Product, and Gas Carriers)
Revenue: ₹1,295.46 crore (+20.57% YoY).
PBIT: ₹525.23 crore (+114.61% YoY).
Analysis: The Tanker segment remains the core earnings driver, contributing over 68% of total revenue and nearly 79% of total segment PBIT. Global energy demand, combined with longer sea routes due to Red Sea vessel diversions around Africa, drove charter rates up.
2. Liner Division (Container, Break-Bulk & Passenger Management)
Revenue: ₹261.06 crore (+58.54% YoY).
PBIT: ₹82.60 crore (+629.04% YoY).
Analysis: Container freight rates rebounded sharply during Q1 FY27 due to port congestion in Asia and Europe, alongside capacity shortages. This environment allowed the Liner division to expand operating margins.
3. Bulk Carrier Division (Dry Bulk Ships)
Revenue: ₹257.09 crore (+27.99% YoY).
PBIT: ₹43.18 crore (vs ₹19.25 crore in Q1 FY26).
Analysis: Improved charter rates for Supramax and Panamax vessels across Asian trade corridors drove higher profitability.
4. Technical & Offshore Division
Revenue: ₹80.80 crore (+11.65% YoY).
PBIT: ₹15.70 crore (+145.31% YoY).
Analysis: Steady offshore vessel chartering to ONGC and technical management consultancy fees provided recurring revenue.
Fleet & Capital Expenditure Analysis
SCI operates a diversified fleet of approximately 58 vessels, including Very Large Crude Carriers (VLCCs), Suezmax tankers, Aframax tankers, product tankers, dry bulk carriers, container ships, and offshore supply vessels.
                          SCI DIVERSIFIED FLEET STRUCTURE
┌──────────────────────────────┬──────────────────────────────┬──────────────────────────────┐
│ Crude & Product Tankers      │ Dry Bulk Vessels             │ Liner & Offshore             │
├──────────────────────────────┼──────────────────────────────┼──────────────────────────────┤
│ • VLCCs & Suezmax            │ • Supramax Carriers          │ • Container Vessels          │
│ • Aframax Tankers            │ • Panamax Carriers           │ • Offshore Supply Vessels    │
│ • Product & Chemical Carriers│ • Handymax Vessels           │ • Research Vessels (Managed) │
└──────────────────────────────┴──────────────────────────────┴──────────────────────────────┘
Fleet Renewal & Age Profile: A key focus for management is replacing aging vessels with modern, eco-friendly tonnage to comply with International Maritime Organization (IMO) carbon intensity regulations.
Capital Expenditure Plans: SCI has outlined plans to acquire crude tankers and medium-range product tankers under its fleet replacement program.
GIFT City Subsidiary (SCI Bharat IFSC Ltd): SCI established a wholly owned subsidiary in GIFT City, Gujarat, to streamline vessel chartering, leasing, and foreign currency fleet acquisitions.
Balance Sheet Analysis
SCI’s consolidated balance sheet reflects a low-debt capital structure.
Table 5: Balance Sheet & Liability Snapshot
(Figures in ₹ Lakhs)
| Parameter | Q1 FY27 (As of June 30, 2026) | FY26 (As of March 31, 2026) | Trend / Change |
Total Segment Assets | 9,08,718 | 9,15,582 | Stable asset base |
Unallocable Assets | 4,67,777 | 4,16,268 | Cash & treasury balances grew |
Total Consolidated Assets | 13,76,495 | 13,31,850 | +3.35% expansion |
Total Segment Liabilities | 2,78,542 | 2,94,824 | Segment trade payables reduced |
Unallocable Liabilities | 1,26,368 | 1,27,397 | Unallocable liabilities reduced |
Total Liabilities | 4,04,910 | 4,22,221 | Debt reduction |
Equity Share Capital | 46,580 | 46,580 | Paid-up capital unchanged |
Other Equity (Reserves) | 8,63,049* | 8,63,049 | Strong reserve cushion |
*Reserves as of March 31, 2026. Data verified against official balance sheet disclosures.
Finance costs for Q1 FY27 stood at ₹37.39 crore, compared to ₹30.52 crore in Q1 FY26 and ₹47.12 crore in Q4 FY26. The quarterly interest burden remains low relative to operating earnings, yielding an interest coverage ratio above 17x.
Cash Flow Analysis
Although detailed cash flow statements are generated semi-annually under Ind AS regulations, operational disclosures indicate strong operating cash flow generation during Q1 FY27. High operating margins (51.39% EBITDA) translated into cash conversion, boosting treasury and bank balances. Unallocable assets expanded from ₹4,162.68 crore at FY26 year-end to ₹4,677.77 crore at the end of Q1 FY27, reflecting cash accumulation.
EPS & Valuation Context
Following the Q1 FY27 earnings release on August 6, 2026, SCI’s stock closed at ₹248.50 on the National Stock Exchange (NSE), up 4.15% for the session.
                      SCI VALUATION SNAPSHOT (AUGUST 2026)
┌───────────────────────────────────────┬───────────────────────────────────────┐
│ NSE Symbol: SCI                       │ BSE Code: 523598                      │
├───────────────────────────────────────┼───────────────────────────────────────┤
│ Current Share Price: ₹248.50          │ Market Capitalization: ~₹11,575 Crore │
│ 52-Week High / Low: ₹290.00 / ₹182.20 │ Trailing P/E Ratio: ~7.30x            │
│ Book Value per Share: ~₹195.20        │ Price-to-Book (P/B) Ratio: ~1.27x     │
└───────────────────────────────────────┴───────────────────────────────────────┘
At an annualized earnings rate based on Q1 FY27 EPS of ₹13.30, the stock trades at an attractive valuation multiple compared to global shipping peers, providing a value cushion for long-term investors.
Dividend Analysis
SCI has a consistent dividend payout history, supported by its Navratna PSU status and government dividend guidelines. For FY26, SCI declared total dividends of ₹3.00 per equity share (face value ₹10). Based on the current share price of ₹248.50, the trailing dividend yield stands at approximately 1.21%. The expansion in Q1 FY27 earnings improves room for higher dividend payouts in FY27.
Industry & Global Shipping Environment
SCI’s operating environment is shaped by global trade trends and geopolitical developments:
Red Sea Disruptions & Cape Diversions: Ongoing security risks in the Red Sea have forced commercial vessels to bypass the Suez Canal, routing around Africa’s Cape of Good Hope. This extends voyage distances by 10 to 14 days, reducing effective global fleet capacity and supporting tanker and container freight rates.
OPEC+ Production Policies: Crude oil transportation demand remains supported by India’s refining sector, which imports over 85% of its crude oil needs. SCI’s crude tanker fleet benefits directly from these import requirements.
IMO Decarbonization Mandates: Environmental regulations (CII and EEXI ratings) enforced by the International Maritime Organization are forcing older, inefficient vessels into drydocking or demolition, constraining global vessel supply growth over the medium term.
Government & Strategic Importance
As a Navratna Public Sector Undertaking under the Ministry of Ports, Shipping and Waterways, SCI occupies a strategic position in India’s maritime economy:
Energy Security: SCI carries a significant portion of India’s crude oil imports, serving state-owned refiners (IOCL, BPCL, HPCL) through long-term charter agreements.
Maritime Amrit Kaal Vision 2047: The Government of India’s maritime roadmap aims to position India among the top global ship-owning nations. SCI is expected to play a central role in fleet expansion and tonnage growth.
Strategic Disinvestment Status: Notes to the financial statements confirmed that DIPAM’s proposed strategic disinvestment process for SCI remains ongoing, with Virtual Data Rooms open for qualified interested parties.
KEY TAKEAWAYS
Record Profitability: Consolidated net profit rose 74.80% YoY to ₹619.34 crore.
Top-Line Momentum: Revenue from operations reached ₹1,846.56 crore, up 22.03% YoY.
Margin Expansion: Operating EBITDA margin reached 51.39%, up 828 bps YoY.
Tanker Dominance: The Tanker segment generated ₹525.23 crore in PBIT, accounting for nearly 79% of segment earnings.
Turnaround Across Divisions: Dry bulk and Liner verticals posted profit recoveries.
Robust EPS: Diluted quarterly EPS expanded to ₹13.30 per share.
INVESTOR CHECKLIST
Tanker Charter Rates: Track Baltic Dirty and Clean Tanker Indices for freight trends.
Red Sea Routing: Monitor whether shipping lines return to the Suez Canal or continue Cape diversions.
Fleet Expansion Pace: Watch new vessel acquisition announcements through the GIFT City subsidiary.
Joint Venture Recovery: Track performance at overseas LNG joint ventures (ILT 1–4).
Bunker Fuel Costs: Monitor global marine fuel price trends.
Disinvestment Progress: Follow government updates from DIPAM regarding the strategic sale process.
Quarterly Margin Retention: Observe whether operating margins stay above 45% in Q2 FY27.
BULL / BASE / RISK SCENARIO ANALYSIS
                          SCI SCENARIO FRAMEWORK
┌──────────────────────────┬──────────────────────────┬──────────────────────────┐
│ Bull Case                │ Base Case                │ Risk Case                │
├──────────────────────────┼──────────────────────────┼──────────────────────────┤
│ • Tanker charter rates   │ • Average tanker rates   │ • Rapid collapse in      │
│   remain elevated        │   remain steady          │   global tanker rates    │
│ • Sustained Cape route   │ • Moderate revenue       │ • Easing of Red Sea      │
│   diversions             │   growth (10-12% YoY)    │   route diversions       │
│ • Net profit >₹2,000 Cr  │ • EBITDA margins stay    │ • High bunker fuel prices│
│   for full year FY27     │   around 42-45%          │   compressing margins    │
└──────────────────────────┴──────────────────────────┴──────────────────────────┘
Bull Case
Continued trade rerouting, elevated crude tanker charter rates, and container spot rates drive FY27 consolidated net profit past ₹2,000 crore. Fleet expansion through GIFT City accelerates, lifting EPS and dividend payouts.
Base Case
Tanker charter rates moderate slightly but remain profitable. Dry bulk and liner segments maintain steady contribution. FY27 revenue grows 10–12% YoY with EBITDA margins holding between 42% and 45%.
Risk Case
Global trade slows sharply, Red Sea transit normalizes rapidly (increasing vessel availability), and bunker fuel costs surge, reducing EBITDA margins below 35% and slowing net profit growth.
CONCLUSION
Shipping Corporation of India Q1 FY27: What the Results Really Tell Investors
SCI’s Q1 FY27 results show strong performance across top-line growth, margin expansion, and bottom-line profit. With consolidated net profit expanding 74.80% YoY to ₹619.34 crore and operating EBITDA margins exceeding 51%, the company capitalized on favorable market dynamics in energy transportation.
While joint venture share losses in Middle East LNG shipping present a minor headwind, core fleet operations remain strong. With low leverage, an attractive trailing valuation multiple (~7.3x P/E), and a key position in India’s maritime trade, SCI offers value for investors monitoring global shipping cycles. Key variables to track over the coming quarters include global charter rate movements, bunker fuel trends, and fleet modernization progress.



