

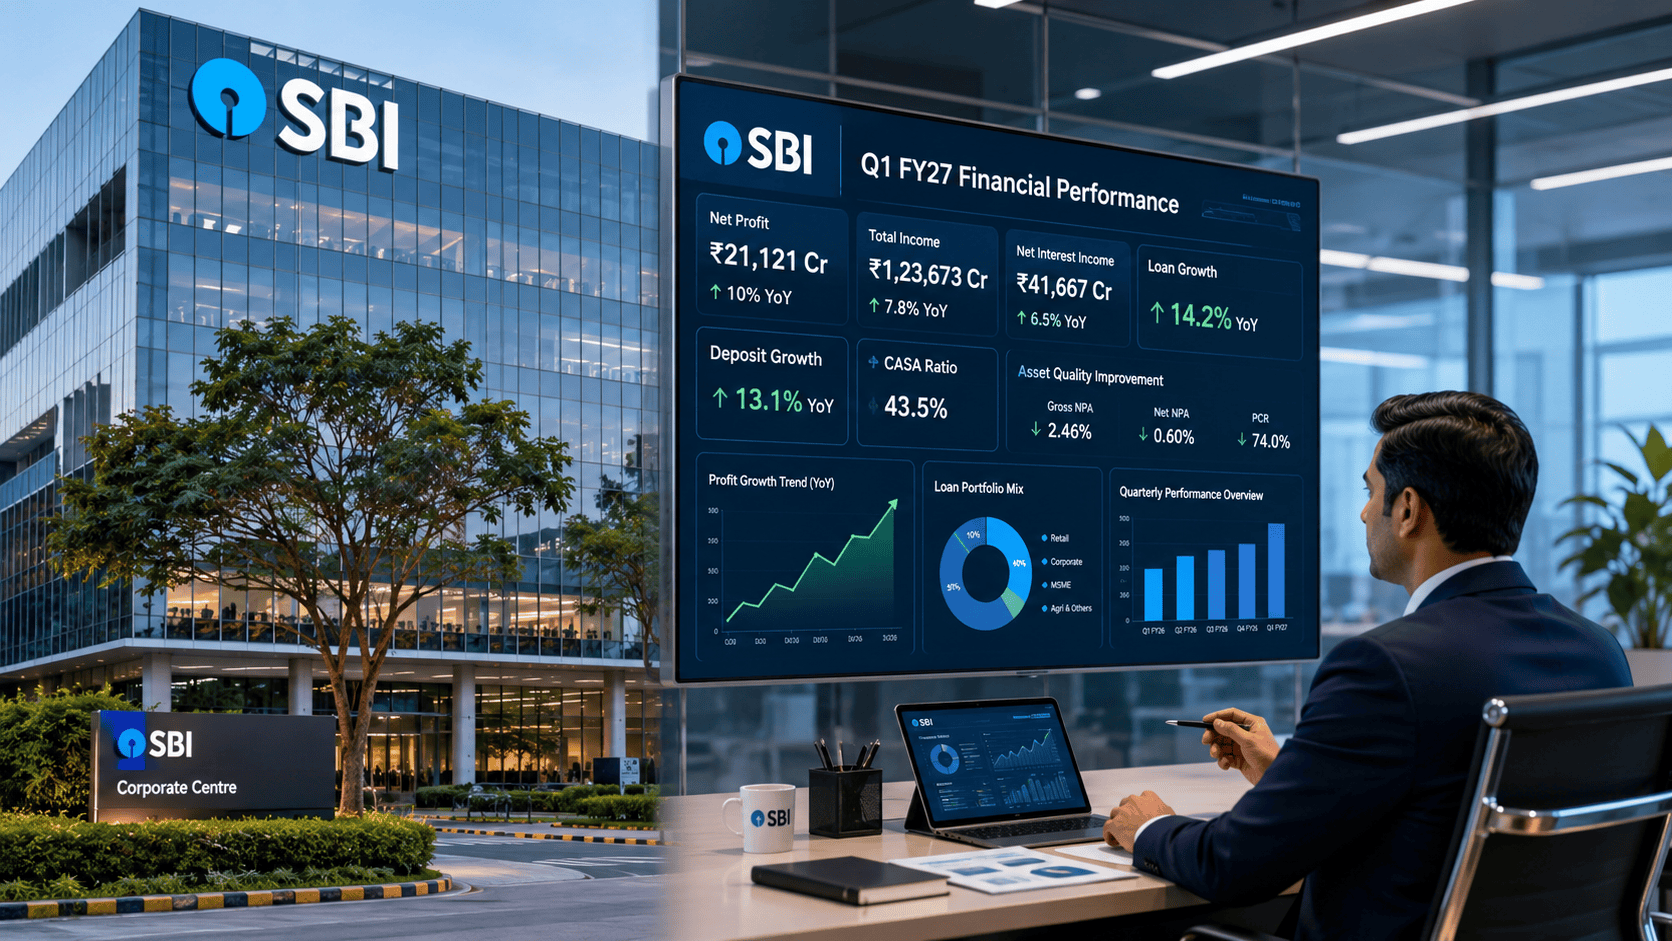
State Bank of India (SBI), the nation’s largest commercial lender, published its unaudited standalone and consolidated financial results for the first quarter of financial year 2026–27 (Q1 FY27) on August 7, 2026. The banking titan delivered a robust performance characterized by resilient bottom-line growth, steady credit expansion, and continuing improvements in overall asset quality.
Standalone net profit for the quarter ended June 30, 2026, surged 10.23% year-over-year to ₹21,121.22 crore, up from ₹19,160.44 crore reported in the corresponding period of the previous fiscal year. On a consolidated basis, net profit after minority interest reached ₹24,113.00 crore, reflecting a 13.73% expansion YoY.
The bank’s pre-provision operating profit (PPOP) grew 9.77% year-over-year to ₹33,529.18 crore, supported by an 8.54% increase in interest earned to ₹1,27,896.46 crore. Asset quality indicators sustained an encouraging trajectory: Gross Non-Performing Assets (GNPA) ratio improved by 36 basis points YoY to 1.47%, while Net Non-Performing Assets (NNPA) dropped to 0.38%. Total standalone deposits crossed the monumental milestone of ₹60 lakh crore, reaching ₹60,05,805.24 crore, while net advances expanded to ₹49,92,003.69 crore.
+-------------------------------------------------------------------------------+
|                        SBI Q1 FY27 PERFORMANCE HIGHLIGHTS                     |
+-------------------------------------------------------------------------------+
|  Standalone Net Profit  | ₹21,121.22 Cr  | +10.23% YoY                         |
|  Consolidated Profit    | ₹24,113.00 Cr  | +13.73% YoY                         |
|  Pre-Provision Profit   | ₹33,529.18 Cr  | +9.77% YoY                          |
|  Total Deposits         | ₹60,05,805 Cr  | +9.73% YoY                          |
|  Gross NPA Ratio        | 1.47%          | Improved by 36 bps YoY              |
|  Net NPA Ratio          | 0.38%          | Improved by 9 bps YoY               |
|  Capital Adequacy (CAR) | 15.67%         | CET-1 at 12.89%                     |
+-------------------------------------------------------------------------------+
Why SBI’s Q1 FY27 Results Matter to Global & Indian Markets
As a Systemically Important Bank (D-SIB) handling over a fifth of India’s banking assets, SBI’s quarterly earnings offer an indispensable barometer for the health of the Indian macroeconomy and broader emerging market financials.
First, the robust 18.96% growth in net advances (reaching ₹49.92 lakh crore) signals sustained capital expenditure cycles and steady retail consumption demand across urban and rural India. At a time when macro environment uncertainties persist globally, India’s credit growth engine remains remarkably intact.
Second, SBI’s ability to maintain a Net NPA ratio below 0.40% while expanding its balance sheet past ₹76.62 lakh crore reflects structural improvements in credit underwriting, risk monitoring, and bad debt resolution frameworks. This structural improvement provides international institutional investors with reinforced confidence in Indian financial institutions.
Company Overview & Market Position
State Bank of India is a Fortune 500 company headquartered in Mumbai, tracing its origins back to the Bank of Calcutta established in 1806. The Bank offers a comprehensive range of products and services to individuals, commercial enterprises, large corporations, public sector entities, and institutional clients.
+-------------------------------------------------------------------------------+
|                        SBI BUSINESS SEGMENT STRUCTURE                         |
+-------------------------------------------------------------------------------+
|                                                                               |
|   +-------------------+    +--------------------+    +--------------------+   |
|   |   RETAIL BANKING  |    | CORPORATE BANKING  |    |TREASURY & OVERSEAS |   |
|   |                   |    |                    |    |                    |   |
|   | * Home Loans      |    | * Infrastructure   |    | * Investment Port. |   |
|   | * Auto Loans      |    | * Working Capital  |    | * Forex Operations |   |
|   | * Express Credit  |    | * Project Finance  |    | * Derivatives      |   |
|   | * YONO App        |    | * Trade Finance    |    | * Foreign Branches |   |
|   +-------------------+    +--------------------+    +--------------------+   |
|                                                                               |
+-------------------------------------------------------------------------------+
Business Segments Breakdown
Retail Banking: Represents the core engine of SBI’s deposit-gathering and loan delivery mechanism. The bank commands market leadership across personal loans, home loans, auto financing, and agriculture lending.
Corporate Banking: Offers tailored financing, term loans, project finance, structured trade services, and cash management solutions to mid-size enterprises and large conglomerates.
Digital Banking: Driven primarily by the YONO (You Only Need One) flagship super-app, facilitating digital onboarding, seamless personal credit disbursement, and instant payments processing.
Treasury Operations: Manages the bank’s investment portfolio, asset-liability matching, statutory liquidity ratio (SLR) requirements, foreign exchange trading, and interest rate risk management.
International Business: Operates an extensive foreign network across major global financial centers, servicing Indian corporates expanding abroad, cross-border trade flows, and non-resident Indian (NRI) banking requirements.
Comprehensive Q1 FY27 Financial Performance
Financial Summary Table (Standalone)
| Financial Metric (₹ Crore) | Q1 FY27 (Unaudited) | Q4 FY26 (Audited) | Q1 FY26 (Unaudited) | YoY Growth (%) | QoQ Growth (%) |
Interest Earned | 1,27,896.46 | 1,23,097.67 | 1,17,830.28 | +8.54% | +3.90% |
Interest Expended | 80,904.02 | 78,717.67 | 76,923.39 | +5.17% | +2.78% |
Other Income | 15,922.69 | 17,314.10 | 17,511.28 | -9.07% | -8.04% |
Total Income | 1,43,819.15 | 1,40,411.77 | 1,35,341.56 | +6.26% | +2.43% |
Operating Expenses | 29,385.95 | 33,989.92 | 27,873.70 | +5.42% | -13.55% |
— Employee Cost | 17,423.80 | 16,215.25 | 16,899.52 | +3.10% | +7.45% |
— Other Expenses | 11,962.15 | 17,774.67 | 10,974.18 | +9.00% | -32.70% |
Operating Profit (PPOP) | 33,529.18 | 27,704.18 | 30,544.47 | +9.77% | +21.03% |
Total Provisions | 5,046.77 | 2,872.16 | 4,759.20 | +6.04% | +75.71% |
— NPA Provisions | 3,359.01 | 3,140.46 | 4,934.04 | -31.92% | +6.96% |
Profit Before Tax (PBT) | 28,482.41 | 24,832.02 | 25,785.27 | +10.46% | +14.70% |
Tax Expense | 7,361.19 | 5,148.27 | 6,624.83 | +11.12% | +42.98% |
Net Profit (Standalone) | 21,121.22 | 19,683.75 | 19,160.44 | +10.23% | +7.30% |
Net Profit (Consolidated) | 24,113.00 | 19,642.87 | 21,201.47 | +13.73% | +22.76% |
Key Financial Ratios & Asset Quality Indicators
| Financial Ratio / Metric | Q1 FY27 | Q4 FY26 | Q1 FY26 | YoY Trend |
Basic & Diluted EPS (₹) | 22.88 | 21.32 | 21.47 | Up ₹1.41 |
Return on Assets (ROA) | 1.11% | 1.07% | 1.14% | Down 3 bps |
Gross NPA Ratio | 1.47% | 1.49% | 1.83% | Improved 36 bps |
Net NPA Ratio | 0.38% | 0.39% | 0.47% | Improved 9 bps |
Gross NPA Amount (₹ Cr) | 74,272.06 | 73,452.46 | 78,039.68 | Reduced ₹3,767.62 Cr |
Net NPA Amount (₹ Cr) | 19,158.49 | 18,830.14 | 19,908.42 | Reduced ₹749.93 Cr |
Provision Coverage Ratio (PCR) | 74.20% | — | — | Robust Coverage |
PCR including AUCA | 91.82% | — | — | Highly Conservative |
Capital Adequacy Ratio (CAR) | 15.67% | 15.40% | 14.63% | Strengthened 104 bps |
CET-1 Ratio | 12.89% | 12.29% | 11.10% | Strengthened 179 bps |
Total Advances (₹ Cr) | 49,92,003.69 | 48,77,894.83 | 41,96,205.12 | +18.96% YoY |
Total Deposits (₹ Cr) | 60,05,805.24 | 59,75,642.12 | 54,73,253.70 | +9.73% YoY |
Segmental Revenue & Profitability Analysis
SBI operates three broad domestic reporting segments alongside overseas banking activities. The quarterly breakdown provides clear perspective on where earnings momentum is originating.
| Segment | Revenue Q1 FY27 (₹ Cr) | Revenue Q1 FY26 (₹ Cr) | YoY Growth (%) | Segment Profit Q1 FY27 (₹ Cr) | Segment Profit Q1 FY26 (₹ Cr) |
Treasury Operations | 34,757.20 | 36,729.08 | -5.37% | 5,591.78 | 8,082.91 |
Corporate/Wholesale Banking | 38,329.01 | 35,512.66 | +7.93% | 6,715.85 | 5,146.16 |
Retail Banking Operations | 70,244.36 | 62,860.08 | +11.75% | 18,750.79 | 15,477.24 |
— Digital Banking Sub-segment | 833.18 | 1,189.63 | -29.96% | 6,246.61 | 4,632.34 |
— Other Retail Banking Sub-segment | 69,411.18 | 61,670.45 | +12.55% | 12,504.18 | 10,844.90 |
+-------------------------------------------------------------------------------+
|                       SEGMENT PROFIT SHARE (Q1 FY27)                          |
+-------------------------------------------------------------------------------+
|  Retail Banking Operations  :  ===================================> 59.9%     |
|  Corporate / Wholesale     :  ====================> 21.5%                  |
|  Treasury Operations       :  ===============> 17.9%                        |
|  Unallocated / Others      :  ===> 0.7%                                       |
+-------------------------------------------------------------------------------+
Retail banking continues to act as the single largest earnings anchor for SBI, generating ₹18,750.79 crore in segment results, up 21.15% YoY. Wholesale/Corporate banking also posted strong profit expansion of 30.50% YoY to ₹6,715.85 crore. Treasury profit normalized to ₹5,591.78 crore compared to a high base in the prior year period.
Balance Sheet Strength & Asset Quality Deep Dive
Asset Quality Trends
SBI’s asset quality transformation remains one of the most compelling credit turnarounds in Asian banking history. Gross NPAs declined from 1.83% in June 2025 to 1.47% in June 2026. Net NPAs dropped to a low level of 0.38%.
+-------------------------------------------------------------------------------+
|                      GROSS NPA vs NET NPA TRAJECTORY (%)                      |
+-------------------------------------------------------------------------------+
|  2.0% |                                                                       |
|  1.8% |   1.83% (Q1 FY26)                                                     |
|  1.6% |        \                                                              |
|  1.4% |         +--------> 1.49% (Q4 FY26)                                    |
|  1.2% |                         \                                             |
|  1.0% |                          +-------> 1.47% (Q1 FY27) - GNPA             |
|  0.8% |                                                                       |
|  0.6% |   0.47% (Q1 FY26)                                                     |
|  0.4% |        \-------------> 0.39% (Q4 FY26) ---> 0.38% (Q1 FY27) - NNPA      |
+-------------------------------------------------------------------------------+
The bank holds a Provision Coverage Ratio (PCR) of 74.20%. When accounting for written-off assets in Advance Under Collection Accounts (AUCA) amounting to ₹1,59,849.37 crore, the total coverage ratio stands at 91.82%.
Capital Adequacy & Regulatory Compliance
CET-1 Ratio: Increased to 12.89% as of June 30, 2026, compared to 11.10% a year ago.
Overall Capital Adequacy Ratio (CAR): Stood at 15.67%, comfortably above the regulatory requirement.
Investment Fluctuation Reserve (IFR): In accordance with the RBI circular dated May 18, 2026, the requirement to maintain IFR was discontinued. Consequently, SBI transferred the entire balance of ₹11,522.30 crore from IFR directly to General Reserves during Q1 FY27.
Management Guidance & Strategic Outlook
Key Commentary Highlights
Credit Growth Outlook: Management reiterated its full-year FY27 loan growth guidance in the range of 14% to 15%, driven by balanced growth across retail, SME, and corporate loan books.
Deposit Strategy: Focus remains on granular retail deposit mobilization to maintain a healthy loan-to-deposit ratio while optimizing overall cost of funds.
Digital & AI Roadmap: SBI continues heavy capital expenditure in IT infrastructure and digital platform upgrades. The ongoing rollout of next-generation features on the YONO platform aims to deepen digital cross-selling across insurance, asset management, and card payments.
SWOT Analysis
+-------------------------------------------------------------------------------+
|                                 SWOT ANALYSIS                                 |
+-------------------------------------------------------------------------------+
| STRENGTHS                                  | WEAKNESSES                       |
| * Unrivaled deposit franchise (>₹60T)      | * Moderating NIMs amidst competition|
| * Dominant nationwide distribution network | * Higher operational overheads   |
| * Exceptional asset quality (NNPA 0.38%)    |   relative to private peers      |
| * Robust CET-1 ratio of 12.89%             |                                  |
+--------------------------------------------+----------------------------------+
| OPPORTUNITIES                              | THREATS                          |
| * Under-penetrated retail & SME credit     | * Macroeconomic slowdown risks   |
| * Monetization of insurance & AMC units    | * Deposit rate competition       |
| * Cross-selling through YONO digital app   | * Regulatory capital changes     |
+-------------------------------------------------------------------------------+
Comparative Peer Analysis
To evaluate SBI’s relative market valuation and operating efficiencies, the table below compares key operational parameters against leading Indian public and private sector banks:
| Bank Name | Market Cap (₹ Cr Approx) | P/E Ratio (TTM) | Price-to-Book (P/B) | ROA (%) | ROE (%) | Gross NPA (%) | Net NPA (%) |
| State Bank of India (SBI) | ~7,50,000 | ~9.2x | ~1.5x | 1.11% | ~17.5% | 1.47% | 0.38% |
| HDFC Bank | ~12,80,000 | ~18.5x | ~2.6x | 1.85% | ~16.2% | 1.33% | 0.39% |
| ICICI Bank | ~8,40,000 | ~17.2x | ~3.1x | 2.30% | ~18.8% | 2.15% | 0.42% |
| Axis Bank | ~3,60,000 | ~13.8x | ~2.1x | 1.70% | ~15.9% | 1.43% | 0.34% |
| Bank of Baroda | ~1,30,000 | ~6.8x | ~1.0x | 1.05% | ~15.2% | 2.88% | 0.68% |
| Punjab National Bank | ~1,10,000 | ~8.1x | ~0.9x | 0.82% | ~12.5% | 4.98% | 0.60% |
Investment Analysis & Valuation Framework
Bull Case vs. Bear Case
Bull Case Factors
Balance Sheet Quality: Net NPA of 0.38% with a 91.82% PCR (including AUCA) provides exceptional credit buffers.
Capital Adequacy: Strong CET-1 ratio of 12.89% enables organic loan growth without requiring dilution.
Value Unlocking: Potential future value unlocking through IPOs/stake sales in non-banking subsidiaries (e.g., SBI General Insurance, SBI Payment Services).
Bear Case Factors
Deposit Cost Pressures: Competition for system liquidity could exert upward pressure on cost of funds.
Margin Compression: Potential contraction in Net Interest Margin (NIM) if deposit repricing lags asset yield adjustments.
Valuation Verdict
Trading at an attractive price-to-earnings (P/E) multiple of ~9.2x TTM earnings and ~1.5x standalone book value, SBI continues to offer a compelling risk-reward profile relative to historical valuation multiples and private sector peers.
+-------------------------------------------------------------------------------+
|                       SUITABILITY MATRIX FOR INVESTORS                        |
+-------------------------------------------------------------------------------+
| Investor Type    | Recommendation | Key Rationale                             |
+------------------+----------------+-------------------------------------------+
| Long-Term Core   | ACCUMULATE     | Strong market dominance, high ROE profile |
| Value Investors  | BUY            | Trades at deep discount to private peers  |
| Income / Dividend| HOLD / BUY     | Healthy dividend payout trajectory        |
| Short-Term Traders| TACTICAL HOLD  | Watch immediate breakout key tech levels  |
+-------------------------------------------------------------------------------+
Conclusion & Balanced View
State Bank of India’s Q1 FY27 results underscore a financial institution operating at peak operational momentum. With standalone quarterly profits exceeding ₹21,000 crore, Net NPAs remaining below 0.40%, and total deposits surpassing ₹60 lakh crore, the bank demonstrates both scale and balance sheet resilience.
Investors should weigh potential industry-wide margin pressures against SBI’s unrivaled funding cost advantages and strong capital adequacy. On balance, SBI remains a premier financial anchor for investors seeking exposure to India’s long-term macroeconomic structural growth story.



