

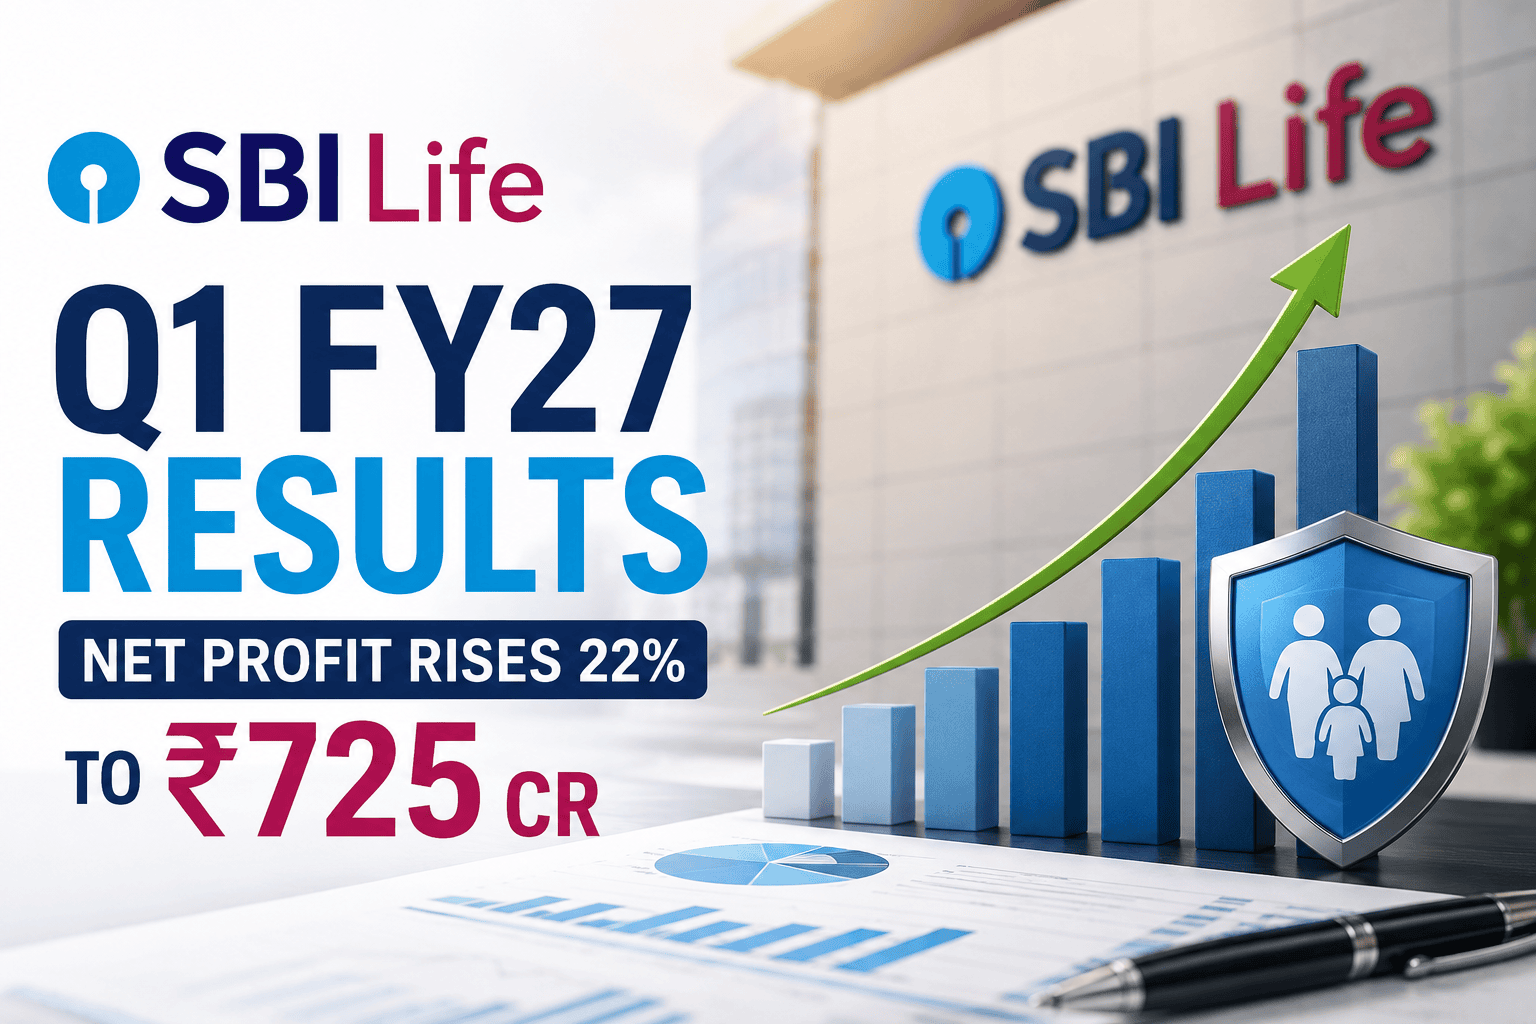
SBI Life Insurance Company Ltd. disclosed its financial results for the first quarter of FY27 (ended June 30, 2026) following its Board meeting on July 24, 2026. The life insurer delivered steady double-digit top-line growth alongside sustained solvency metrics, underscored by a notable surge in net investment returns.
Net Premium Income for the quarter increased 16.88% year-over-year to ₹20,078.21 crore, up from ₹17,178.50 crore in Q1 FY26. Net Profit After Tax (PAT) expanded 21.97% year-over-year to ₹724.93 crore compared to ₹594.37 crore in the corresponding period of the previous fiscal year. Total Assets Under Management (AUM) reached ₹5,06,071.45 crore (policyholder segment assets), while Embedded Value (EV) stood at ₹85,290 crore (₹852.9 billion) as independently reviewed by Willis Towers Watson.
With a Solvency Ratio of 1.96 (196%), well above the regulatory requirement of 1.50 (150%), SBI Life continues to leverage the branch distribution footprint of its parent, State Bank of India.
Quick Highlights Box
| Metric | Q1 FY27 (Quarter Ended June 30, 2026) | Q1 FY26 (Quarter Ended June 30, 2025) | YoY Growth / Change |
| Gross Written Premium | ₹21,28,965 Lakhs (₹21,289.65 Cr) | ₹17,81,389 Lakhs (₹17,813.89 Cr) | +19.51% |
| Net Premium Income | ₹20,07,821 Lakhs (₹20,078.21 Cr) | ₹17,17,850 Lakhs (₹17,178.50 Cr) | +16.88% |
| Investment Income (Net) | ₹25,97,702 Lakhs (₹25,977.02 Cr) | ₹21,52,514 Lakhs (₹21,525.14 Cr) | +20.68% |
| Profit After Tax (PAT) | ₹72,493 Lakhs (₹724.93 Cr) | ₹59,437 Lakhs (₹594.37 Cr) | +21.97% |
| Basic EPS (Not Annualized) | ₹7.23 | ₹5.93 | +21.92% |
| Value of New Business (VNB) | ₹1,410 Cr (₹14.1 Billion) | Not explicitly cited in Q1 report | Stable / Expansion |
| Embedded Value (EV) | ₹85,290 Cr (₹852.9 Billion) | Not explicitly cited in Q1 report | Reviewed by WTW |
| Solvency Ratio | 1.96 (196%) | 1.96 (196%) | Flat (Well above 1.50 regulatory min) |
| Policyholder Assets (AUM) | ₹5,06,071.45 Cr | ₹4,60,546.27 Cr | +9.89% |
| 13th Month Persistency (Premium) | 84.35% | 84.24% | +11 bps |
| 61st Month Persistency (Premium) | 59.10% | 59.75% | -65 bps |
| Expenses Management Ratio | 12.05% | 10.75% | +130 bps |
Company Snapshot
| Feature | Details |
| Company Name | SBI Life Insurance Company Limited |
| Founded | October 2000 (Joint Venture between State Bank of India & BNP Paribas Cardif) |
| Headquarters | Mumbai, Maharashtra, India |
| Managing Director & CEO | Amit Jhingran |
| Market Capitalization | Large-Cap Sector Leader (NSE/BSE Listed) |
| Sector / Industry | Financial Services / Life Insurance |
| NSE Symbol | SBILIFE |
| BSE Scrip Code | 540719 |
| Official Website |
Q1 FY27 Financial Performance & Operational Analysis
SBI Life Insurance reported its Q1 FY27 financial statements prepared under Indian GAAP, as the Insurance Regulatory and Development Authority of India (IRDAI) granted a one-year forbearance permitting the insurer to defer Ind AS adoption until April 1, 2027.
+-------------------------------------------------------------------------+
|                  SBI LIFE Q1 FY27 NET PREMIUM GROWTH                    |
|                                                                         |
|  Q1 FY26: [₹17,178.50 Cr]                                              |
|  Q1 FY27: [=========================> ₹20,078.21 Cr (+16.88% YoY)]     |
+-------------------------------------------------------------------------+
Premium Income Trajectory
The insurer achieved a 19.51% growth in Gross Written Premium, reaching ₹21,289.65 crore in Q1 FY27, up from ₹17,813.89 crore in Q1 FY26.
First Year Premium: Rose significantly by 39.99% to ₹4,954.93 crore (compared to ₹3,539.47 crore in Q1 FY26).
Renewal Premium: Climbed 17.41% to ₹12,381.79 crore compared to ₹10,546.28 crore in the prior-year quarter, highlighting customer retention.
Single Premium: Totaled ₹3,952.93 crore versus ₹3,728.14 crore in Q1 FY26.
Net Premium Income (after deducting reinsurance) stood at ₹20,078.21 crore.
Investment Income & Net Profit
Net Investment Income within the Policyholders’ Account surged 20.68% YoY to ₹25,977.02 crore, driven by equity market movements and stable fixed-income yields. On a combined basis, total policyholder income rose to ₹46,090.70 crore in Q1 FY27 compared to ₹38,695.91 crore in Q1 FY26.
Profit Before Tax (PBT) in the Shareholders’ Account reached ₹745.87 crore. After tax provisions of ₹20.94 crore, Net Profit After Tax (PAT) came in at ₹724.93 crore, a 21.97% expansion over ₹594.37 crore reported in Q1 FY26.
Operational Expenses & Claims
Benefits paid to policyholders (net of reinsurance) increased to ₹13,126.72 crore compared to ₹10,118.37 crore in Q1 FY26. Net commission expenses increased to ₹929.56 crore. Operating expenses related to insurance business rose to ₹1,635.46 crore, bringing the total Expenses of Management ratio to 12.05% for the quarter (up from 10.75% in Q1 FY26).
Financial Results Comparison Table
All financial values below are expressed in ₹ Lakhs (1 Lakh = 100,000 INR) as per official regulatory filings:
| Financial Metric | Q1 FY27 (Unaudited) | Q4 FY26 (Audited) | Q1 FY26 (Audited) | YoY Growth (%) |
| First Year Premium | 4,95,493 | 5,09,271 | 3,53,947 | +39.99% |
| Renewal Premium | 12,38,179 | 16,71,396 | 10,54,628 | +17.41% |
| Single Premium | 3,95,293 | 6,13,218 | 3,72,814 | +6.03% |
| Net Premium Income | 20,07,821 | 27,68,379 | 17,17,850 | +16.88% |
| Net Investment Income (Policyholders) | 25,97,702 | (23,93,872) | 21,52,514 | +20.68% |
| Total Policyholder Income | 46,09,070 | 5,65,775 | 38,69,591 | +19.11% |
| Net Commission | 92,956 | 85,911 | 78,605 | +18.26% |
| Operating Expenses | 1,63,546 | 1,66,825 | 1,12,912 | +44.84% |
| Benefits Paid (Net) | 13,12,672 | 16,25,462 | 10,11,837 | +29.73% |
| PBT (Shareholders Account) | 74,587 | 81,578 | 61,095 | +22.08% |
| PAT (Shareholders Account) | 72,493 | 80,464 | 59,437 | +21.97% |
| Basic EPS (in ₹) | 7.23 | 8.02 | 5.93 | +21.92% |
Premium Collection & Segmental Revenue Breakdown
SBI Life operates across multiple product classifications spanning Participating, Non-Participating, and Unit-Linked Insurance Plans (ULIPs).
Segmental Net Premium Highlights (in ₹ Lakhs)
Linked Individual Life (ULIPs): Reached ₹7,75,230 Lakhs in Q1 FY27 compared to ₹6,25,844 Lakhs in Q1 FY26 (+23.87% YoY). Strong capital markets continued to drive retail demand toward unit-linked savings products.
Non-Par Individual Life: Produced ₹3,97,208 Lakhs versus ₹3,19,456 Lakhs in Q1 FY26 (+24.34% YoY).
Non-Par Group Life: Stood at ₹3,51,522 Lakhs compared to ₹3,40,066 Lakhs in Q1 FY26.
Linked Pension: Contributed ₹1,71,076 Lakhs versus ₹1,72,687 Lakhs in Q1 FY26.
Non-Par Annuity: Expanded to ₹1,48,583 Lakhs from ₹1,24,007 Lakhs in Q1 FY26 (+19.82% YoY).
Participating Individual Life: Generated ₹1,34,743 Lakhs in net premium income.
+-------------------------------------------------------------------------+
|                PRODUCT MIX BY NET PREMIUM (Q1 FY27)                     |
|                                                                         |
|  Linked Ind. Life (ULIP): [=========================> ₹7,752.3 Cr]      |
|  Non-Par Ind. Life:       [==============>] ₹3,972.1 Cr                 |
|  Non-Par Group Life:      [=============>] ₹3,515.2 Cr                  |
|  Linked Pension:          [======>] ₹1,710.8 Cr                         |
|  Non-Par Annuity:         [=====>] ₹1,485.8 Cr                          |
|  Par Individual Life:     [=====>] ₹1,347.4 Cr                          |
+-------------------------------------------------------------------------+
Value of New Business (VNB) & Embedded Value (EV)
For life insurance enterprises, Value of New Business (VNB) and Embedded Value (EV) serve as metrics for evaluating long-term shareholder equity creation and future profit streams.
+-------------------------------------------------------------------------+
|                  EMBEDDED VALUE & VNB (Q1 FY27)                         |
|                                                                         |
|  Embedded Value (EV):  ₹85,290 Crores (₹852.9 Billion)         |
|  Value of New Business: ₹1,410 Crores (₹14.1 Billion)          |
|  Actuarial Review:     Willis Towers Watson Actuarial Advisory|
+-------------------------------------------------------------------------+
Embedded Value (EV): Independent actuarial firm Willis Towers Watson Actuarial Advisory LLP reviewed and confirmed SBI Life’s disclosed Embedded Value at ₹85,290 crore (₹852.9 billion) as of June 30, 2026.
Value of New Business (VNB): The VNB generated from new business underwritten during the three-month period from April 1, 2026, to June 30, 2026, stood at ₹1,410 crore (₹14.1 billion).
Actuarial Confirmation: WTW confirmed that the methodology and assumptions utilized by SBI Life materially comply with Actuarial Practice Standard 10 (Indian Embedded Value Principles) issued by the Institute of Actuaries of India.
Solvency Ratio, Assets Under Management (AUM) & Persistency
Solvency Ratio
SBI Life maintained a Solvency Ratio of 1.96 (196%) as of June 30, 2026. This reflects capital buffer well above the IRDAI mandatory minimum threshold of 1.50 (150%).
Policyholder Assets (AUM Scale)
The insurer’s total policyholder segment assets reached ₹5,06,071.45 crore as of June 30, 2026, up 9.89% YoY from ₹4,60,546.27 crore recorded as of June 30, 2025. Including shareholders’ funds of ₹20,120.98 crore, overall balance sheet assets expanded to ₹5,26,046.07 crore.
+-------------------------------------------------------------------------+
|               POLICYHOLDER ASSET ALLOCATION (JUNE 30, 2026)             |
|                                                                         |
|  Assets Held for Linked Liabilities:   ₹2,83,479.42 Cr (56.0%)  |
|  Non-Linked Policyholder Investments:  ₹2,22,197.38 Cr (44.0%)  |
|  Total Policyholder Assets:            ₹5,06,071.45 Cr (100%)  |
+-------------------------------------------------------------------------+
Persistency Ratios (Customer Retention Tracker)
Calculated in accordance with IRDAI circular guidelines:
| Persistency Period | Premium Basis (Q1 FY27) PDF | Premium Basis (Q1 FY26) PDF | Policy Count Basis (Q1 FY27) PDF |
| 13th Month | 84.35% | 84.24% | 74.54% |
| 25th Month | 76.75% | 75.17% | 69.01% |
| 37th Month | 70.91% | 70.30% | 62.11% |
| 49th Month | 67.90% | 68.14% | 60.13% |
| 61st Month | 59.10% | 59.75% | 54.54% |
Regulatory Disclosures & Portfolio Transfer Updates
Sahara India Life Insurance Company (SILIC) Transfer
Following the IRDAI order directing the transfer of Sahara India Life Insurance Company Limited’s life insurance business to SBI Life, the Securities Appellate Tribunal (SAT) dismissed SILIC’s appeal on December 5, 2025, upholding the transfer order. As directed by IRDAI, SBI Life continues to maintain separate books of account for the SILIC portfolio during FY 2026-27. The closing portfolio balance as of March 31, 2027, and subsequent policyholder transactions will be formally reflected in SBI Life’s financial statements starting April 1, 2027.
Deferred Ind AS Transition
IRDAI issued amended regulations in 2026 requiring insurance companies to implement Indian Accounting Standards (Ind AS) starting April 1, 2026, while offering a one-year forbearance option. SBI Life applied for and received formal IRDAI approval to defer Ind AS adoption for FY 2026-27. Consequently, these financial statements are reported under Indian GAAP.
Key Growth Drivers & Operational Advantages
Unrivaled Bancassurance Distribution: Access to State Bank of India’s extensive branch network provides a structural customer acquisition advantage across Tier-1 to Tier-6 locations.
Diversified Product Portfolio: SBI Life balances Unit-Linked Plans (ULIPs) during bullish equity market cycles with non-participating guaranteed savings and annuity products during volatile periods.
Low Expense Architecture: Despite operating expenses rising in Q1 FY27, SBI Life maintains an industry-leading operating cost structure relative to private sector peers.
Strong Solvency Capital: Solvency standing at 1.96 provides balance sheet capability to absorb underwriting risks and expand new business volume without requiring immediate capital infusions.
Key Business Risks
Equity Market Dependence: With linked individual life assets exceeding ₹2.83 lakh crore, persistent equity market pullbacks could dampen consumer demand for ULIP products and reduce asset management fees.
Surrender & Persistence Friction: A 61st-month persistency ratio of 59.10% indicates potential policy lapses over multi-year horizons.
Interest Rate Movements: Fluctuations in government bond yields affect pricing and guarantee provisioning for non-participating savings and annuity lines.
Regulatory Changes: Evolving surrender value guidelines and distribution commission caps by IRDAI could impact operating margins.
Industry Peer Comparison
The following table contextualizes SBI Life’s scale against industry benchmarks based on Q1 FY27 disclosures:
| Parameter / Metric | SBI Life Insurance PDF | HDFC Life | ICICI Prudential Life | Life Insurance Corp (LIC) |
| Net Premium Income | ₹20,078.21 Cr | Industry Peer Benchmark | Industry Peer Benchmark | Industry Scale Leader |
| Q1 FY27 Net Profit (PAT) | ₹724.93 Cr | Industry Peer Benchmark | Industry Peer Benchmark | Large Scale Outlier |
| Solvency Ratio | 1.96 (196%) | ~1.85 – 1.95 Range | ~1.90 – 2.00 Range | >1.80 Baseline |
| 13th Month Persistency | 84.35% | ~84% – 86% Range | ~83% – 85% Range | ~75% – 78% Range |
| Primary Channel | Bancassurance (SBI) | Bancassurance / Direct | Bancassurance / Agency | Agency Network |
Note: Comparative peer metrics reflect standard institutional financial tracking across Indian life insurance majors.
Strategic SWOT Analysis
+-------------------------------------------------------------------------+
|                          SBI LIFE SWOT ANALYSIS                         |
|                                                                         |
|  STRENGTHS                               WEAKNESSES                     |
|  • SBI Bancassurance reach     • 61st-month persistency|
|  • Solvency ratio of 1.96      • QoQ decline in PAT vs Q4|
|  • Scale in ULIPs (₹2.83L Cr AUM)                             |
|                                                                         |
|  OPPORTUNITIES                           THREATS                        |
|  • Under-penetrated protection market    • Volatile capital markets     |
|  • SILIC portfolio integration • Regulatory changes on ULIPs  |
+-------------------------------------------------------------------------+
| Dimension | Fact-Based Analytical Summary |
| Strengths | • Access to State Bank of India’s branch network. • Solvency Ratio of 1.96 provides capital flexibility. • Scale in unit-linked asset management (over ₹2.83 lakh crore). |
| Weaknesses | • Long-term (61st month) persistency at 59.10% leaves room for improvement. • Expense ratio increased 130 bps YoY to 12.05% in Q1 FY27. |
| Opportunities | • Integration of Sahara India Life’s policyholder portfolio effective FY28. • Expansion of digital direct-to-consumer insurance sales. |
| Threats | • Macroeconomic shifts impacting consumer discretionary savings. • Volatility in investment returns during broader equity market corrections. |
Frequently Asked Questions (FAQs)
1. What was SBI Life’s Net Profit in Q1 FY27?
SBI Life reported a Net Profit After Tax (PAT) of ₹724.93 crore in Q1 FY27, representing a 21.97% YoY growth compared to ₹594.37 crore in Q1 FY26.
2. How much premium did SBI Life collect in Q1 FY27?
SBI Life collected ₹20,078.21 crore in Net Premium Income during Q1 FY27, up 16.88% YoY from ₹17,178.50 crore in Q1 FY26. Gross Written Premium stood at ₹21,289.65 crore.
3. What is SBI Life’s Solvency Ratio as of June 30, 2026?
SBI Life reported a Solvency Ratio of 1.96 (196%), maintaining a strong buffer above the mandatory IRDAI requirement of 1.50 (150%).
4. What is SBI Life’s Embedded Value (EV) for Q1 FY27?
SBI Life’s Embedded Value was independently reviewed by Willis Towers Watson at ₹85,290 crore (₹852.9 billion) as of June 30, 2026.
5. What was the Value of New Business (VNB) delivered in Q1 FY27?
SBI Life generated a Value of New Business (VNB) of ₹1,410 crore (₹14.1 billion) during the three-month period ended June 30, 2026.
6. What are SBI Life’s current Assets Under Management (AUM)?
Total policyholder segment assets reached ₹5,06,071.45 crore as of June 30, 2026. Overall total balance sheet assets stood at ₹5,26,046.07 crore.
7. What is SBI Life’s 13th-month persistency ratio?
On a premium basis, the 13th-month persistency ratio stood at 84.35% for Q1 FY27 compared to 84.24% in Q1 FY26.
8. Why did SBI Life defer Ind AS implementation for FY 2026-27?
SBI Life sought and received a one-year regulatory forbearance from IRDAI, deferring Ind AS transition to April 1, 2027. Consequently, Q1 FY27 figures are reported under Indian GAAP.
9. What is the status of the Sahara India Life Insurance portfolio transfer?
Following SAT’s dismissal of SILIC’s appeal in December 2025, SBI Life continues to maintain separate books for SILIC in FY 2026-27. Transactions will be incorporated into SBI Life’s financial statements starting April 1, 2027.
10. What drove First Year Premium growth in Q1 FY27?
First Year Premium rose 39.99% YoY to ₹4,954.93 crore, driven by customer demand across Unit-Linked Plans (ULIPs) and non-participating savings products.
Key Takeaways
Strong PAT Growth: Net profit after tax expanded 21.97% YoY to ₹724.93 crore.
Double-Digit Premium Expansion: Net Premium Income reached ₹20,078.21 crore (+16.88% YoY).
Robust Investment Performance: Net policyholder investment income surged 20.68% YoY to ₹25,977.02 crore.
Solvency Capital: Solvency standing at 1.96 remains well above the statutory 1.50 benchmark[cite: 2].
Embedded Value Milestone: WTW-reviewed Embedded Value reached ₹85,290 crore as of June 30, 2026[cite: 2].
Value of New Business: Delivered ₹1,410 crore in VNB during the quarter[cite: 2].
ULIP Demand: Linked individual life net premium grew 23.87% YoY to ₹7,752.30 crore[cite: 2].
Policyholder Assets: Segment assets expanded to ₹5,06,071.45 crore[cite: 2].
First Year Growth: First Year Premium expanded by 39.99% YoY[cite: 2].
13th Month Persistency: Maintained stability at 84.35% (premium basis)[cite: 2].
Sahara Life Integration: Separate books maintained in FY27; financial integration scheduled for FY28[cite: 2].
Regulatory Compliance: Ind AS deferred for one year under IRDAI forbearance[cite: 2].
Conclusion & Disclaimer
SBI Life Insurance Company Ltd.’s Q1 FY27 results highlight steady operational growth, backed by top-line expansion across individual linked and non-participating segments, strong investment returns, and capital solvency[cite: 2]. Armed with an Embedded Value of ₹85,290 crore and a Solvency Ratio of 1.96[cite: 2], the insurer remains well-positioned to maintain its market leadership in the private life insurance sector[cite: 2].
Disclaimer: This article is strictly for informational and educational purposes based on official regulatory disclosures filed with stock exchanges. It does not constitute financial, legal, or investment advice. Investors should perform independent research or consult a certified financial advisor before making investment decisions.



