

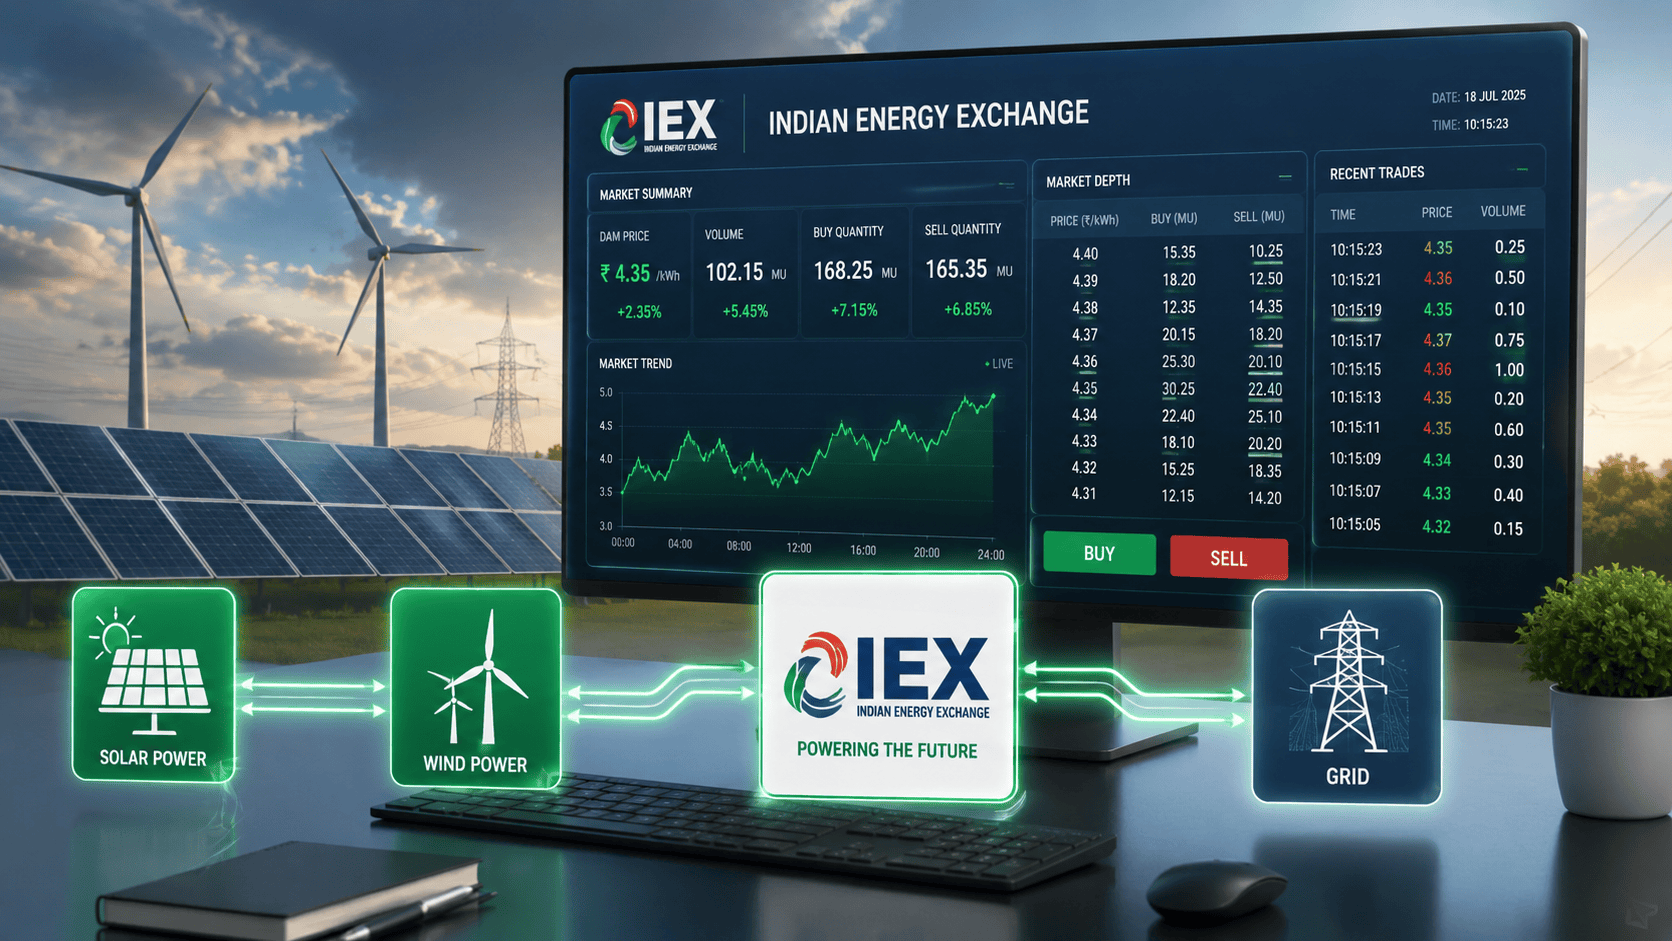
Introduction
Indian Energy Exchange Ltd. (IEX) has delivered another quarter of steady top-line and bottom-line expansion for the first quarter of the financial year 2026–27 (Q1 FY27). As India’s premier automated power trading platform, the exchange’s performance acts as a direct barometer for the health of India’s commercial, industrial, and retail energy demand.
For domestic and international equity investors, IEX offers a unique asset-light business model with high operating leverage and industry-leading profitability margins. Operating within an economy characterized by accelerating urban electrification and rising peak power demand, the structural shift toward spot power procurement makes IEX’s quarterly trajectory a key metric for global emerging market funds.
The quarter ended June 30, 2026, demonstrated solid growth momentum across both standalone exchange activities and equity contributions from key strategic ventures like the Indian Gas Exchange (IGX).
Company Overview
Business Model & Revenue Sources
Indian Energy Exchange operates an electronic, nation-wide platform for the trading of electricity, renewable energy contracts, and energy certificates.
The primary revenue drivers include:
Transaction Fees: Charged on a per-unit basis (in kWh) traded across various market segments.
Admission and Annual Fees: Collected from exchange members and market participants.
Treasury and Investment Income: Income generated from managing cash reserves, margins, and float balances.
Market Position & Ecosystem
IEX maintains a dominant presence in the Indian power exchange landscape. Through its trading platforms, discoms (distribution companies), commercial consumer blocks, industrial units, and independent power producers (IPPs) optimize their power procurement strategies in real time.
The ecosystem comprises several specialized trading markets:
Day-Ahead Market (DAM): Physical delivery contracts traded one day in advance.
Real-Time Market (RTM): Continuous trading platforms enabling participant balance adjustments within 15-minute time blocks.
Green Day-Ahead & Term-Ahead Markets (GDAM/GTAM): Dedicated trading avenues for renewable energy.
Energy Saving Certificates (ESCerts) and Renewable Energy Certificates (RECs): Market-based mechanisms facilitating environmental compliance.
Q1 FY27 Result Highlights
The following table summarizes the key consolidated financial figures reported by Indian Energy Exchange Ltd. for the quarter ended June 30, 2026.
| Metric | Q1 FY27 (₹ in Lakhs) | Q1 FY26 (₹ in Lakhs) | YoY Growth (%) | Q4 FY26 (₹ in Lakhs) | QoQ Growth (%) |
| Revenue from Operations | 15,787.67 | 14,175.14 | +11.38% | 17,430.27 | -9.42% |
| Other Income | 4,493.27 | 4,242.81 | +5.90% | 2,213.66 | +102.98% |
| Total Income | 20,280.94 | 18,417.95 | +10.11% | 19,643.93 | +3.24% |
| Operating Expenses | 3,372.68 | 3,247.11 | +3.87% | 3,171.63 | +6.34% |
| Profit Before Tax (PBT) | 17,680.14 | 15,839.10 | +11.62% | 16,913.69 | +4.53% |
| Net Profit (PAT) | 13,475.67 | 12,069.67 | +11.65% | 12,977.26 | +3.84% |
| Basic EPS (₹) | 1.52 | 1.36 | +11.76% | 1.45 | +4.83% |
(Source: Official Financial Filings submitted to BSE/NSE on July 23, 2026)
Detailed Financial Analysis
Revenue Analysis
Consolidated revenue from operations for Q1 FY27 reached ₹157.88 crore, compared to ₹141.75 crore reported in Q1 FY26. The growth was driven by elevated overall electricity consumption across India during the early summer season, which expanded power market volumes. Sequentially, revenue from operations dropped 9.42% from ₹174.30 crore in Q4 FY26, consistent with seasonal variations in trading activity.
Total income rose 10.11% YoY to ₹202.81 crore, aided by a healthy treasury portfolio performance that generated ₹44.93 crore in other income.
Expenses & Margin Performance
Operating expenses for the quarter totaled ₹33.73 crore, demonstrating strong cost control relative to income growth:
Employee Benefit Expenses: Stood at ₹14.12 crore, up from ₹12.29 crore in Q1 FY26.
Finance Costs: Maintained at a negligible level of ₹0.77 crore.
Depreciation & Amortization: Recorded at ₹6.01 crore.
Other Expenses: Came in at ₹12.83 crore compared to ₹14.15 crore in Q1 FY26.
Because the exchange infrastructure is technology-driven and highly scalable, IEX continues to deliver EBITDA margins well above 80%, among the highest in the Indian financial and technology sectors.
Profitability Trends
Consolidated net profit (PAT) attributable to equity holders expanded to ₹134.76 crore for Q1 FY27, up from ₹120.70 crore in the year-ago period. The profitability was further strengthened by a higher contribution from its associate company, Indian Gas Exchange Limited (IGX), which contributed ₹7.72 crore to the consolidated pre-tax profit compared to ₹6.68 crore in Q1 FY26.
Key Performance Metrics Table
The operational efficiency and revenue stability are highlighted in the key performance breakdown below:
| Financial Metric | Standalone (Q1 FY27) | Consolidated (Q1 FY27) |
| Revenue from Operations | ₹155.93 Crore | ₹157.88 Crore |
| Total Income | ₹200.85 Crore | ₹202.81 Crore |
| Total Expenses | ₹32.54 Crore | ₹33.73 Crore |
| Profit After Tax (PAT) | ₹126.69 Crore | ₹134.76 Crore |
| Net Profit Margin (%) | 63.08% | 66.45% |
| Paid-up Equity Capital | ₹89.09 Crore | ₹89.09 Crore |
(Calculated from company filings for the period ended June 30, 2026)
Quarterly Comparison Table
Below is a three-quarter comparative overview highlighting the financial performance trajectory of IEX:
| Metric (₹ in Lakhs) | Q1 FY27 (Unaudited) | Q4 FY26 (Audited) | Q1 FY26 (Unaudited) |
| Revenue from Operations | 15,787.67 | 17,430.27 | 14,175.14 |
| Other Income | 4,493.27 | 2,213.66 | 4,242.81 |
| Employee Expenses | 1,411.66 | 1,181.73 | 1,229.36 |
| Tax Expense | 4,204.47 | 3,936.43 | 3,769.43 |
| Consolidated PAT | 13,475.67 | 12,977.26 | 12,069.67 |
| Diluted EPS (₹) | 1.52 | 1.45 | 1.36 |
(Data derived from regulatory reporting submitted to Indian exchanges)
Five-Year Financial Trend Table
To provide long-term context, the following table summarizes the five-year performance trajectory based on full-year consolidated results:
| Metric (₹ in Lakhs) | FY22 | FY23 | FY24 | FY25 | FY26 |
| Revenue from Operations | 42,596.00 | 40,086.00 | 43,260.00 | 51,340.00 | 61,564.70 |
| Other Income | 5,810.00 | 7,320.00 | 8,210.00 | 10,850.00 | 13,130.47 |
| Profit After Tax (PAT) | 30,860.00 | 30,590.00 | 34,140.00 | 40,210.00 | 49,292.12 |
| Basic EPS (₹) | 3.46 | 3.43 | 3.83 | 4.51 | 5.54 |
(Sources: Annual Reports & FY26 Full Year Results)
Management Commentary
During board communications and quarterly disclosures, management pointed to key factors shaping the operational landscape:
Demand Momentum: Base energy demand in India continues to expand steadily. Favorable fuel availability and stable thermal coal prices helped generation plants maintain optimal supply to power exchanges.
Spot Price Moderation: Average clearing prices on the Day-Ahead Market remained controlled during the quarter, allowing distribution utilities to optimize procurement and manage peak loads efficiently.
Strategic Investments: Growth in subsidiaries like ICX (Carbon Exchange) and Indian Coal Exchange Limited (incorporated as a subsidiary effective June 1, 2026) reflects the company’s objective to build a comprehensive multi-commodity energy and environmental marketplace.
Business Drivers
                          ┌───────────────────────────┐
                          │   Core Demand Drivers     │
                          └─────────────┬─────────────┘
                                        │
      ┌─────────────────────────────────┼─────────────────────────────────┐
      │                                 │                                 │
┌─────▼───────────────┐       ┌─────────▼─────────────┐       ┌───────────▼───────────┐
│ Industrial & Peak   │       │ Green Energy Shift    │       │ Market Depth &        │
│ Electricity Demand  │       │ (GDAM & RTM Adoption) │       │ Regulatory Framework  │
└─────────────────────┘       └───────────────────────┘       └───────────────────────┘
Industrial Electrification: Expansion in manufacturing activities and urban infrastructure pushes discoms to source additional short-term power from spot markets.
Renewable Energy Integration: The rise of solar and wind generation introduces supply variability, making the Real-Time Market (RTM) an essential tool for grid balancing.
Cross-Border Power Trading: Regional power integration with neighboring countries (Nepal, Bhutan, Bangladesh) offers long-term volume expansion opportunities.
Industry Analysis
India’s power sector continues to undergo structural modernization. Power exchanges currently handle a single-digit percentage of the total generation volume in India, with the vast majority tied up in long-term Power Purchase Agreements (PPAs) lasting 25 years.
The Central Government’s policy direction aims to increase the share of short-term power trading to 15–20% over the next decade. As long-term PPAs expire, utilities are increasingly transitioning toward short-term contracts and spot markets to minimize long-term fixed cost obligations.
Latest Developments
Regulatory Watch: Market Coupling
The Central Electricity Regulatory Commission (CERC) continues its evaluations regarding market coupling across Indian power exchanges. Market coupling involves aggregating bids from all exchanges to determine a single uniform price.
The Bullish Case: Proponents argue that market coupling could deepen overall market liquidity and encourage higher trading volumes across the country.
The Bearish Risk: Analysts caution that uniform pricing could dilute IEX’s primary competitive moat—its deep market liquidity—potentially allowing rival exchanges to gain market share without needing superior order-book depth.
Subsidiary and Associate Performance
Indian Gas Exchange (IGX): Contributed ₹7.72 crore in profits for the quarter, demonstrating steady adoption of natural gas spot trading in India.
ICX & Coal Exchange: The incorporation of Indian Coal Exchange Ltd. in June 2026 positions IEX to capture emerging opportunities in dry bulk energy trading.
Risk Factors
     ┌─────────────────────────────────────────────────────────┐
     │                    Primary Risks                        │
     └────────────────────────────┬────────────────────────────┘
                                  │
      ┌───────────────────────────┼───────────────────────────┐
      │                           │                           │
┌─────▼─────────────┐       ┌─────▼─────────────┐       ┌─────▼─────────────┐
│ Regulatory &      │       │ Volume & Grid     │       │ Macro & Weather   │
│ Market Coupling   │       │ Transmission      │       │ Volatility        │
└───────────────────┘       └───────────────────┘       └───────────────────┘
Regulatory Risks: Implementation details of market coupling remain the primary risk overhang for institutional equity valuations.
Transmission Constraints: Occasional regional grid congestion can constrain cleared trading volumes relative to total submitted bids.
Monsoon Volatility: Above-average rainfall can boost hydro generation while reducing agricultural power demand, temporarily affecting spot trading volumes.
SWOT Analysis
| Strengths | Weaknesses |
• Market share leadership in spot electricity trading. • Strong balance sheet with zero net debt. • Scalable technology platform with high operating margins. | • Earnings remain closely linked to regulatory policies. • High dependence on the Day-Ahead Market segment. |
| Opportunities | Threats |
• Expanding share of renewable energy trading (GDAM). • Diversification into natural gas (IGX) and carbon credits. • Structural shift from long-term PPAs to short-term spot power. | • Implementation of CERC market coupling. • Increasing competition from alternative power exchanges. |
Peer Comparison Table
While IEX holds a market-leading position in India, it operates alongside key financial market infrastructure and energy entities:
| Company Name | Market Cap Category | Business Model Focus | Dividend Yield | ROE Trend |
| Indian Energy Exchange (IEX) | Mid Cap | Power Spot Exchange | ~1.5%–2.0% | ~35%–40% |
| Multi Commodity Exchange (MCX) | Mid Cap | Commodity Derivatives | ~0.8%–1.2% | ~15%–25% |
| BSE Limited | Mid Cap | Financial Equity/Derivatives | ~1.0%–1.5% | ~25%–30% |
Valuation Analysis
From a valuation perspective, IEX has historically traded at a premium multiple relative to traditional utilities due to its asset-light exchange model and operational margins.
Price-to-Earnings (P/E): Multiples tend to adjust based on regulatory headlines around market coupling.
Return on Equity (ROE): Consistently exceeds 35%, supported by low capital expenditure requirements.
Capital Return: The company consistently returns surplus cash flow to shareholders via dividends. The Board previously recommended a final dividend of ₹2 per equity share for FY26.
Brokerage View
Consensus View: Analysts maintain a split view depending on risk weightings assigned to regulatory developments.
Bull Case: Driven by double-digit annual electricity demand growth in India, rapid RTM volume expansion, and monetized gas/carbon ventures.
Bear Case: Focuses on potential margin compression or market share redistribution if CERC enforces market coupling across all power exchanges.
Investment Thesis
Why Consider IEX?
Direct Exposure to Power Growth: Provides direct exposure to India’s expanding electricity consumption without taking on thermal generation asset liabilities.
Superior Cash Conversion: Near 100% conversion of net income to free cash flow due to minimal maintenance capex.
Multi-Energy Platform: Evolution into gas, carbon, and coal markets offers long-term optionality beyond electricity spot trading.
Key Monitoring Points
Progress of regulatory consultations regarding CERC market coupling.
Growth momentum of non-electricity segments (IGX, ICX).
Who Should Invest?
Long-Term Growth Investors: Those seeking asset-light infrastructure businesses benefiting from India’s energy transition.
Dividend & Value Investors: Investors attracted to high ROE businesses that generate reliable operating cash flows and offer steady payout ratios.
Global Perspective
International equity investors in the US, UK, and Europe monitor IEX as a core proxy for India’s real economy. Unlike generation utilities that face supply-chain bottlenecks, fuel cost spikes, or land acquisition delays, IEX provides direct, capital-efficient exposure to the country’s rising power consumption.
Key Takeaways
Consolidated net profit for Q1 FY27 reached ₹134.76 crore, representing an 11.65% YoY increase.
Operational revenue grew 11.38% YoY to ₹157.88 crore.
Associated investments in the Indian Gas Exchange (IGX) contributed ₹7.72 crore in profits.
Operating costs remained well managed at ₹33.73 crore.
Regulatory developments surrounding CERC market coupling remain the primary long-term fundamental watchpoint.
Conclusion
Indian Energy Exchange Ltd. has delivered another financially sound quarter in Q1 FY27, backed by consistent volume growth, high profit margins, and strong auxiliary income streams. While regulatory decisions regarding market coupling remain an important factor to monitor, the company’s core platform liquidity, asset-light structure, and expansion into gas and environmental contracts position it well within India’s evolving energy sector.
Disclaimer: This article is strictly for informational and educational purposes and does not constitute financial advice or a recommendation to buy or sell securities. Investors should conduct their own independent due diligence before making investment decisions.



