

Introduction
Housing & Urban Development Corporation Limited (HUDCO), a premier Navratna Central Public Sector Enterprise (CPSE) under the Ministry of Housing and Urban Affairs (MoHUA), released its unaudited standalone and consolidated financial results for the first quarter ended June 30, 2026 (Q1 FY27).
As India scales up its urban development, smart city frameworks, and affordable housing initiatives, HUDCO’s quarterly results serve as a crucial economic barometer for public infrastructure financing and real estate credit dynamics across the nation.
                   +---------------------------------------+
                   |     HUDCO'S DUAL STRATEGIC ROLES      |
                   +-------------------+-------------------+
                                       |
             +-------------------------+-------------------------+
             |                                                   |
             v                                                   v
+--------------------------+                       +--------------------------+
| Housing Development      |                       | Urban Infrastructure     |
| • Affordable Housing     |                       | • Roads, Water & Power   |
| • EWS / LIG Schemes      |                       | • Smart City Projects    |
| • Slum Rehabilitation    |                       | • Social Infrastructure  |
+--------------------------+                       +--------------------------+
For domestic retail market participants, institutional funds, and international investors monitoring Indian public sector financial enterprises, HUDCO’s performance in Q1 FY27 demonstrates sustained balance sheet growth alongside asset quality management. The key takeaway from the quarter is the combination of double-digit revenue growth (+26.55% YoY), margin defense, and an improving credit impairment profile.
Quick Highlights Table
| Financial Metric | Q1 FY27 (Standalone) | Q1 FY26 (Standalone) | YoY Change (%) / Absolute |
| Revenue from Operations | ₹3,717.17 Cr | ₹2,937.31 Cr | +26.55% |
| Total Income | ₹3,737.49 Cr | ₹2,945.47 Cr | +26.89% |
| Finance Costs | ₹2,560.73 Cr | ₹1,976.31 Cr | +29.57% |
| Profit Before Tax (PBT) | ₹1,066.20 Cr | ₹857.23 Cr | +24.38% |
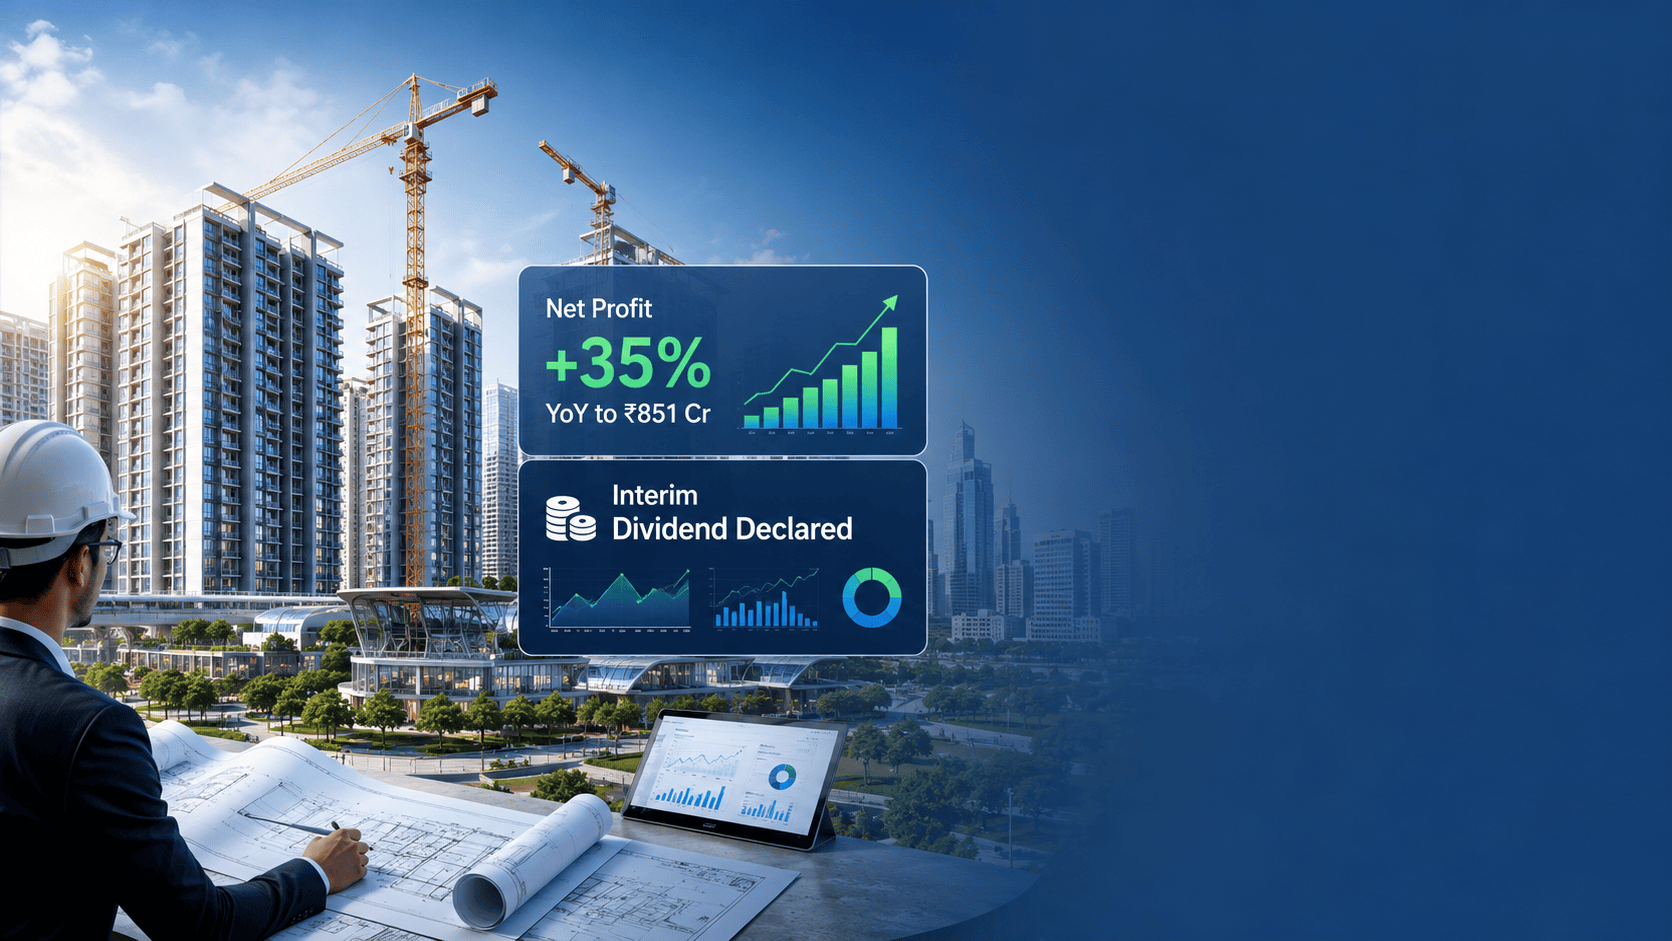
| Profit After Tax (PAT) | ₹851.11 Cr | ₹630.23 Cr | +35.05% |
| Earnings Per Share (Basic & Diluted) | ₹4.25 | ₹3.15 | +34.92% |
| 1st Interim Dividend Announced | ₹1.25 per share (12.50%) | Not Applicable | Record Date: July 31, 2026 |
| Gross Credit Impaired Assets Ratio (Gross NPA) | 0.96% | 1.34% | -38 bps |
| Net Credit Impaired Assets Ratio (Net NPA) | 0.05% | 0.09% | -4 bps |
| Provision Coverage Ratio (PCR) | 95.06% | 93.49% | +157 bps |
| Capital Adequacy Ratio (CRAR) | 39.41% | 41.72% | Comfortable capital buffer |
| Net Worth | ₹22,867.28 Cr | ₹17,655.92 Cr | +29.52% |
| Total Financial Indebtedness | ₹1,53,204.35 Cr | Not Disclosed | Comprehensive Debt Book |
| Operating Margin | 28.68% | 29.18% | Stable core profitability |
| Net Profit Margin | 22.77% | 21.40% | +137 bps |
Financial Performance
Revenue and Top-Line Trajectory
During Q1 FY27, HUDCO’s standalone revenue from operations reached ₹3,717.17 crore, up 26.55% from ₹2,937.31 crore recorded in the corresponding quarter of the previous fiscal year. Top-line growth was supported by expanding interest income, which rose to ₹3,709.57 crore from ₹2,924.64 crore in Q1 FY26.
                     +----------------------------------+
                     |     REVENUE FROM OPERATIONS      |
                     +----------------------------------+
  ₹4,000 Cr +
            |                                    ₹3,717.17 Cr
  ₹3,000 Cr +                      ₹2,937.31 Cr     [++++++]
            |                        [++++++]       [++++++]
  ₹2,000 Cr +                        [++++++]       [++++++]
            |                        [++++++]       [++++++]
  ₹1,000 Cr +                        [++++++]       [++++++]
            +------------------------------------------------+
                                     Q1 FY26        Q1 FY27
Expenses Breakdown & Operational Efficiency
Total expenses for the quarter rose to ₹2,671.29 crore compared to ₹2,088.24 crore in Q1 FY26, driven primarily by interest cost movements:
Finance Costs: Stood at ₹2,560.73 crore (vs. ₹1,976.31 crore in Q1 FY26), reflecting higher borrowing volumes deployed to build out the loan book.
Employee Benefits Expense: Recorded at ₹71.24 crore (vs. ₹68.32 crore in Q1 FY26).
Impairment Losses / ECL Reversals: Net impairment on financial instruments came in at ₹0.06 crore. This compares favorably with a credit reversal of ₹102.95 crore in Q1 FY26, highlighting stabilizing asset quality metrics.
Corporate Social Responsibility (CSR): Stood at ₹15.95 crore (vs. ₹14.39 crore in Q1 FY26).
Standalone Quarterly Financial Statement
| Particulars (₹ in Crore) | Q1 FY27 (Unaudited) | Q4 FY26 (Audited) | Q1 FY26 (Unaudited) | FY26 (Full Year) |
| Interest Income | ₹3,709.57 | ₹3,555.39 | ₹2,924.64 | ₹13,096.25 |
| Rental & Other Operating Revenue | ₹7.60 | ₹7.47 | ₹12.67 | ₹54.15 |
| Total Revenue from Operations | ₹3,717.17 | ₹3,562.86 | ₹2,937.31 | ₹13,150.40 |
| Other Income | ₹20.32 | ₹62.21 | ₹8.16 | ₹176.73 |
| Total Income | ₹3,737.49 | ₹3,625.07 | ₹2,945.47 | ₹13,327.13 |
| Finance Costs | ₹2,560.73 | ₹2,413.29 | ₹1,976.31 | ₹8,930.69 |
| Employee Benefits Expense | ₹71.24 | ₹59.80 | ₹68.32 | ₹268.08 |
| Depreciation & Amortization | ₹1.99 | ₹3.78 | ₹2.94 | ₹12.53 |
| Other Expenses | ₹36.81 | ₹53.90 | ₹30.46 | ₹146.04 |
| Total Expenses | ₹2,671.29 | ₹3,004.06 | ₹2,088.24 | ₹10,105.69 |
| Profit Before Tax (PBT) | ₹1,066.20 | ₹621.01 | ₹857.23 | ₹3,221.44 |
| Current Tax Expense | ₹205.78 | ₹170.02 | ₹140.57 | ₹646.14 |
| Deferred Tax Expense / (Credit) | ₹9.31 | ₹(1,530.32) | ₹86.43 | ₹(1,459.07) |
| Net Profit After Tax (PAT) | ₹851.11 | ₹1,981.31 | ₹630.23 | ₹4,034.37 |
Segment-wise Performance
HUDCO operates under a single primary reportable business segment pursuant to Ind AS 108: Housing and Urban Infrastructure Financing.
                       +---------------------------------+
                       |    HUDCO FINANCING SEGMENTS     |
                       +----------------+----------------+
                                        |
            +---------------------------+---------------------------+
            |                                                       |
            v                                                       v
+-----------------------+                               +-----------------------+
| Urban Infrastructure  |                               | Housing Projects      |
| • Utility Networks    |                               | • State Housing Boards|
| • Transport Systems   |                               | • EWS/LIG Allocations |
| • Social Infra        |                               | • Slum Clearance      |
+-----------------------+                               +-----------------------+
Strategic Sector Dynamics:
Urban Infrastructure Projects: Comprises the majority of HUDCO’s active loan portfolio. Projects financed encompass water supply, sewerage systems, roads, bridges, power transmission, and social infrastructure schemes sponsored by State Governments and municipal entities.
Housing Credit Deployments: Comprises financing extended to State Housing Boards, Development Authorities, and state-backed agencies tasked with urban renewal and affordable housing schemes under the Pradhan Mantri Awas Yojana (PMAY).
Management Commentary
During the Board meeting held on July 27, 2026, HUDCO’s leadership highlighted operational and financial progress:
+-----------------------------------------------------------------------------------+
|                           MANAGEMENT COMMENTARY SUMMARY                           |
+-----------------------------------------------------------------------------------+
| • Dividend Declaration: Approved a 1st Interim Dividend of ₹1.25 per share.      |
| • Asset Quality Resolution: 4 Project Loan NPA accounts resolved during Q1 FY27.   |
| • Zero Fresh Slippages: Zero fresh NPA slippages in Project Loans during Q1.      |
| • Special Reserve Capital: No withdrawal plans; deferred tax liabilities avoided. |
| • Capital Raising: Successfully raised ₹2,140 Cr via listed private NCDs.          |
+-----------------------------------------------------------------------------------+
Dividend Declaration: The Board declared a 1st Interim Dividend for FY 2026-27 of ₹1.25 per equity share (12.50% on face value of ₹10), setting Friday, July 31, 2026, as the official Record Date.
Asset Quality Progress: Note 5 of the financial report highlights that four (4) NPA Project Loan accounts were resolved via full repayment during the quarter. Management confirmed zero fresh slippages to NPA in Project Loans for Q1 FY27.
Special Reserve Policy: Pursuant to Board Resolution item 688.2.16, the company maintained its stance not to make withdrawals from the Special Reserve created under Section 36(1)(viii) of the Income Tax Act, 1961. Consequently, HUDCO is not required to create deferred tax liabilities against the reserve balance.
Capital Market Execution: The company successfully raised ₹2,140 crore through listed non-convertible debt securities on a private placement basis during Q1 FY27 to fund long-term business expansion.
Operational Highlights & Loan Book Health
Outstanding Portfolio & Asset Quality Resolution
HUDCO’s asset quality metrics continued their improving trend in Q1 FY27:
Gross Credit Impaired Assets Ratio (Gross NPA): Improved to 0.96% as of June 30, 2026, down from 1.34% in Q1 FY26.
Net Credit Impaired Assets Ratio (Net NPA): Decreased to 0.05%, down from 0.09% in Q1 FY26.
Provision Coverage Ratio (PCR): Reached 95.06% as of June 30, 2026 (vs. 93.49% in Q1 FY26), providing coverage against loan credit losses.
Total Expected Credit Loss (ECL) Provisioning: Total loan provisions under Ind-AS ECL guidelines stood at ₹1,621.00 crore as of June 30, 2026.
                +-----------------------------------------------+
                |            ASSET QUALITY PROFILE              |
                +-----------------------------------------------+
  2.00% +
        |
  1.50% +               Gross NPA: 1.34%
        |                  [******]
  1.00% +                  [******]             Gross NPA: 0.96%
        |                  [******]                [======]
  0.50% +                  [******]                [======]
        |               Net NPA: 0.09%          Net NPA: 0.05%
  0.00% +-------------------------------------------------------+
                            Q1 FY26                 Q1 FY27
Loan Portfolio Exposures & Acquisitions
Pursuant to RBI Master Directions on Transfer of Loan Exposures, HUDCO transferred no loans during Q1 FY27. However, the company acquired loan exposure amounting to ₹2,059.18 crore, with an outstanding balance of ₹2,059.17 crore as of June 30, 2026.
Balance Sheet Analysis & Financial Indebtedness
Liabilities and Total Borrowings Structure
HUDCO maintains a diverse borrowing structure, backed by a sovereign pedigree that enables low-cost institutional funding across domestic and international markets.
+-----------------------------------------------------------------------------------+
|                     HUDCO DEBT STRUCTURE (TOTAL: ₹1,53,204.35 CR)                 |
+-----------------------------------------------------------------------------------+
|  1. Long-Term Rupee Loans:     ₹70,693.10 Cr   (46.14%)                           |
|  2. Listed / Unlisted Bonds:   ₹61,018.90 Cr   (39.83%)                           |
|  3. External Commercial Borrow: ₹15,941.49 Cr   (10.41%)                           |
|  4. Short-Term Bank Loans:     ₹3,575.50 Cr    (2.33%)                            |
|  5. Foreign Currency (FCNR):   ₹1,891.95 Cr    (1.23%)                            |
|  6. Secured Loans:             ₹83.41 Cr       (0.05%)                            |
+-----------------------------------------------------------------------------------+
Outstanding Financial Indebtedness Breakdown
| Borrowing Instrument / Source | Outstanding Amount (As on June 30, 2026) | Share of Total Indebtedness (%) |
| Secured Loans | ₹83.41 Cr | 0.05% |
| Short Term Loans | ₹3,575.50 Cr | 2.33% |
| Long Term Rupee Loans | ₹70,693.10 Cr | 46.14% |
| Foreign Currency Non-Resident (FCNR) Loans | ₹1,891.95 Cr | 1.23% |
| External Commercial Borrowings (ECB) | ₹15,941.49 Cr | 10.41% |
| Bonds (Taxable & Tax-Free Debt) | ₹61,018.90 Cr | 39.83% |
| Total Financial Indebtedness | ₹1,53,204.35 Cr | 100.00% |
Capital Structure & Security Cover
Net Worth: Reached ₹22,867.28 crore in Q1 FY27, up from ₹17,655.92 crore in Q1 FY26.
Debt to Equity Ratio: Stood at 6.70 times (vs. 6.61 times in Q1 FY26).
Security Coverage: HUDCO maintains 100% security cover (1.00x) across all secured listed Non-Convertible Debentures (NCDs) and Tax-Free Bonds via a charge on receivables.
Capital Adequacy Ratio (CRAR): Stood at 39.41% as of June 30, 2026, above regulatory minimums.
Ratio Analysis
| Ratio Metric | Q1 FY27 | Q1 FY26 | Analysis |
| Operating Margin (%) | 28.68% | 29.18% | Core profitability remains resilient. |
| Net Profit Margin (%) | 22.77% | 21.40% | Expanded by 137 bps due to lower provisioning needs. |
| Debt to Equity Ratio | 6.70x | 6.61x | In line with infrastructure funding profiles. |
| Total Debt to Total Assets | 0.85x | 0.84x | Balance sheet remains asset-backed. |
| CRAR (%) | 39.41% | 41.72% | Capital position supports loan growth. |
| Provision Coverage Ratio (%) | 95.06% | 93.49% | Reserve coverage against legacy NPAs. |
| Gross NPA Ratio (%) | 0.96% | 1.34% | Sub-1% Gross NPA profile. |
| Net NPA Ratio (%) | 0.05% | 0.09% | Minimal residual credit vulnerability. |
Peer Comparison Table
| Company Name | Business Focus | Market Cap Range (Est.) | Net Profit Growth YoY | Gross NPA (%) | Net NPA (%) | Dividend Yield (Est.) |
HUDCO | Urban Infra & Social Housing | Mid-to-Large Cap | +35.05% | 0.96% | 0.05% | Moderate / High |
| LIC Housing Finance | Retail Prime Housing | Large Cap | Moderate | ~1.3% – 1.7% | ~0.8% – 1.0% | Moderate |
| PNB Housing Finance | Retail & Prime Housing | Mid-Cap | Steady Growth | ~1.2% – 1.5% | ~0.7% – 0.9% | Low / Moderate |
| Aavas Financiers | Affordable Housing Finance | Mid-Cap | Stable | ~0.9% – 1.1% | ~0.6% – 0.8% | Low |
| Home First Finance | Technology-Driven Retail | Small-to-Mid Cap | Rapid Growth | ~1.0% – 1.3% | ~0.7% – 0.9% | Low |
| Can Fin Homes | Retail Housing Credit | Mid-Cap | Steady | ~0.8% – 0.9% | ~0.4% – 0.5% | Moderate |
SWOT Analysis
+-----------------------------------------------------------------------------------+
|                                 SWOT ANALYSIS                                     |
+-----------------------------------------------------------------------------------+
|  STRENGTHS                                 |  WEAKNESSES                          |
|  • Government backing & Navratna status   |  • High borrowing dependence         |
|  • Sub-1% Gross NPA (0.96%) profile        |  • Limited retail mortgage presence  |
|  • Capital Adequacy Ratio at 39.41%       |  • Longer project disbursement cycles|
+--------------------------------------------+--------------------------------------+
|  OPPORTUNITIES                             |  THREATS                             |
|  • Expansion under PMAY initiatives        |  • Broader interest rate volatility  |
|  • Smart Cities & Smart Mobility projects  |  • State Government fiscal pressures |
|  • High-margin urban infra financing       |  • Increasing market competition     |
+-----------------------------------------------------------------------------------+
Growth Drivers
National Urban Development Mandate: As India accelerates its urban infrastructure expansion—spanning metro rail extensions, water treatment systems, smart waste management, and solar power integration—HUDCO serves as a key public sector funding channel.
PMAY Expansion: Government focus on affordable housing under the Pradhan Mantri Awas Yojana provides long-term disbursement visibility for HUDCO’s housing loan division.
Competitive Cost of Capital: Sovereign ownership and AAA debt ratings enable HUDCO to access low-cost domestic bond markets, bank consortium lines, and international External Commercial Borrowings (ECB).
Improving Asset Quality Pipeline: With Net NPAs down to 0.05% and a Provision Coverage Ratio of 95.06%, credit costs are expected to remain low.
Risk Factors
Interest Rate Risks: Changes in domestic monetary policy can impact margins if borrowing costs adjust faster than loan asset yields.
State Agency Credit Exposure: Because HUDCO lends extensively to State Housing Boards and municipal corporations, fiscal constraints at the state level can affect disbursement timelines.
Prepayment and Refinancing Pressure: Large infrastructure borrowers may seek to refinance existing debt at lower rates as financial market conditions shift.
Share Price & Valuation Context
                  +-----------------------------------+
                  |      VALUATION PROFILE SUMMARY    |
                  +-----------------------------------+
  3.0x +
       |
  2.5x +                       [Book Value: ~₹114/sh]
       |                                 |
  2.0x +                                 v
       |                    +-----------------------+
  1.5x +                    |  Current Trailing P/B |
       |                    |    Range: ~1.8x-2.4x  |
  1.0x +                    +-----------------------+
       +---------------------------------------------+
HUDCO’s stock performance over recent quarters reflects its re-rating from a high-yield PSU stock to a key infrastructure finance proxy.
Book Value Growth: Book value per share stands at approximately ₹114.23 (calculated on a net worth of ₹22,867.28 crore across 200.19 crore outstanding equity shares).
Valuation Multiples: The stock trades at an attractive price-to-earnings (P/E) and price-to-book (P/B) multiple relative to its 35% net profit growth and 39.41% Capital Adequacy Ratio.
Broker Views & Investment Thesis
                                 +------------------------+
                                 | SCENARIO VALUATION MATRIX|
                                 +-----------+------------+
                                             |
             +-------------------------------+-------------------------------+
             |                               |                               |
             v                               v                               v
  +--------------------+           +--------------------+           +--------------------+
  |     BULL CASE      |           |     BASE CASE      |           |     BEAR CASE      |
  | Target: ~₹310-₹340 |           | Target: ~₹240-₹270 |           | Target: ~₹160-₹180 |
  | Accelerated PMAY   |           | Steady 15-20% loan |           | Extended state    |
  | disbursements.     |           | book expansion.    |           | payment delays.   |
  +--------------------+           +--------------------+           +--------------------+
Institutional Consensus Overview
Financial analysts maintain a positive outlook on HUDCO, citing its strong balance sheet, high capital adequacy (39.41%), and sovereign backing.
Bull Case: Accelerated loan book expansion under urban infrastructure mandates, supported by minimal credit costs (Net NPA at 0.05%).
Base Case: Multi-year compounding driven by steady 15-20% annual disbursement growth, healthy dividend payouts, and ROE expansion.
Bear Case: Extended payment cycles from state-sponsored projects or rising interest costs compressing net interest margins.
Long-Term Outlook
  +-------------------------------------------------------------------------+
  |                        MULTI-YEAR OUTLOOK HORIZON                       |
  +-------------------------------------------------------------------------+
  |  • 1-Year Horizon: Focus on PMAY-2.0 execution and loan disbursements. |
  |  • 3-Year Horizon: Scaling municipal bond financing and smart cities.   |
  |  • 5-Year Horizon: Establishing leadership in green urban infrastructure. |
  +-------------------------------------------------------------------------+
1-Year Outlook: Disbursement momentum is expected to accelerate as state agencies mobilize funds for new urban infrastructure and housing initiatives.
3-Year Outlook: Margins are expected to benefit from a growing loan book, digital underwriting platforms, and international debt market access.
5-Year Outlook: As India’s urban population expands, HUDCO remains uniquely positioned to capture public sector infrastructure credit demand.
Who Should Consider HUDCO?
Long-Term Value Investors: Investors seeking exposure to India’s urban development theme via a public enterprise with strong asset quality.
Dividend-Focused Portfolios: Investors attracted by regular interim dividend declarations and a strong capital buffer.
Risk-Averse Quality Investors: Portfolios seeking financials with sub-1% Gross NPAs (0.96%) and sovereign-backed risk-weighted profiles.
Conclusion
HUDCO’s Q1 FY27 financial results demonstrate strong performance, highlighted by a 35.05% YoY surge in net profit to ₹851.11 crore, expanding top-line revenue (+26.55%), and an improving credit quality profile. With Net NPAs down to 0.05%, a Provision Coverage Ratio of 95.06%, and a Capital Adequacy Ratio of 39.41%, HUDCO presents a strong financial foundation.
The declaration of a ₹1.25 per share 1st Interim Dividend underscores management’s commitment to returning capital to shareholders. As urban infrastructure and affordable housing remain high-priority policy sectors, HUDCO continues to offer a compelling public sector investment case.



