

INTRODUCTION
On August 01, 2026, Divi’s Laboratories Limited—one of the world’s leading manufacturers of Active Pharmaceutical Ingredients (APIs), custom synthesis solutions, and nutraceutical ingredients—released its unaudited financial results for the first quarter of the fiscal year 2026–27 (Q1 FY27).
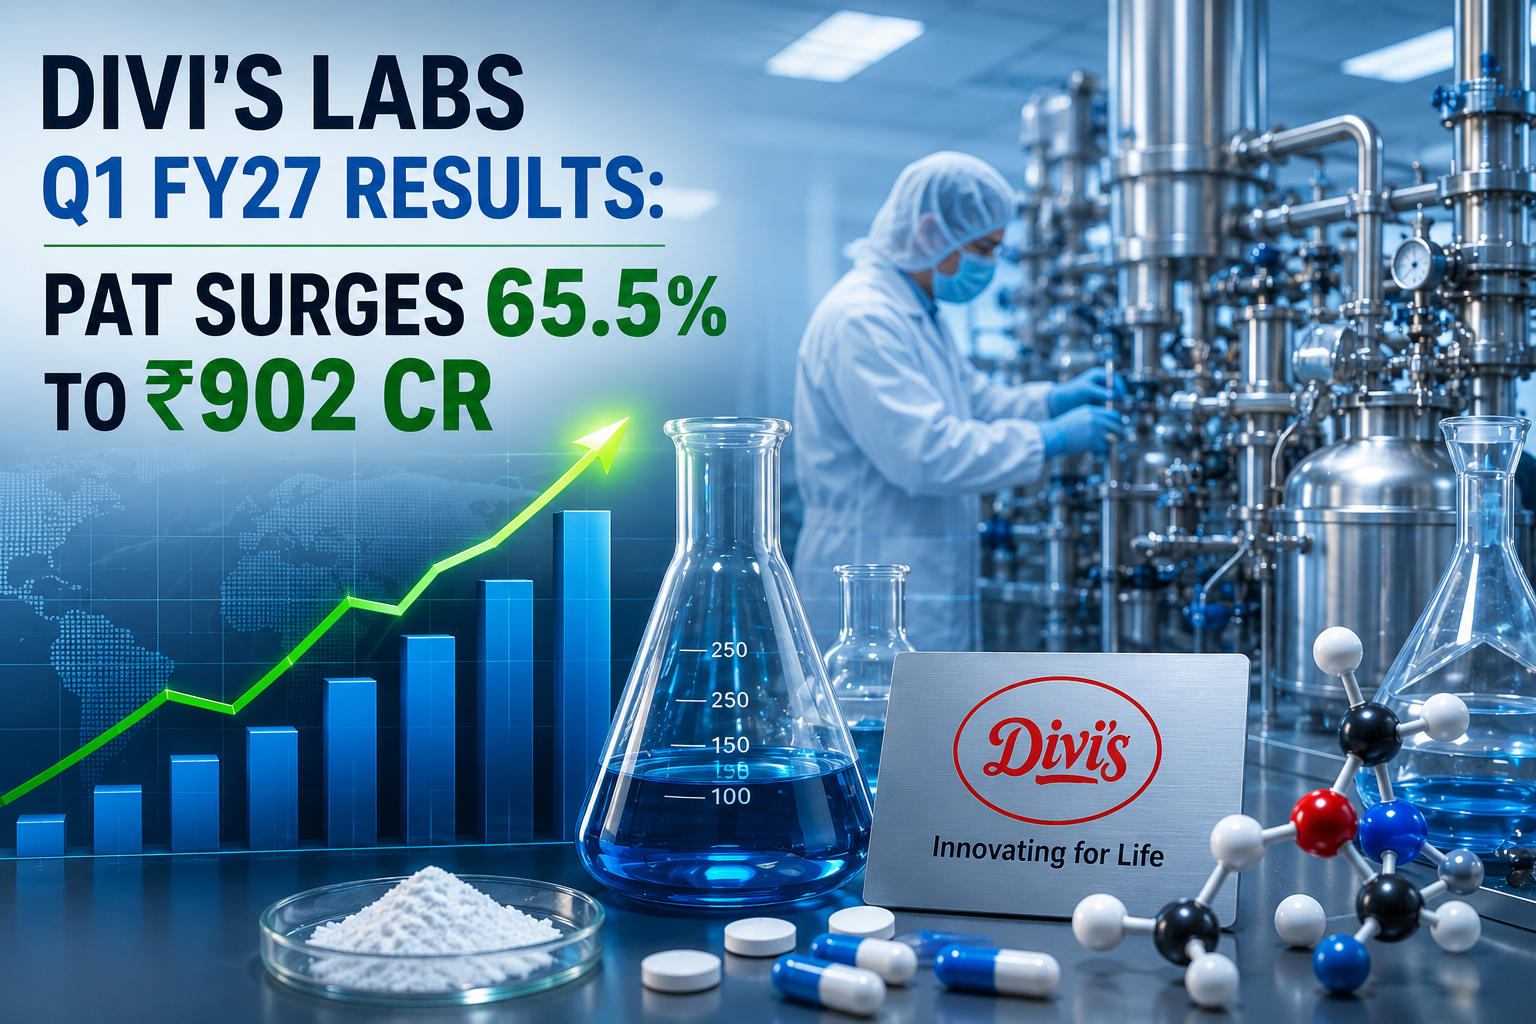
The company delivered a standout operational performance that comfortably beat street consensus estimates across major financial parameters. Driven by sustained traction in custom synthesis contracts, steady demand across established generic API portfolios, and operating leverage, Divi’s Laboratories posted a 65.50% year-on-year (YoY) surge in Consolidated Net Profit (PAT) to ₹902 crore, compared to ₹545 crore reported in the corresponding quarter of the previous fiscal year (Q1 FY26).
Consolidated Revenue from Operations expanded 27.80% YoY to ₹3,080 crore, while Total Income reached ₹3,144 crore. A standout highlight of the earnings release was the massive expansion in operating profitability: the company’s EBITDA margin expanded by 1,050 basis points YoY to hit 40.75%.
+-------------------------------------------------------------------------+
|                  DIVI'S LABS Q1 FY27 EARNINGS FLASH                     |
+-------------------------------------------------------------------------+
| Revenue from Operations : ₹3,080 Cr (+27.80% YoY | +8.80% QoQ)           |
| Total Income            : ₹3,144 Cr (+24.32% YoY | +5.29% QoQ)           |
| Consolidated PAT        : ₹902 Cr   (+65.50% YoY | +20.11% QoQ)          |
| EBITDA Margin           : 40.75%    (+1,050 bps YoY | +776 bps QoQ)      |
| Basic & Diluted EPS     : ₹33.95    (vs ₹20.49 in Q1 FY26)             |
+-------------------------------------------------------------------------+
(Data Source: Official Exchange Filings & Press Release dated August 01, 2026)
Whether you are a retail shareholder tracking your portfolio, an equity research analyst evaluating sector momentum, or an institutional investor eyeing long-term compounders in the Indian pharmaceutical space, this detailed analysis provides a complete breakdown of Divi’s Laboratories’ performance in Q1 FY27.
QUICK HIGHLIGHTS TABLE
The table below provides a high-level summary of Divi’s Laboratories’ key performance indicators for Q1 FY27 alongside historical context:
| Metric | Q1 FY27 | Q1 FY26 | YoY Growth (%) | Q4 FY26 | QoQ Growth (%) |
| Revenue from Operations | ₹3,080 Cr | ₹2,410 Cr | +27.80% | ₹2,831 Cr | +8.80% |
| Total Income | ₹3,144 Cr | ₹2,529 Cr | +24.32% | ₹2,986 Cr | +5.29% |
| EBITDA Margin (%) | 40.75% | 30.25% | +1,050 bps | 32.99% | +776 bps |
| Profit Before Tax (PBT) | ₹1,180 Cr | ₹733 Cr | +60.98% | ₹963 Cr | +22.53% |
| Profit After Tax (PAT) | ₹902 Cr | ₹545 Cr | +65.50% | ₹751 Cr | +20.11% |
| PAT Margin (%) | 29.29% | 22.61% | +668 bps | 26.53% | +276 bps |
| Basic & Diluted EPS | ₹33.95 | ₹20.49 | +65.69% | ₹28.31 | +19.92% |
| Total Debt | ₹0 (Zero Debt) | ₹0 | Debt-Free | ₹0 | Debt-Free |
| Forex Gain / (Loss) | (₹7 Cr) | ₹39 Cr | N/A | ₹90 Cr | N/A |
| Promoter Holding | 51.88% | 51.88% | Unchanged | 51.88% | Unchanged |
COMPANY OVERVIEW
History & Evolution
Founded in 1990 by Dr. Murali K. Divi, a renowned process chemist, Divi’s Laboratories Limited has grown from a specialized research and development consultancy into one of the world’s top bulk drug manufacturers and contract synthesis partners. Headquartered in Hyderabad, Telangana, the company completed its initial public offering (IPO) in 2003 and has consistently delivered superior return metrics while operating with a completely debt-free balance sheet.
+-----------------------------------------------------------------------+
|                   DIVI'S LABORATORIES AT A GLANCE                     |
+-----------------------------------------------------------------------+
| Business Verticals : Generic APIs, Custom Synthesis (CRAMS),          |
|                      Nutraceuticals                                   |
| Manufacturing Hubs : Unit 1 (Lingampally, Hyderabad)                  |
|                      Unit 2 (Choutuppal, Nalgonda)                    |
|                      Unit 3 (Kippada/Vizag & Kakinada Greenfield)    |
| Export Footprint   : 100+ Countries (85%+ Revenue from Exports)       |
| Key Edge           : Complete Backward Integration, Chemistry Mastery |
+-----------------------------------------------------------------------+
Business Model & Verticals
Divi’s Laboratories operates an integrated manufacturing business model built around three primary revenue pillars:
                                  +---------------------------------------+
                                  |     DIVI'S LABORATORIES BUSINESS     |
                                  +---------------------------------------+
                                                      |
         +--------------------------------------------+--------------------------------------------+
         |                                            |                                            |
[GENERIC APIs]                               [CUSTOM SYNTHESIS]                           [NUTRACEUTICALS]
  • Naproxen, Dextromethorphan,                 • Dedicated CRAMS for Big Pharma            • Carotenoids, Vitamins,
    Gabapentin, Valsartan, Levodopa               • IP-protected contract manufacturing         Canthaxanthin, Astaxanthin
  • Market share leadership                     • High-margin, long-term contracts          • Human & animal nutrition
Generic Active Pharmaceutical Ingredients (APIs): Divi’s is the global market leader in several core API molecules, including Naproxen, Dextromethorphan, Gabapentin, Levodopa, and Valsartan. The company commands over 60–70% global market share in select key APIs due to its low-cost manufacturing processes and scale.
Custom Synthesis (Contract Research & Manufacturing Services – CRAMS): Divi’s acts as a preferred CDMO/CRAMS partner for global innovator pharmaceutical companies. This segment involves custom development and commercial-scale manufacturing of active ingredients for patented drugs under strict intellectual property non-disclosure agreements.
Nutraceutical Ingredients: Divi’s manufactures a specialized range of high-grade carotenoids (including Beta-carotene, Lycopene, Astaxanthin, and Canthaxanthin) and nutritional ingredients for human and animal health applications.
Global Presence & Manufacturing Infrastructure
Divi’s operates large-scale, USFDA-inspected manufacturing complexes across India:
Unit 1 (Telangana): Located at Lingampally near Hyderabad, housing major manufacturing blocks, pilot plants, and advanced R&D centers.
Unit 2 (Visakhapatnam, Andhra Pradesh): A massive integrated API manufacturing facility located at Choutuppal and Chippada, featuring multi-purpose production blocks and export-oriented units.
Unit 3 (Kakinada, Andhra Pradesh): A greenfield manufacturing facility being built over ~500 acres to support future growth in custom synthesis contracts and generic APIs.
Q1 FY27 FINANCIAL PERFORMANCE
Divi’s Laboratories delivered strong operational performance during Q1 FY27, marked by robust top-line growth and impressive margin recovery.
Revenue & Top-Line Dynamics
Consolidated Revenue from Operations grew 27.80% YoY to ₹3,080 crore in Q1 FY27, up from ₹2,410 crore in Q1 FY26. On a sequential (QoQ) basis, operational revenue increased by 8.80% from ₹2,831 crore in Q4 FY26.
Total Income reached ₹3,144 crore, representing a 24.32% YoY growth over Q1 FY26 (₹2,529 crore) and a 5.29% QoQ increase over Q4 FY26 (₹2,986 crore). The top-line expansion was driven by a sharp acceleration in custom synthesis execution, steady order inflows from North America and Europe, and stable pricing across key generic API portfolios.
+-----------------------------------------------------------------------+
|                    QUARTERLY REVENUE TRAJECTORY                       |
+-----------------------------------------------------------------------+
| Q1 FY26 : ₹2,410 Cr                                                   |
| Q2 FY26 : ₹2,338 Cr                                                   |
| Q3 FY26 : ₹2,981 Cr                                                   |
| Q4 FY26 : ₹2,831 Cr                                                   |
| Q1 FY27 : ₹3,080 Cr  [+27.80% YoY | +8.80% QoQ]                      |
+-----------------------------------------------------------------------+
(Data Source: Official Stock Exchange Disclosures)
Profitability & Margin Expansion
The most impressive feature of Divi’s Q1 FY27 performance was its operating leverage and margin expansion:
EBITDA Margin: Consolidated EBITDA margin expanded by a dramatic 1,050 basis points YoY to reach 40.75%, compared to 30.25% in Q1 FY26 and 32.99% in Q4 FY26.
Profit Before Tax (PBT): PBT grew 60.98% YoY to ₹1,180 crore, compared to ₹733 crore in Q1 FY26 and ₹963 crore in Q4 FY26.
Profit After Tax (PAT): Consolidated net profit surged 65.50% YoY to ₹902 crore, up from ₹545 crore in Q1 FY26 and ₹751 crore in Q4 FY26.
PAT Margin: Net profit margin improved to 29.29%, expanding by 668 bps YoY and 276 bps QoQ.
Earnings Per Share (EPS): Basic and Diluted EPS rose to ₹33.95 per share, up 65.69% YoY from ₹20.49 in Q1 FY26.
+-----------------------------------------------------------------------+
|                   CONSOLIDATED INCOME STATEMENT TABLE                 |
|                      (All values in ₹ Crore)                          |
+-----------------------------------------------------------------------+
| Particulars                   | Q1 FY27  | Q4 FY26  | Q1 FY26  | YoY %|
+-------------------------------+----------+----------+----------+------+
| Revenue from Operations       |  3,080   |  2,831   |  2,410   |27.80%|
| Other Income                  |     64   |    155   |    119   |-46.21|
| Total Income                  |  3,144   |  2,986   |  2,529   |24.32%|
| Cost of Raw Materials Consumed|  1,503   |  1,214   |  1,010   |48.81%|
| Inventory Changes (Increase)  |   (517)  |    (95)  |    (54)  | N/A  |
| Employee Benefit Expense      |    408   |    381   |    340   |20.00%|
| Depreciation & Amortization   |    133   |    120   |    112   |18.75%|
| Finance Costs                 |      6   |      6   |      3   |100.0%|
| Other Operating Expenses      |    431   |    397   |    385   |11.95%|
| Total Expenses                |  1,964   |  2,023   |  1,796   | 9.35%|
| Profit Before Tax (PBT)       |  1,180   |    963   |    733   |60.98%|
| Current Tax                   |    291   |    249   |    191   |52.36%|
| Deferred Tax                  |    (13)  |    (37)  |     (3)  | N/A  |
| Net Profit After Tax (PAT)    |    902   |    751   |    545   |65.50%|
+-------------------------------+----------+----------+----------+------+
(Data Source: Official Unaudited Consolidated Financial Statements for Q1 FY27)
STANDALONE vs CONSOLIDATED BREAKDOWN
Divi’s Laboratories operates through its primary parent entity in India alongside two wholly owned international subsidiaries: Divis Laboratories (USA) Inc. and Divi’s Laboratories Europe AG. The table below highlights the minor variance between standalone and consolidated figures for Q1 FY27:
| Financial Metric (₹ Crore) | Standalone (Parent) | Consolidated (Group) | Subsidiary Contribution |
| Revenue from Operations | ₹2,974 Cr | ₹3,080 Cr | ₹106 Cr (International distribution) |
| Other Income | ₹63 Cr | ₹64 Cr | ₹1 Cr |
| Total Income | ₹3,037 Cr | ₹3,144 Cr | ₹107 Cr |
| Total Expenses | ₹1,872 Cr | ₹1,964 Cr | ₹92 Cr |
| Profit Before Tax (PBT) | ₹1,165 Cr | ₹1,180 Cr | ₹15 Cr |
| Tax Expense | ₹274 Cr | ₹278 Cr | ₹4 Cr |
| Profit After Tax (PAT) | ₹891 Cr | ₹902 Cr | ₹11 Cr |
| Basic & Diluted EPS (₹) | ₹33.55 | ₹33.95 | +₹0.40 per share |
MANAGEMENT COMMENTARY & GUIDANCE
During the earnings conference call following the board meeting on August 01, 2026, Divi’s Laboratories’ senior leadership—led by CEO Dr. Kiran S. Divi—provided key operational updates and strategic insights:
+-----------------------------------------------------------------------+
|                    MANAGEMENT COMMENTARY HIGHLIGHTS                   |
+-----------------------------------------------------------------------+
| Growth Guidance   : Double-digit top-line growth target maintained for|
|                     full year FY27                                    |
| Major Capex Status: 3 dedicated Custom Synthesis projects are ~70%    |
|                     complete with ~₹2,000 Cr outlay                  |
| Capital Work (CWIP): Stands at ₹2,034 Crore as of June 30, 2026       |
| Unit 3 Kakinada   : Commercialization & validation batches progressing |
+-----------------------------------------------------------------------+
(Data Source: Q1 FY27 Earnings Call Summary & Disclosures)
Key Comments & Growth Guidance
FY27 Growth Outlook: Management reaffirmed its guidance of achieving double-digit revenue growth throughout FY27. While quarterly top-line numbers may fluctuate due to campaign-based manufacturing schedules, the overarching demand trend across Custom Synthesis and Generic APIs remains strong.
Capex Execution & Project Pipeline: Three large-scale capital expenditure projects dedicated to commercializing big pharma custom synthesis contracts are approximately 70% complete, representing a combined capital outlay of roughly ₹2,000 crore.
Capital Work in Progress (CWIP): Total Capital Work in Progress stood at ₹2,034 crore at the end of Q1 FY27. These investments will drive revenue growth over the next 2–3 years as validation batches transition to commercial sales.
Senior Management Appointments: The Board of Directors approved the inclusion of two veteran operational leaders into the Senior Management Personnel category with effect from August 01, 2026:
Mr. B. Vara Prasad: General Manager (Engineering Purchase), with over 31 years of experience in supply chain and capital procurement at Divi’s.
Mr. J. Srinivasa Rao: General Manager (Raw Materials Purchase), with over 30 years of expertise in raw material sourcing and global vendor development.
SEGMENT ANALYSIS
Divi’s Laboratories evaluates its operations under a single reportable primary business segment: Active Pharmaceutical Ingredients, Intermediates, and Nutraceutical Ingredients in accordance with Ind AS 108. However, analyzing the business by product category provides useful visibility into underlying trends:
+-----------------------------------------------------------------------+
|                   PRODUCT CATEGORY REVENUE BREAKDOWN                  |
+-----------------------------------------------------------------------+
|  Custom Synthesis (CRAMS) : ~45% - 50% Revenue Share (High Margin)    |
|  Generic APIs             : ~42% - 46% Revenue Share (Steady Volume)  |
|  Nutraceuticals           : ~8%  - 10% Revenue Share (Stable Cash)   |
+-----------------------------------------------------------------------+
1. Custom Synthesis (CDMO / CRAMS)
Trend Analysis: Custom synthesis was the primary driver of growth in Q1 FY27. As global innovator pharmaceutical companies seek to diversify supply chains away from China (the “China+1” strategy) and align with legislative frameworks like the US Biosecure Act, Divi’s has secured an increasing share of high-value chemistry projects.
Margin Impact: Because custom synthesis projects carry higher pricing power and proprietary manufacturing IP, the higher revenue contribution directly supported the expansion in EBITDA margin to 40.75%.
2. Generic APIs
Trend Analysis: Core generic API volumes for flagship products (Naproxen, Dextromethorphan, Gabapentin) remained stable. Raw material price stabilization and process chemistry efficiencies helped restore profitability in this segment.
Future Opportunity: Divi’s is preparing to launch several generic APIs as major global drugs face patent expirations between FY26 and FY28. Qualification and validation batches are currently underway.
3. Nutraceuticals
Trend Analysis: The nutraceutical division delivered steady revenues, driven by demand for carotenoids in human nutrition, dietary supplements, and food coloring applications.
INDUSTRY & MACROECONOMIC ANALYSIS
The Indian API & CRAMS Advantage
India’s active pharmaceutical ingredient (API) and contract manufacturing (CDMO) sectors are benefiting from structural growth drivers:
+-----------------------------------------------------------------------+
|                      STRUCTURAL INDUSTRY TAILWINDS                    |
+-----------------------------------------------------------------------+
|  1. US Biosecure Act & Geopolitical Realignment (China+1 Shift)       |
|  2. Global Patent Expirations ($200B+ worth of drugs expiring)        |
|  3. Indian Government's Production Linked Incentive (PLI) Schemes     |
|  4. Increasing Outsourcing Intensity by Big Pharma Innovators         |
+-----------------------------------------------------------------------+
China+1 Strategy & US Biosecure Act: Western pharmaceutical innovators are shifting critical drug substance supply chains away from Chinese vendors due to regulatory and geopolitical considerations. Divi’s, with its large production capacity and strong USFDA compliance track record, is well-positioned to capture these outsourced contracts.
Patent Cliff Opportunities: Over $200 billion worth of global pharmaceutical sales are set to lose patent protection over the next five years. Divi’s strategy of developing non-infringing processes years in advance positions it to secure early-mover market share upon generic entry.
Supply Chain Vertical Integration: Divi’s key competitive advantage is its extensive backward integration. By manufacturing basic chemistry starting materials internally, the company protects itself from raw material price volatility and supply chain disruptions.
COMPETITOR COMPARISON
Comparing Divi’s Laboratories with its leading peers in the Indian pharmaceutical and API ecosystem highlights its unique margin profile and valuation dynamics:
+-----------------------------------------------------------------------------------+
|                            PEER COMPARISON MATRIX                                 |
+----------------------+------------------+---------------+----------------+--------+
| Company Name         | Market Cap (₹ Cr)| TTM P/E Ratio | EBITDA Margin  | Debt   |
+----------------------+------------------+---------------+----------------+--------+
| Divi's Laboratories  |   ~₹1,95,900 Cr  |   ~65x - 70x  |  40.75% (Q1)   | Zero   |
| Sun Pharma           |   ~₹4,10,000 Cr  |   ~35x - 38x  |  ~27% - 29%    | Low    |
| Dr. Reddy's Lab      |   ~₹1,15,000 Cr  |   ~18x - 20x  |  ~28% - 30%    | Low    |
| Cipla                |   ~₹1,25,000 Cr  |   ~28x - 30x  |  ~24% - 26%    | Zero   |
| Laurus Labs          |    ~₹25,000 Cr   |   ~55x - 60x  |  ~18% - 22%    | Moderate|
+----------------------+------------------+---------------+----------------+--------+
(Market Cap as of August 2026; Metrics based on trailing annual disclosures)
Key Takeaways from Peer Comparison
Margin Leadership: Divi’s EBITDA margin of 40.75% in Q1 FY27 significantly leads both pure-play API peers and diversified formulation companies.
Valuation Premium: Divi’s trades at a higher Price-to-Earnings (P/E) multiple compared to formulation peers like Dr. Reddy’s or Cipla. This premium reflects its debt-free status, specialized chemistry moat, high return ratios, and lack of direct generic formulation pricing pressure.
SHAREHOLDING PATTERN
Data as of Quarter Ended June 30, 2026 (Q1 FY27)
+-----------------------------------------------------------------------+
|                   DIVI'S LABS SHAREHOLDING PATTERN                    |
+-----------------------------------------------------------------------+
|  Promoter & Promoter Group : 51.88% (Unpledged)                      |
|  Foreign Institutional (FIIs): ~15.5% - 16.5%                        |
|  Domestic Institutional (DIIs): ~21.0% - 22.5%                        |
|  Public & Retail Shareholders: ~10.0% - 11.0%                        |
+-----------------------------------------------------------------------+
Institutional Investor Context
Promoter Stability: Promoters hold a controlling 51.88% equity stake with zero encumbrance or share pledges.
Institutional Backing: Mutual Funds and Foreign Portfolio Investors together hold over 37% of the equity, reflecting strong institutional sponsorship.
FINANCIAL RATIO ANALYSIS
The table below outlines key financial ratios for Divi’s Laboratories based on Q1 FY27 annualised performance:
| Ratio Category | Financial Metric | Q1 FY27 (Annualized/Actual) | Strategic Context |
| Profitability | EBITDA Margin (%) | 40.75% | Industry-leading operational efficiency |
| Profitability | Net Profit (PAT) Margin | 29.29% | Strong net income conversion |
| Return Ratios | Return on Equity (ROE) | ~19.5% – 21.0% | Rebounding toward historical peak levels |
| Return Ratios | Return on Capital Employed | ~24.0% – 26.0% | Driven by debt-free capital structure |
| Solvency | Debt-to-Equity Ratio | 0.00 (Zero Debt) | Complete financial independence |
| Solvency | Interest Coverage Ratio | >190x | Finance costs are negligible (₹6 Cr) |
| Per Share | Basic & Diluted EPS | ₹33.95 per share | +65.69% YoY increase |
SWOT ANALYSIS
+-----------------------------------------------------------------------+
|                     DIVI'S LABORATORIES SWOT MATRIX                   |
+-----------------------------------------------------------------------+
| STRENGTHS                             | WEAKNESSES                    |
| • Global market share leader in core  | • High revenue concentration in|
|   APIs (Naproxen, Dextromethorphan)   |   top 5-10 core molecules     |
| • Industry-leading 40.75% EBITDA margin| • Longer gestation timeline for|
| • Zero-debt balance sheet with strong |   custom synthesis validation |
|   cash reserves                       |   batches                      |
+---------------------------------------+-------------------------------+
| OPPORTUNITIES                         | THREATS                       |
| • US Biosecure Act & China+1 shift    | • Unexpected regulatory inspection|
| • Kakinada Unit 3 commercialization   |   action from USFDA/EMA       |
| • Expansion into peptides, contrast   | • Sharp appreciation of INR    |
|   media, and high-potency APIs        |   against USD/EUR             |
+---------------------------------------+-------------------------------+
RISK FACTORS
Regulatory Compliance Risk: Like all export-oriented API manufacturers, Divi’s is subject to rigorous USFDA, EMA, and PMDA regulatory audits. While Divi’s maintains a strong regulatory track record, any adverse inspection observations could impact facility approvals.
Foreign Exchange Fluctuation: Over 85% of Divi’s revenues are derived from exports denominated in USD and EUR. In Q1 FY27, the company recorded a foreign exchange loss of ₹7 crore (compared to a gain of ₹39 crore in Q1 FY26).
Raw Material Price Volatility: Key starting materials (KSMs) sourced internationally remain subject to price swings, though internal backward integration mitigates this risk.
FUTURE GROWTH CATALYSTS
+-----------------------------------------------------------------------+
|                      FUTURE GROWTH CATALYSTS                          |
+-----------------------------------------------------------------------+
| 1. Unit 3 Kakinada Commercial Ramp-Up (500-acre greenfield site)      |
| 2. Commercialization of 3 Big-Pharma Custom Synthesis Contracts       |
| 3. Entry into Contrast Media Active Ingredients (Iopamidol, etc.)     |
| 4. Expansion of Peptide Chemistry Manufacturing Capabilities          |
+-----------------------------------------------------------------------+
Kakinada Greenfield Facility (Unit 3): Divi’s 500-acre Kakinada complex will provide long-term capacity expansion for both custom synthesis and generic APIs.
Dedicated CRAMS Projects: The ₹2,000 crore capital expenditure program dedicated to three custom synthesis contracts is 70% complete. Validation batches will convert into commercial revenue streams over coming quarters.
Contrast Media & Peptides: Divi’s is expanding its capability into iodinated contrast media products and peptide drug substances, entering high-barrier specialized categories.
ANALYST VIEW & INVESTMENT THESIS
Brokerage & Institutional View
Following the Q1 FY27 results announcement, institutional consensus remains overall positive on Divi’s Laboratories, supported by its margin recovery and custom synthesis order pipeline.
+-----------------------------------------------------------------------+
|                      ANALYST SCENARIO ANALYSIS                        |
+-----------------------------------------------------------------------+
| BULL CASE : Rapid commercial ramp-up at Unit 3 Kakinada, sustained    |
|             40%+ EBITDA margins, and major custom synthesis contract  |
|             wins under the US Biosecure Act alignment.                |
|                                                                       |
| BASE CASE : Double-digit top-line growth (~12%-15%), EBITDA margins   |
|             stabilizing around 35%-38%, steady generic market share.  |
|                                                                       |
| BEAR CASE : Delay in custom synthesis validation timelines, regulatory|
|             issues at major units, or sharp generic pricing declines. |
+-----------------------------------------------------------------------+
IS THE STOCK A BUY?
Short-Term Outlook (1–3 Months): The stock’s positive price momentum following Q1 results reflects strong operational performance. Near-term trading will be influenced by broader market conditions and progress on capital projects.
Long-Term Outlook (3–5+ Years): Divi’s Laboratories remains a compelling structural growth story in the Indian pharmaceutical industry, backed by its process chemistry moat, backward integration, debt-free balance sheet, and leadership in global API supply chains.
Suitable Investor Profile: Long-term growth investors seeking exposure to global pharmaceutical outsourcing, API market expansion, and high-quality corporate governance.
CONCLUSION
Divi’s Laboratories’ Q1 FY27 results demonstrate strong operational performance. With consolidated net profit surging 65.50% to ₹902 crore, revenue expanding to ₹3,080 crore, and EBITDA margins reaching 40.75%, the company has demonstrated the power of its process chemistry moat and backward integrated business model.
As new capacity at Unit 3 Kakinada comes online and dedicated custom synthesis projects transition from validation to commercial production, Divi’s is well-positioned to capitalize on global supply chain realignments in the pharmaceutical industry. Operating with a debt-free balance sheet, high return ratios, and an experienced management team, Divi’s Laboratories remains a high-quality anchor asset for long-term investors in the capital markets.



