

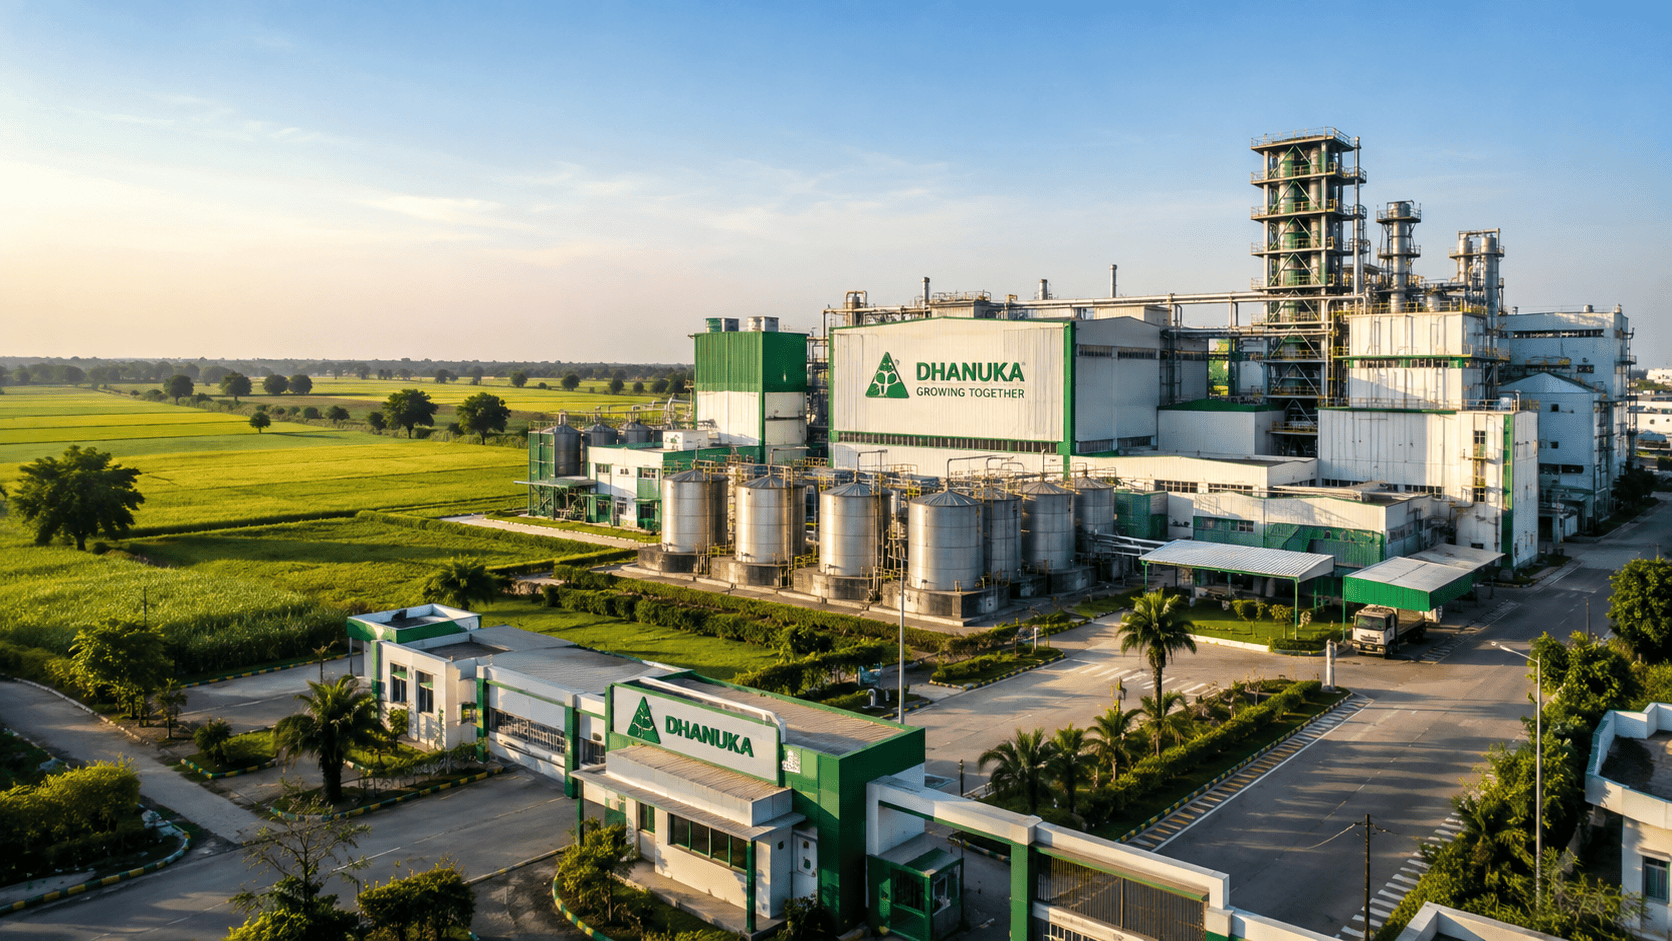
Gurugram, India — Leading Indian crop protection manufacturer Dhanuka Agritech Limited reported its unaudited financial results for the first quarter of Financial Year 2026–27 (Q1 FY27) ended June 30, 2026. Following its Board of Directors meeting on August 3, 2026, the company disclosed a operational performance reflecting seasonal shifts in domestic demand, raw material cost trends, and strategic capital allocation decisions—including a major ₹200-crore manufacturing expansion in Nagpur.
The announcement comes at a pivotal juncture for the Indian agrochemical industry as monsoon distribution patterns, global raw material pricing dynamics, and changing crop protection protocols continue to shape market returns.
Here is a comprehensive financial and strategic analysis of Dhanuka Agritech’s performance, balance sheet health, operational highlights, valuation multiples, and long-term outlook.
What Happened in Q1 FY27? Executive Overview
Dhanuka Agritech recorded a standalone revenue from operations of ₹451.93 crore for Q1 FY27, representing a 14.45% decline year-on-year (YoY) compared to ₹528.29 crore in Q1 FY26. Net profit after tax (PAT) for the quarter stood at ₹36.30 crore, down 34.59% YoY from ₹55.50 crore in the corresponding prior-year period.
The company’s performance was impacted by spatial variations in monsoon progression across key agricultural states during June, which shifted early-season input purchases into the subsequent quarter. Higher other operating expenses relative to top-line realizations further compressed near-term margins.
Despite the quarter-on-quarter and year-on-year top-line consolidation, Dhanuka’s management announced major strategic corporate initiatives:
₹200 Crore Greenfield Capex: Board approval for setting up a brand-new pesticide manufacturing facility in Nagpur, Maharashtra, with an annual capacity of 23,000 MT.
Share Buyback Completion: Successfully completed and extinguished a ₹70-crore equity share buyback (5,00,000 shares at ₹1,400 per share) in June 2026.
Employee Welfare Trust Loan: Sanctioned a ₹15-crore loan to the Dhanuka Employee Stock Benefits Trust to implement the Stock Appreciation Rights Plan (SAR 2026).
+-------------------------------------------------------------------------------+
|                       DHANUKA AGRITECH Q1 FY27 SNAPSHOT                        |
+-------------------------------------------------------------------------------+
|  Revenue from Operations : ₹451.93 Cr   (vs ₹528.29 Cr in Q1 FY26 | -14.45%)  |
|  Total Income            : ₹470.79 Cr   (vs ₹536.33 Cr in Q1 FY26 | -12.22%)  |
|  Net Profit (PAT)        : ₹36.30 Cr    (vs ₹55.50 Cr in Q1 FY26  | -34.59%)  |
|  Basic EPS                : ₹8.06 per sh (vs ₹12.31 in Q1 FY26   | -34.52%)  |
|  New Capex Outlay        : ₹200.00 Cr   (Pesticide Unit in Nagpur, MH)        |
+-------------------------------------------------------------------------------+
Company Profile: Dhanuka Agritech at a Glance
Dhanuka Agritech Limited is one of India’s foremost agrochemical enterprises, featuring a comprehensive product presence across herbicides, fungicides, insecticides, and plant growth regulators (PGRs).
With a strong focus on technical formulation excellence and strategic partnerships with multinational crop science pioneers (including Japanese and European technology holders), Dhanuka serves millions of farmers across India’s agricultural belts.
Operational Structure & Reach
Business Model: Pure-play crop protection and plant health management solutions company.
Domestic Distribution Network: Over 6,500 distributors and 80,000 retail touchpoints connecting with over 10 million farmers.
Manufacturing Facilities: Advanced manufacturing and formulation units located at Gurgaon and Sohna (Haryana), Sanand (Gujarat), Udhampur (Jammu & Kashmir), and Keshwana (Rajasthan).
Research & Development: NABL-accredited R&D facilities specializing in modern formulation technologies, bio-pesticides, and crop-specific protection solutions.
Product Form Formats: Granules, Emulsifiable Concentrates (EC), Suspension Concentrates (SC), Water Dispersible Granules (WDG), and Soluble Powders (SP).
Q1 FY27 Financial Highlights: Complete Data Tables
The following tables summarize the financial results filed by Dhanuka Agritech Limited with the National Stock Exchange (NSE) and BSE Limited.
Quarterly Standalone Profit & Loss Summary
| Financial Metric | Q1 FY27 (Ended Jun 30, 2026) PDF | Q4 FY26 (Ended Mar 31, 2026) PDF | Q1 FY26 (Ended Jun 30, 2025) PDF | YoY Growth (%) | QoQ Growth (%) |
Revenue from Operations | ₹451.93 Cr | ₹483.34 Cr | ₹528.29 Cr | -14.45% | -6.50% |
Other Income | ₹8.86 Cr | ₹20.53 Cr | ₹8.04 Cr | +10.20% | -56.84% |
Total Income | ₹470.79 Cr | ₹503.86 Cr | ₹536.33 Cr | -12.22% | -6.56% |
Cost of Materials Consumed | ₹287.13 Cr | ₹292.79 Cr | ₹361.46 Cr | -20.56% | -1.93% |
Stock-in-Trade Purchases | ₹14.44 Cr | ₹15.11 Cr | ₹27.31 Cr | -47.12% | -4.43% |
Inventory Changes (Finished/WIP) | (₹2.07 Cr) | (₹30.44 Cr) | (₹50.82 Cr) | N/A | N/A |
Employee Benefit Expenses | ₹46.47 Cr | ₹50.37 Cr | ₹46.69 Cr | -0.47% | -7.74% |
Finance Costs | ₹0.81 Cr | ₹0.79 Cr | ₹1.30 Cr | -37.69% | +2.53% |
Depreciation & Amortization | ₹14.49 Cr | ₹16.31 Cr | ₹15.39 Cr | -5.85% | -11.16% |
Other Expenses | ₹60.94 Cr | ₹30.61 Cr | ₹60.46 Cr | +0.79% | +99.08% |
Total Expenses | ₹422.22 Cr | ₹375.55 Cr | ₹461.79 Cr | -8.57% | +12.43% |
Profit Before Tax (PBT) | ₹48.57 Cr | ₹128.31 Cr | ₹74.55 Cr | -34.85% | -62.15% |
Tax Expense (Current + Deferred) | ₹12.27 Cr | ₹30.54 Cr | ₹19.04 Cr | -35.56% | -59.82% |
Net Profit After Tax (PAT) | ₹36.30 Cr | ₹97.77 Cr | ₹55.50 Cr | -34.59% | -62.87% |
Paid-up Equity Capital | ₹8.92 Cr | ₹9.02 Cr | ₹9.02 Cr | -1.11% | -1.11% |
Basic & Diluted EPS (₹) | ₹8.06 | ₹21.69 | ₹12.31 | -34.52% | -62.84% |
Key Balance Sheet & Fundamental Ratios
| Financial & Valuation Ratios | FY26 Full Year / Latest Value | Benchmark / Trajectory |
| TTM Earnings Per Share (EPS) | ₹63.72 per share | Base FY26 full year |
| Price-to-Earnings (P/E) Ratio | ~15.8x – 15.9x | Market price ~₹1,008 – ₹1,023 |
| Price-to-Book (P/B) Ratio | ~2.7x – 2.75x | Book Value ~₹373 – ₹377 / sh |
| Market Capitalization | ~₹4,498 – ₹4,613 Crore | Small-Cap Specialty Chemicals |
| Debt-to-Equity Ratio | 0.03x | Near debt-free balance sheet |
| Return on Equity (ROE) | ~18.62% | Healthy capital productivity |
| Return on Capital Employed (ROCE) | ~23.72% – 27.37% | Industry-leading capital efficiency |
In-Depth Financial & Operational Analysis
Top-Line Contraction Analysis
The top-line contraction during Q1 FY27 (Revenue down 14.45% YoY to ₹451.93 crore) highlights the direct sensitivity of the Indian agrochemical sector to monsoon entry dates. While the Southwest monsoon made a timely arrival on the southern coast of India in late May, its spatial distribution across key northern and central agricultural belts experienced brief dry spells in early June. As a result, farmers delayed purchasing herbicides and seed treatment chemicals, deferring sales volumes into July (Q2 FY27).
+--------------------------------------------------------------------------+
|                     REVENUE & MARGIN DYNAMICS (YoY)                      |
+--------------------------------------------------------------------------+
|  Q1 FY26 Revenue: ₹528.29 Cr  --->  Q1 FY27 Revenue: ₹451.93 Cr  (-14.5%)|
|  Q1 FY26 PAT    : ₹55.50 Cr   --->  Q1 FY27 PAT    : ₹36.30 Cr   (-34.6%)|
|  Material Cost  : ₹361.46 Cr  --->  Material Cost  : ₹287.13 Cr  (-20.6%)|
+--------------------------------------------------------------------------+
Cost Structure & Gross Margin Expansion
A positive takeaway from the financial results is Dhanuka’s raw material cost management.
Raw Material Costs: Cost of materials consumed dropped 20.56% YoY from ₹361.46 crore to ₹287.13 crore.
Gross Profit Dynamics: Lower raw material prices—driven by stabilizing chemical active ingredient (AI) import costs from global suppliers—helped protect core product margins.
Operating Expense Load: However, fixed administrative overheads and marketing expenses remained sticky, with ‘Other Expenses’ staying elevated at ₹60.94 crore. Consequently, lower operating leverage diluted profit before tax (PBT) down to ₹48.57 crore.
Major Strategic Announcements: Capital Deployment & Expansion
Alongside its earnings report, Dhanuka Agritech announced two capital allocation decisions that reflect management’s long-term growth outlook:
+------------------------------------------------------------------------------------+
|                         CAPITAL ALLOCATION INITIATIVES                             |
+------------------------------------------------------------------------------------+
|  1. Nagpur Greenfield Plant   : ₹200.00 Crore investment (23,000 MT capacity)      |
|  2. Equity Share Buyback      : ₹70.00 Crore completed (5,00,000 shares extinguished)|
|  3. Employee SAR Plan Trust   : ₹15.00 Crore loan for stock incentive plan         |
+------------------------------------------------------------------------------------+
1. ₹200 Crore Greenfield Manufacturing Unit in Nagpur
The Board approved an investment of up to ₹200 crore to establish a modern pesticide manufacturing unit at Nagpur, Maharashtra.
Proposed Annual Capacity: 23,000 Metric Tonnes (MT) per annum.
Target Operational Timeline: Expected to be operational by March/April 2028.
Mode of Financing: Funded through internal cash accruals and/or debt lines.
Strategic Rationale:
Positions manufacturing assets closer to primary high-volume agricultural markets in South, East, and Central India.
Optimizes supply chain logistics, cutting freight costs and lead times to retail channels.
Capitalizes on Maharashtra’s industrial incentive policies and Nagpur’s position as a central logistics hub under the Viksit Nagpur infrastructure plan.
2. Equity Share Buyback Completion
During Q1 FY27, Dhanuka completed the buyback of 5,00,000 fully paid equity shares (representing 1.11% of total share capital) at a price of ₹1,400 per share, amounting to ₹70.00 crore. The bought-back shares were officially extinguished on June 20, 2026, reducing paid-up share capital to ₹8.92 crore (face value ₹2 per share).
3. Employee Stock Appreciation Rights (SAR 2026)
To align long-term leadership incentives, the Board sanctioned a loan of up to ₹15 crore to the Dhanuka Employee Stock Benefits Trust to purchase equity shares from the open market under the “Dhanuka Stock Appreciation Rights Plan, 2026”.
Business Segment & Category Performance
Dhanuka Agritech operates in a single reporting segment under Ind AS 108: Agro Chemicals. However, analyzing its sub-category product portfolio reveals operational mechanics across crop protection needs:
+-----------------------------------------------------------------------------+
|                     CROP PROTECTION CATEGORY BREAKDOWN                      |
+-----------------------------------------------------------------------------+
|  Herbicides          : Primary growth engine during early Kharif sowing    |
|  Insecticides        : Volume recovery tied to pest infestation rates      |
|  Fungicides          : Weather-sensitive; dependent on rainfall humidity   |
|  Plant Health / PGRs : High-margin specialty solutions & biologicals       |
+-----------------------------------------------------------------------------+
Herbicides: Represents the largest product segment during the early Kharif quarter (paddy, soybean, cotton, and maize weed control).
Insecticides: Demand is closely linked to pest attack intensity during crop growth stages. Stabilizing technical prices has reduced channel destocking pressure.
Fungicides: Strongly correlated with humidity levels and rainfall continuity during crop vegetative stages.
Plant Growth Regulators (PGRs) & Bio-Solutions: High-margin specialty categories backed by fresh technology partnerships.
Agrochemical Industry Landscape & Macro Drivers
The performance of Indian crop protection companies in FY27 is shaped by several macroeconomic and environmental dynamics:
1. Southwest Monsoon Distribution Pattern
Agriculture contributes roughly 16-18% to India’s GDP and supports over half the national workforce. A normal, well-distributed monsoon across Central, Southern, and North-Western agricultural states directly influences acreage for key Kharif crops—such as paddy, pulses, oilseeds, cotton, and sugarcane. Delayed or concentrated rainfall shifts the window for chemical applications.
2. Global Active Ingredient (AI) Pricing & Destocking
After two years of inventory destocking and falling chemical active ingredient prices originating out of China, global supply chains are reaching pricing equilibrium. Lower input costs benefit formulators like Dhanuka by protecting unit gross margins, even when top-line pricing reflects lower retail prices per liter/kilogram.
3. Sustainable Agriculture & Biological Solutions
There is a structural policy shift toward integrated pest management (IPM), bio-pesticides, and safer chemical formulations. Companies expanding their biologicals portfolio and securing exclusive product registrations enjoy pricing power over generic commodity players.
SWOT Analysis: Dhanuka Agritech Ltd.
+-----------------------------------------------------------------------------------+
|                                  SWOT MATRIX                                      |
+-----------------------------------------------------------------------------------+
| STRENGTHS                                 | OPPORTUNITIES                         |
| • Near-zero debt balance sheet (D/E 0.03x)| • Greenfield capacity expansion at    |
| • Strong domestic distribution network    |   Nagpur (23,000 MT/annum by 2028)    |
| • Tie-ups with global agrochem MNCs       | • Expanding biologicals portfolio     |
| • Robust ROCE (~23-27%) & ROE (~18-22%)   | • Precision agri-tech & drone spraying|
+-------------------------------------------+---------------------------------------+
| WEAKNESSES                                | THREATS                               |
| • Quarterly performance seasonal bias     | • Climate change & monsoon variance   |
| • High reliance on domestic market sales  | • Raw material price spikes / imports |
| • Q1 FY27 top-line contraction (-14.5%)   | • Regulatory bans on select molecules |
+-----------------------------------------------------------------------------------+
Porter’s Five Forces Analysis
                      +----------------------------------+
                      | Threat of New Entrants: LOW      |
                      | High registration capital &      |
                      | distribution entry barriers      |
                      +----------------------------------+
                                       |
+----------------------------------+   v   +----------------------------------+
| Bargaining Power of Suppliers:   | ----->| Competitive Rivalry: HIGH        |
| MODERATE                         |       | Domestic generic players & MNC   |
| Diversified chemical sourcing    |       | formulators compete aggressively |
+----------------------------------+       +----------------------------------+
                                       ^
                                       |
                      +----------------------------------+
                      | Threat of Substitutes: LOW-MOD   |
                      | Bio-pesticides growing, but      |
                      | chemical crop protection core    |
                      +----------------------------------+
Threat of New Entrants (Low): Agrochemical registration processes under the Central Insecticides Board & Registration Committee (CIB&RC) require years of toxicological testing and field trials, creating a regulatory barrier to entry.
Bargaining Power of Suppliers (Moderate): Sourcing raw material Active Ingredients (AIs) from multiple international and domestic vendors limits supplier lock-in.
Bargaining Power of Buyers (Moderate): Farmers have access to competing brands, making field demonstrations and brand recall critical for maintaining pricing power.
Threat of Substitutes (Low to Moderate): Natural farming initiatives and biologicals are gaining attention, but chemical formulations remain indispensable for high-yield commercial farming.
Competitive Rivalry (High): Intense competition from domestic formulators (UPL, Rallis India, PI Industries, Sumitomo Chemical India, Bayer CropScience) mandates ongoing R&D investment and product launches.
Peer Comparison: Listed Agrochemical Companies
The following table compares Dhanuka Agritech against key peers in the Indian crop protection and specialty chemicals sector:
| Company Name | Market Cap (₹ Cr) | Trailing P/E (x) | P/B (x) | ROE (%) | Debt/Equity (x) | Key Strengths / Strategic Focus |
| Dhanuka Agritech | ~₹4,500 – ₹4,600 | ~15.8x | ~2.7x | 18.6% | 0.03x | Near debt-free, strong domestic brand presence |
| Sumitomo Chemical India | ~₹24,500 | ~42.0x | ~6.5x | ~20.5% | 0.01x | MNC parentage, proprietary product portfolio |
| Rallis India Ltd | ~6,200 | ~26.5x | ~3.1x | ~10.5% | 0.08x | Tata Group company, strong retail distribution |
| Bayer CropScience India | ~28,000 | ~35.0x | ~9.2x | ~26.0% | 0.02x | Premium hybrid seed & agrochemical portfolio |
| PI Industries | ~58,000 | ~36.5x | ~6.8x | ~22.4% | 0.04x | Global Custom Synthesis & Manufacturing (CSM) |
Data compiled from stock exchange disclosures and market research data.
Share Price Performance & Technical Indicators
Following the declaration of Q1 FY27 results on August 3, 2026, Dhanuka Agritech’s stock traded in a range on the National Stock Exchange (NSE) and BSE Limited:
Current Market Price (CMP): ~₹1,008 – ₹1,023 per share
Day Trading Range (Aug 3-4, 2026): ₹943.30 – ₹1,049.50
52-Week High / Low: ₹1,665.00 / ₹889.60
Key Moving Averages:
50-Day DMA: ~₹1,067.50
200-Day DMA: ~₹1,125.10
Valuation Multiples: The stock trades at a trailing price-to-earnings (P/E) multiple of ~15.8x, reflecting a discount compared to the broader agrochemical sector average of ~25x–30x.
+-------------------------------------------------------------------------------+
|                       STOCK TRADING & VALUATION MATRIX                        |
+-------------------------------------------------------------------------------+
|  Stock Ticker          : NSE: DHANUKA | BSE: 507717                 |
|  Current Share Price   : ₹1,008.10 - ₹1,023.30            |
|  52-Week Range         : ₹889.60 (Low) - ₹1,665.00 (High) |
|  Market Cap            : ₹4,498 - ₹4,613 Crore            |
|  Trailing P/E Ratio    : 15.8x - 15.9x              |
+-------------------------------------------------------------------------------+
Investment Thesis: Bull Case vs. Bear Case
Reasons to Consider Buying (The Bull Case)
Low Debt Balance Sheet: A debt-to-equity ratio of 0.03x provides financial independence and stability.
Growth Capex: The ₹200-crore Nagpur plant addition (23,000 MT capacity) provides a long-term production runway to serve markets in Central, Southern, and Eastern India.
Shareholder Returns: Active capital return policy evidenced by the ₹70-crore share buyback completed at ₹1,400 per share (a premium over market prices).
Discount Valuation: Trading at ~15.8x P/E, the stock trades at a valuation discount relative to high-multiple peers like Sumitomo Chemical and PI Industries.
Reasons for Caution (The Bear Case)
Near-Term Revenue Contraction: Top-line dropped 14.45% YoY in Q1 FY27, showing near-term headwinds from shifting monsoon buying patterns.
Monsoon Dependency: Performance remains heavily tied to rainfall distribution across central agricultural belts.
Commodity Price Volatility: Sourcing technical chemicals from international markets exposes gross margins to foreign exchange fluctuations and Chinese chemical supply cycles.
Conclusion
Dhanuka Agritech’s Q1 FY27 results reflect a quiet start to the financial year, with top-line revenue contracting 14.45% YoY to ₹451.93 crore due to early-season monsoon distribution shifts. However, the company’s long-term operational fundamentals remain solid: raw material cost pressures are easing, the balance sheet carries minimal debt (0.03x D/E), and management is actively deploying cash through a ₹200-crore greenfield plant expansion in Nagpur alongside a completed ₹70-crore share buyback.
As Kharif season chemical applications ramp up in Q2 FY27, investors will be monitoring volume recovery, channel distribution efficiency, and initial construction progress at the Nagpur manufacturing hub.



