

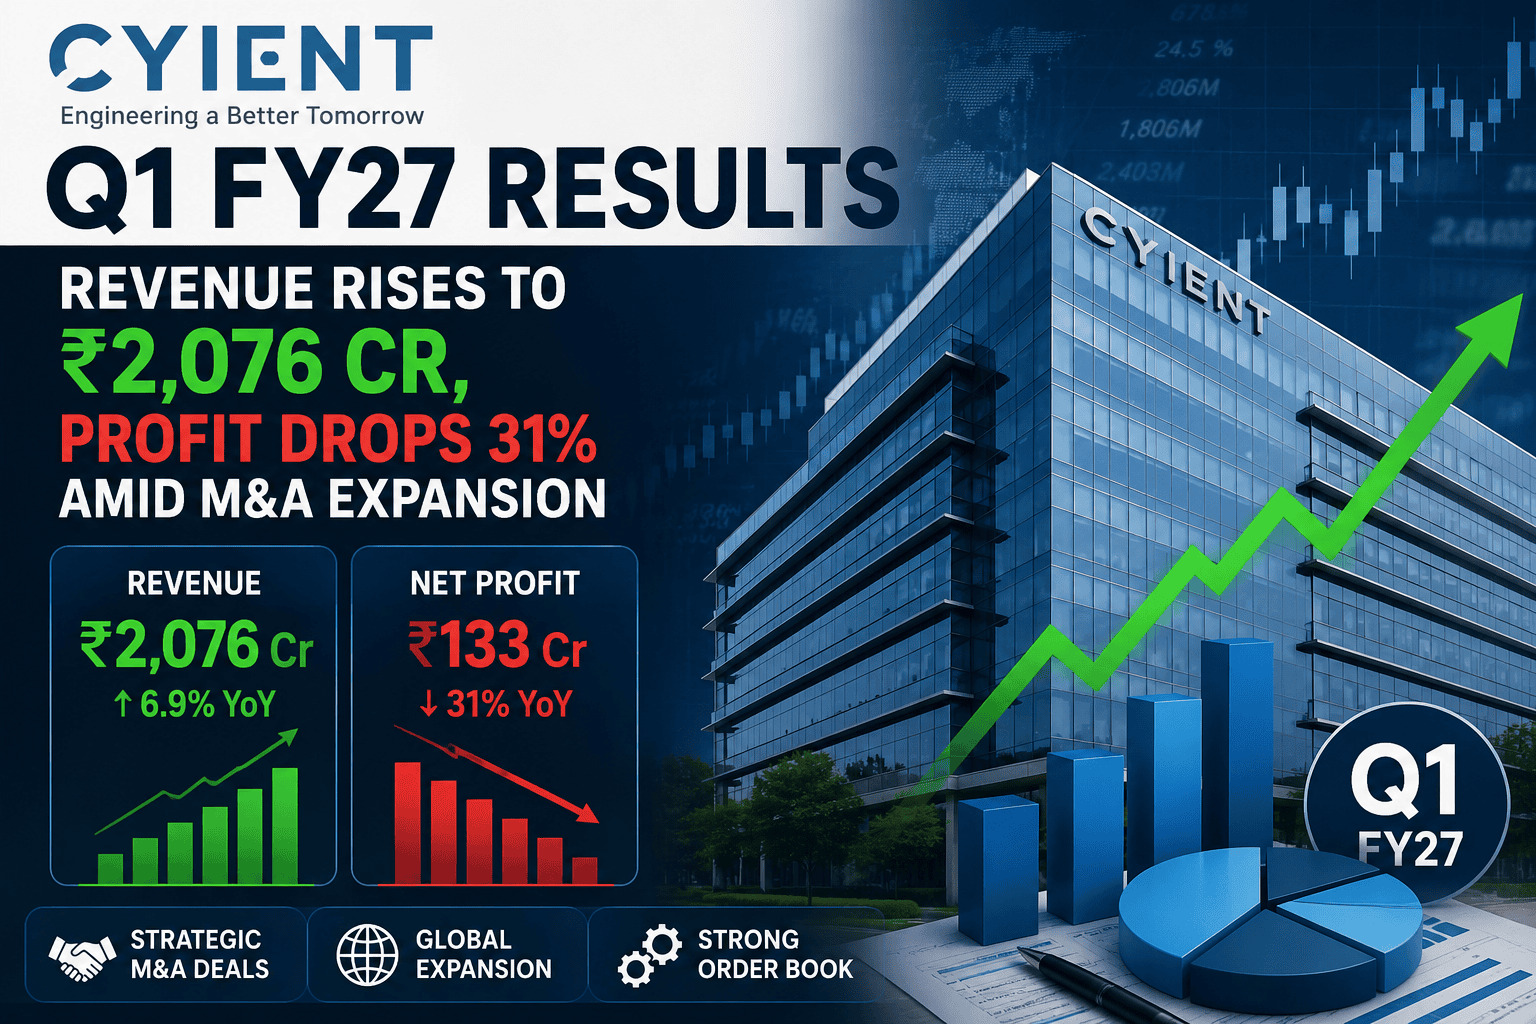
Global lifecycle engineering, manufacturing, and technology solutions provider Cyient Ltd. announced its Q1 FY27 financial results on July 23, 2026. While consolidated top-line revenue demonstrated expanded operational scale—jumping 21.26% YoY to ₹2,075.7 crore—profitability experienced noticeable pressure. Consolidated net profit for the quarter dropped 30.94% YoY to ₹108.7 crore (from ₹157.4 crore in Q1 FY26), driven by margin compression across core divisions and operating losses within its expanding semiconductor division.
The quarter was marked by strategic corporate moves, including the majority acquisition of Kinetic Technologies for $85 million, the execution of a Share Purchase Agreement to acquire AI-native product engineering firm TAO Digital Solutions for $218 million, and the successful completion of a ₹720 crore share buyback. On the National Stock Exchange (NSE), Cyient shares closed down 1.29% at ₹832.40 on July 23, 2026, as investors weighed near-term profitability pressures against long-term strategic transformation.
Executive Summary
Revenue Growth: Consolidated revenue from contracts with customers stood at ₹2,075.7 crore, marking a 21.26% YoY growth and a 7.72% QoQ increase.
Profitability Pressure: Consolidated Net Profit declined 30.94% YoY to ₹108.7 crore, though it surged 65.95% sequentially from ₹65.5 crore in Q4 FY26.
Segment Breakdown: Digital, Engineering & Technology (DET) segment revenue rose to ₹1,540.2 crore, Design Led Manufacturing (DLM) reached ₹373.8 crore, while Semiconductors revenue reached ₹169.7 crore.
Semiconductor Segment Drag: The Semiconductors vertical generated a segment loss of ₹28.4 crore, pulling down overall consolidated profitability.
Kinetic Technologies Acquisition: Completed majority acquisition (82.9%) of Cayman Islands-based Kinetic Technologies on April 8, 2026, for a net purchase consideration of $74 million (₹688.7 crore).
TAO Digital Deal: Signed SPA on May 30, 2026, to acquire 100% of TAO Digital Solutions Inc. for ~$218 million (pending regulatory approvals).
Share Buyback Completed: Successfully completed a tender offer share buyback of 64,00,000 equity shares (~5.76% of paid-up capital) at ₹1,125 per share totaling ₹720 crore (extinguished on July 15, 2026).
Board Changes: Approved the appointment of Mr. Muralidhar Yadama as an Independent Director for a 5-year term starting July 23, 2026.
Company Snapshot
Cyient Ltd. is an Indian global technology company focused on engineering, manufacturing, data analytics, networks, and operations management. Headquartered in Hyderabad, the company operates across three main reportable business segments:
Cyient Operating Structure & Core Segments
┌─────────────────────────────────────────────────────────────────┐
│ 1. Digital, Engineering & Technology (DET)                      │
│    • Transportation & Mobility (Aerospace, Rail, Automotive)    │
│    • Networks & Infrastructure (Connectivity, Utilities)        │
│    • Strategic Units (Mining, Energy, Healthcare, Life Sciences)│
├─────────────────────────────────────────────────────────────────┤
│ 2. Design Led Manufacturing (DLM - via Cyient DLM Ltd.)         │
│    • Electronics Manufacturing Services (EMS)                   │
├─────────────────────────────────────────────────────────────────┤
│ 3. Semiconductors                                               │
│    • Chip design, development & supply chain management         │
└─────────────────────────────────────────────────────────────────┘
Q1 FY27 Results at a Glance
The following table summarizes the consolidated financial performance of Cyient Ltd. for the quarter ended June 30, 2026 (Q1 FY27) compared with prior periods.
| Financial Metric (in ₹ Crores, except EPS) | Q1 FY27 (Unaudited) | Q4 FY26 (Audited) | Q1 FY26 (Unaudited) | YoY Growth (%) | QoQ Growth (%) |
Revenue from Operations | ₹2,075.70 | ₹1,926.90 | ₹1,711.80 | +21.26% | +7.72% |
Other Income | ₹6.90 | ₹26.60 | ₹69.70 | -90.10% | -74.06% |
Total Income | ₹2,082.60 | ₹1,953.50 | ₹1,781.50 | +16.90% | +6.61% |
Employee Benefits Expense | ₹1,122.80 | ₹1,044.00 | ₹963.30 | +16.56% | +7.55% |
Cost of Materials Consumed | ₹292.90 | ₹265.70 | ₹161.80 | +81.03% | +10.24% |
Finance Costs | ₹21.70 | ₹14.50 | ₹16.30 | +33.13% | +49.66% |
Depreciation & Amortization | ₹76.70 | ₹67.90 | ₹68.00 | +12.79% | +12.96% |
Total Expenses | ₹1,910.30 | ₹1,785.60 | ₹1,565.40 | +22.03% | +6.98% |
Profit Before Tax (PBT) | ₹171.10 | ₹95.00 | ₹213.60 | -19.90% | +80.11% |
Tax Expense | ₹62.40 | ₹29.50 | ₹56.20 | +11.03% | +111.53% |
Net Profit (PAT) | ₹108.70 | ₹65.50 | ₹157.40 | -30.94% | +65.95% |
PAT Attributable to Shareholders | ₹104.10 | ₹54.80 | ₹153.80 | -32.31% | +90.00% |
Basic & Diluted EPS (₹) | ₹9.37 | ₹4.93 | ₹13.86 | -32.40% | +90.06% |
Quarter-on-Quarter (QoQ) & Year-on-Year (YoY) Analysis
Sequential Movement (QoQ)
Top-line Recovery: Revenue grew by 7.72% QoQ to ₹2,075.7 crore.
Bottom-line Rebound: Net profit surged 65.95% sequentially to ₹108.7 crore from ₹65.5 crore in Q4 FY26. The sequential improvement was primarily driven by lower exceptional items compared to Q4 FY26, which had included a ₹71.2 crore exceptional loss.
Annual Movement (YoY)
Revenue Expansion: Consolidated top-line grew by 21.26% YoY, assisted by organic growth in core engineering and the consolidation of Kinetic Technologies.
Margin Compression: Profitability contracted by 30.94% YoY. The primary reasons include higher material costs (+81.03% YoY), increased employee benefit expenses (+16.56% YoY), higher finance costs (+33.13% YoY), and a sharp decline in Other Income from ₹69.7 crore to ₹6.9 crore.
Business Segment Analysis
Detailed segment disclosures highlight varied dynamics across business units:
Q1 FY27 Segment Revenue Mix (Total: ₹2,075.7 Cr)
┌───────────────────────────────────────────────┬────────────┐
│ Segment                                       │ Revenue    │
├───────────────────────────────────────────────┼────────────┤
│ Digital, Engineering & Technology (DET)       │ ₹1,540.2 Cr│
│ Design Led Manufacturing (DLM)                │ ₹373.8 Cr  │
│ Semiconductors                                │ ₹169.7 Cr  │
│ Others (Aerospace Tooling, etc.)              │ ₹8.1 Cr    │
└───────────────────────────────────────────────┴────────────┘
1. Digital, Engineering & Technology (DET)
Revenue: Reached ₹1,540.2 crore, up 10.61% YoY (from ₹1,392.5 crore in Q1 FY26).
Segment Profit: Recorded ₹188.4 crore in segment results compared to ₹167.2 crore in Q1 FY26.
2. Design Led Manufacturing (DLM)
Revenue: Increased 34.27% YoY to ₹373.8 crore (from ₹278.4 crore in Q1 FY26).
Segment Profit: Improved to ₹28.6 crore compared to ₹15.2 crore in Q1 FY26.
3. Semiconductors
Revenue: Rose significantly to ₹169.7 crore, driven by the consolidation of newly acquired Kinetic Technologies (which contributed ₹98.4 crore / $10.4 million post-acquisition).
Segment Loss: Recorded a segment loss of ₹28.4 crore, as integration costs and pre-tax operating losses (₹17.7 crore loss from Kinetic Technologies) weighed on profitability.
Key Strategic Corporate Developments
┌────────────────────────────────────────────────────────────────────────┐
│                   MAJOR CORPORATE TRANSACTIONS IN Q1 FY27              │
├────────────────────────────────────────────────────────────────────────┤
│ 1. Kinetic Tech Acquisition: 82.9% stake acquired on April 8, 2026     │
│    for US$85 million (Net consideration US$74M / ₹688.7 Cr).            │
│ 2. TAO Digital Agreement: SPA signed May 30, 2026 to acquire 100% of    │
│    AI-native TAO Digital Solutions Inc. for ~US$218 Million.      │
│ 3. Tender Buyback Completed: 64,00,000 shares bought back at ₹1,125/sh │
│    for ₹720 Crore; shares extinguished on July 15, 2026.         │
└────────────────────────────────────────────────────────────────────────┘
1. Kinetic Technologies Acquisition
Cyient Cayman Limited acquired an 82.9% majority stake in Kinetic Technologies on April 8, 2026. The total consideration of $85 million included $11 million retained within the entity for operational liquidity, resulting in a net consideration of $74 million (₹688.7 crore). Goodwill recognized on the transaction stood at ₹465.4 crore ($50 million).
2. Proposed TAO Digital Solutions Acquisition
On May 30, 2026, Cyient executed a Share Purchase Agreement to acquire 100% of US-headquartered AI-native data and product engineering solutions firm TAO Digital Solutions Inc. for ~$218 million. The transaction consists of an upfront payment of $130 million plus earn-outs based on future performance. Closing remains subject to customary regulatory approvals.
3. Completion of ₹720 Crore Buyback
The Board had previously approved a buyback of 64,00,000 equity shares (~5.76% of capital) at ₹1,125 per share. The tendering window closed on June 30, 2026, payments were settled on July 6, 2026, and share extinguishment was finalized on July 15, 2026. Per Ind AS 10, this post-balance-sheet event had no impact on Q1 FY27 reported financials.
Management Commentary
During post-board disclosures, Managing Director & Executive Vice-Chairman Krishna Bodanapu noted the execution focus:
Executive Viewpoint: “Our top-line momentum in Q1 FY27 demonstrates sustained expansion across DET and DLM core engineering divisions. While strategic investments in our Semiconductors pipeline and integration costs associated with Kinetic Technologies temporarily impacted quarterly profit margins, our inorganic acquisitions in AI-native engineering position us strongly for mid-to-long term lifecycle technology demand.”
Stock Price Performance & Technical Snapshot
Following the results release on July 23, 2026, Cyient stock closed lower on the NSE:
Closing Price: Closed at ₹832.40, down ₹10.90 (-1.29%) on NSE.
Day Range: High of ₹848.45 and Low of ₹827.35.
52-Week Range: 52-Week High of ₹1,301.70 and 52-Week Low of ₹750.30.
Market Capitalization: Approximately ₹9,161 crore.
Cyient 1-Day Intraday Movement (July 23, 2026)
850 |----\
840 |     \----\
830 |           \--------\ (Closed: ₹832.40)
820 +---------------------------------
    09:15 AM    01:00 PM    03:30 PM
Valuation & Peer Comparison
| Company Name | Market Cap (₹ Cr) | TTM P/E (x) | Revenue Growth YoY (%) | OPM / Margin Trend |
| Cyient Ltd. | ₹9,161 | ~21.5x | +21.3% | Squeezed by M&A integration |
| L&T Technology Services | ~48,500 | ~35.2x | +6.8% | Stable ER&D margins |
| Tata Elxsi | ~42,000 | ~48.0x | +4.5% | Premium valuation, steady margins |
| KPIT Technologies | ~38,000 | ~52.1x | +18.2% | Automotive ER&D focused |
Risk Factors vs Opportunities
┌──────────────────────────────────┬──────────────────────────────────┐
│ STRENGTHS & OPPORTUNITIES        │ RISKS & CHALLENGES               │
├──────────────────────────────────┼──────────────────────────────────┤
│ • Strong moat in Aerospace & Rail│ • Drag from operating losses in  │
│   engineering vertical           │   Semiconductors division│
│ • TAO Digital acquisition brings │ • Integration risks for large    │
│   AI-native product capabilities│   overseas acquisitions│
│ • Cyient DLM manufacturing scale │ • Broad slowdown in global tech  │
│   drives top-line volume│   and ER&D spending              │
└──────────────────────────────────┴──────────────────────────────────┘
What Investors Should Watch Next
TAO Digital Closing: Successful regulatory clearance and formal integration of TAO Digital Solutions Inc.
Semiconductor Turnaround: Turnaround timelines for Kinetic Technologies and the Semiconductors segment to achieve operating breakeven.
Margin Recovery: Stabilization of consolidated EBITDA margins back toward historical levels.



