

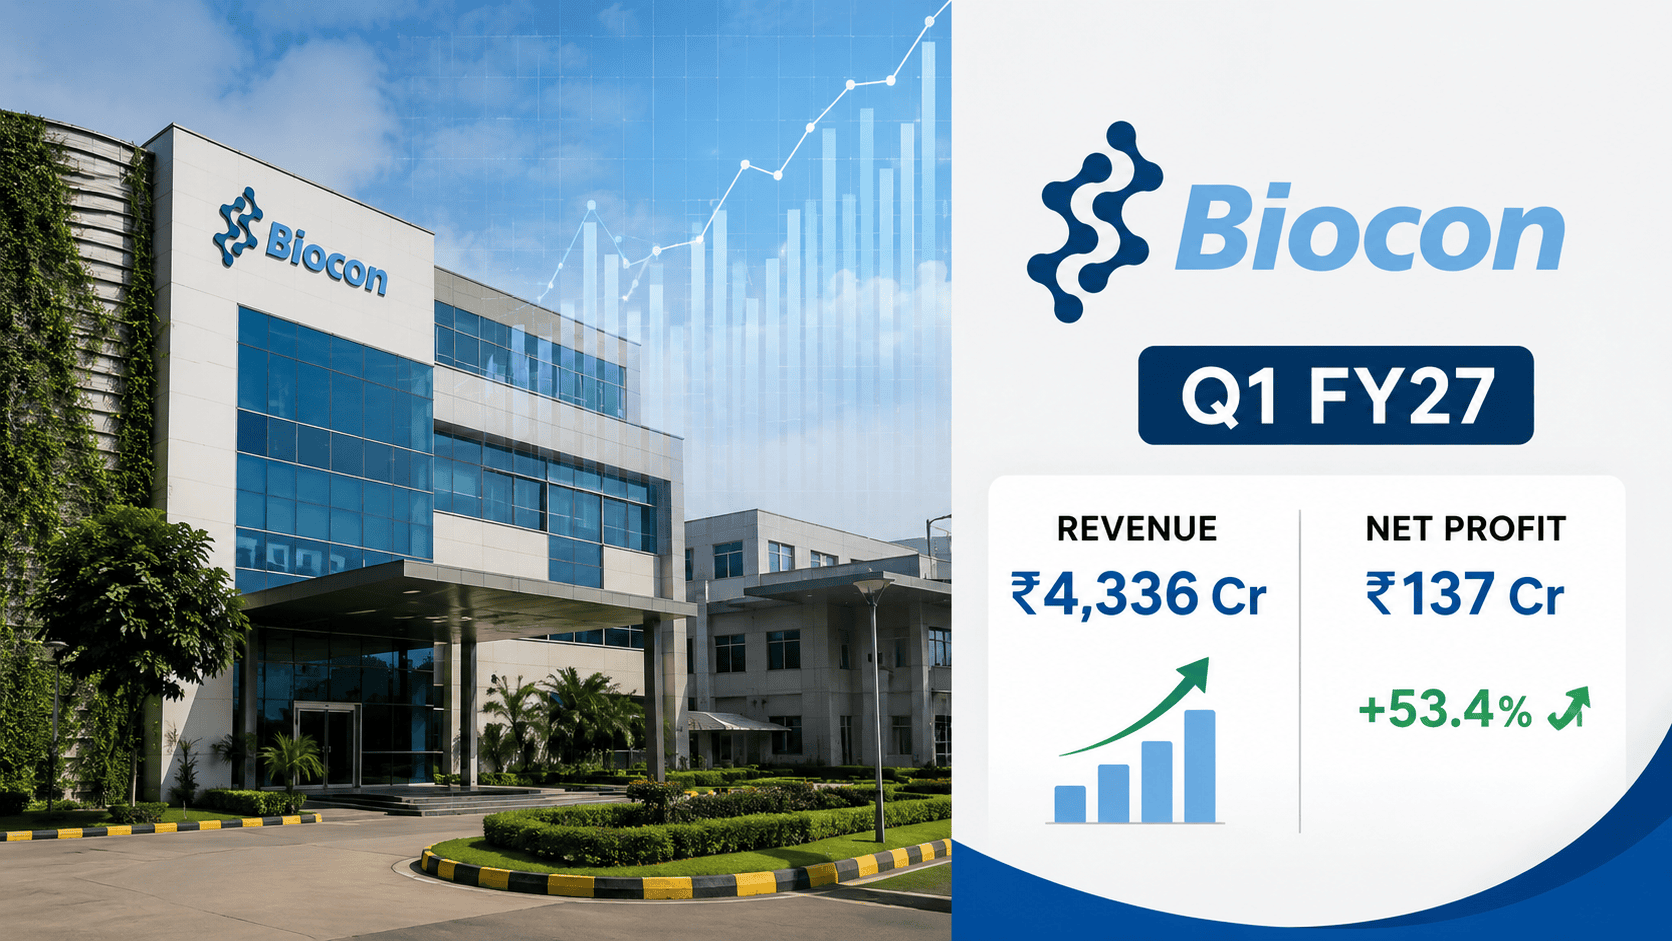
Biocon Limited’s Q1 FY27 financial performance reflects solid top-line momentum across its flagship Biosimilars division, stabilizing returns in Generics, and steady operational delivery at its research services arm, Syngene International.
The table below provides a high-level summary of Biocon’s consolidated quarterly performance for the period ended June 30, 2026.
Consolidated Financial Summary (Q1 FY27 vs Q1 FY26 vs Q4 FY26)
| Financial Metric (in ₹ Million / ₹ Crore) | Q1 FY27 (Ended Jun 30, 2026) PDF | Q1 FY26 (Ended Jun 30, 2025) PDF | YoY Growth (%) PDF | Q4 FY26 (Ended Mar 31, 2026) PDF | QoQ Growth (%) PDF |
Sale of Products | ₹35,721 M (₹3,572.1 Cr) | ₹30,670 M (₹3,067.0 Cr) | +16.47% | ₹34,821 M (₹3,482.1 Cr) | +2.58% |
Sale of Services | ₹7,197 M (₹719.7 Cr) | ₹8,431 M (₹843.1 Cr) | -14.64% | ₹10,022 M (₹1,002.2 Cr) | -28.19% |
Other Operating Revenue | ₹442 M (₹44.2 Cr) | ₹318 M (₹31.8 Cr) | +38.99% | ₹323 M (₹32.3 Cr) | +36.84% |
Revenue from Operations | ₹43,360 M (₹4,336.0 Cr) | ₹39,419 M (₹3,941.9 Cr) | +10.00% | ₹45,166 M (₹4,516.6 Cr) | -4.00% |
Other Income | ₹545 M (₹54.5 Cr) | ₹797 M (₹79.7 Cr) | -31.62% | ₹525 M (₹52.5 Cr) | +3.81% |
Total Income | ₹43,905 M (₹4,390.5 Cr) | ₹40,216 M (₹4,021.6 Cr) | +9.17% | ₹45,691 M (₹4,569.1 Cr) | -3.91% |
Cost of Materials & Stock Purchases | ₹14,676 M (₹1,467.6 Cr) | ₹14,051 M (₹1,405.1 Cr) | +4.45% | ₹14,003 M (₹1,400.3 Cr) | +4.81% |
Employee Benefits Expense | ₹9,161 M (₹916.1 Cr) | ₹8,331 M (₹833.1 Cr) | +9.96% | ₹9,121 M (₹912.1 Cr) | +0.44% |
Finance Costs | ₹2,132 M (₹213.2 Cr) | ₹2,767 M (₹276.7 Cr) | -22.95% | ₹2,315 M (₹231.5 Cr) | -7.90% |
Depreciation & Amortization | ₹5,474 M (₹547.4 Cr) | ₹4,550 M (₹455.0 Cr) | +20.31% | ₹5,134 M (₹513.4 Cr) | +6.62% |
Other Expenses | ₹11,067 M (₹1,106.7 Cr) | ₹9,722 M (₹972.2 Cr) | +13.83% | ₹11,977 M (₹1,197.7 Cr) | -7.60% |
Total Expenses | ₹42,494 M (₹4,249.4 Cr) | ₹39,075 M (₹3,907.5 Cr) | +8.75% | ₹42,412 M (₹4,241.2 Cr) | +0.19% |
PBT Before Exceptional Items | ₹1,411 M (₹141.1 Cr) | ₹1,141 M (₹114.1 Cr) | +23.66% | ₹3,279 M (₹327.9 Cr) | -56.97% |
Exceptional Items (Net) | (₹135 M) (₹13.5 Cr) | (₹172 M) (₹17.2 Cr) | -21.51% | (₹804 M) (₹80.4 Cr) | -83.21% |
Profit Before Tax (PBT) | ₹1,276 M (₹127.6 Cr) | ₹969 M (₹96.9 Cr) | +31.68% | ₹2,475 M (₹247.5 Cr) | -48.44% |
Tax Expense (Current + Deferred) | (₹92 M) (₹9.2 Cr) | ₹77 M (₹7.7 Cr) | N/A | ₹489 M (₹48.9 Cr) | N/A |
Net Profit After Tax (PAT) | ₹1,368 M (₹136.8 Cr) | ₹892 M (₹89.2 Cr) | +53.36% | ₹1,986 M (₹198.6 Cr) | -31.12% |
PAT Attributable to Shareholders | ₹1,411 M (₹141.1 Cr) | ₹314 M (₹31.4 Cr) | +349.36% | ₹1,259 M (₹125.9 Cr) | +12.07% |
Basic & Diluted EPS (₹) | ₹0.87 | ₹0.26 | +234.62% | ₹0.79 | +10.13% |
+-----------------------------------------------------------------------------------+
|                        BIOCON LIMITED Q1 FY27 AT A GLANCE                         |
+-----------------------------------------------------------------------------------+
|  Consolidated Revenue  : ₹4,336 Crore  (+10.0% YoY | -4.0% QoQ)                    |
|  Net Profit (PAT)      : ₹137 Crore    (+53.4% YoY | Attributable PAT: ₹141 Cr)   |
|  Biosimilars Revenue   : ₹2,856 Crore  (+16.2% YoY | 65.8% of Total Revenue)      |
|  Generics Revenue      : ₹760 Crore    (+20.5% YoY | -2.1% QoQ)                   |
|  Syngene Services      : ₹736 Crore    (-15.8% YoY | Contract Research/CRDMO)     |
|  Corporate Catalyst    : Biocon Biologics becomes 100% Wholly Owned Subsidiary    |
+-----------------------------------------------------------------------------------+
Company Overview: Business Model & Global Positioning
Founded in 1978 by Kiran Mazumdar-Shaw, Biocon Limited has evolved from an industrial enzymes manufacturer into a fully integrated, innovation-driven global biopharmaceutical enterprise. Headquartered in Bengaluru, India, Biocon operates across the full biopharmaceutical value chain—from early-stage drug discovery and clinical development to commercial manufacturing and global distribution.
Core Business Pillars
Biosimilars (Biocon Biologics Limited – BBL): Focuses on commercializing high-quality biosimilar insulins, monoclonal antibodies, and recombinant proteins globally. Following recent strategic acquisitions and partner buyouts (including Viatris’ global biosimilars business), Biocon Biologics operates as a integrated pure-play biosimilars company. Effective June 29, 2026, BBL became a 100% wholly owned subsidiary of Biocon Limited.
Generics (Biocon Pharma Limited): Encompasses Active Pharmaceutical Ingredients (APIs) and finished dosage formulations (FDFs) in key therapeutic segments like statins, immunosuppressants, anti-diabetics, and specialty oral solids/injectables.
Research Services (Syngene International Limited): A publicly listed custom research, development, and manufacturing organization (CRDMO) providing end-to-end scientific solutions to global pharmaceutical, biotech, nutrition, and specialty chemical companies. Biocon holds a controlling equity stake in Syngene.
Novel Biologics: Focused on clinical pipeline assets targeting immuno-oncology and autoimmune conditions.
+-----------------------------------------------------------------------------------+
|                         BIOCON GROUP STRUCTURE & SEGMENTS                         |
+-----------------------------------------------------------------------------------+
|  BIOCON LIMITED (Parent Entity)                                                    |
|    |                                                                              |
|    +---> Biocon Biologics Limited (Biosimilars - 100% Wholly Owned Subsidiary)    |
|    |                                                                              |
|    +---> Biocon Pharma Limited (Generics & Formulations - Wholly Owned)           |
|    |                                                                              |
|    +---> Syngene International Limited (CRDMO Services - Controlling Stake)       |
+-----------------------------------------------------------------------------------+
Financial Review: Revenue, Profit, Margins, and Expenses
Top-Line Dynamics
Biocon’s consolidated revenue from operations for Q1 FY27 reached ₹4,336 crore (₹43,360 million), compared to ₹3,942 crore (₹39,419 million) in Q1 FY26. Top-line growth was driven by product sales, which rose 16.5% YoY to ₹3,572 crore. This expansion helped offset a 14.6% YoY decline in contract research and service revenues at Syngene (₹720 crore vs ₹843 crore).
Expenditure Structure
Material Costs: Combined raw material consumption and stock-in-trade purchases totaled ₹1,468 crore in Q1 FY27, up 4.5% YoY. Raw material costs were controlled through improved product mix and localized sourcing.
Employee Expenses: Staff costs rose 10.0% YoY to ₹916 crore, driven by annual merit increments and talent acquisition in commercial markets across the US and Europe.
Finance Costs: A key positive in the earnings report was a 23.0% YoY drop in finance costs to ₹213 crore (₹2,132 million), down from ₹277 crore in Q1 FY26. This reduction was driven by debt prepayments and interest cost optimization following fundraising via Qualified Institutional Placements (QIPs) and commercial paper redemptions.
Depreciation & Amortization: Increased by 20.3% YoY to ₹547 crore, reflecting capital investments in biomanufacturing facilities and intangible asset amortization associated with biosimilar portfolio acquisitions.
Profitability Metrics & Margins
Consolidated Profit Before Tax and exceptional items increased 23.7% YoY to ₹141 crore. Deferred tax credits of ₹125 crore helped boost Net Profit After Tax (PAT) to ₹137 crore.
Due to the complete integration of Biocon Biologics (extinguishing non-controlling minority interests in BBL), net profit attributable to equity shareholders of Biocon Limited surged 349.4% YoY to ₹141 crore (₹1,411 million), driving Basic Earnings Per Share (EPS) up from ₹0.26 to ₹0.87 per share.
+-----------------------------------------------------------------------------------+
|                        CONSOLIDATED MARGIN TRAJECTORY                             |
+-----------------------------------------------------------------------------------+
|  EBITDA Margin (Estimated) : ~21.5% - 22.0% (Stable operational core)             |
|  Net Profit Margin         : 3.16% (Q1 FY27) vs 2.26% (Q1 FY26) - Expanded +90 bps |
|  Finance Cost Ratio        : 4.92% of Revenue (Q1 FY27) vs 7.02% (Q1 FY26)       |
+-----------------------------------------------------------------------------------+
Business Segment Analysis
Biocon’s operating performance is reported across three core business segments under Ind AS 108: Biosimilars, Generics, and Services (Syngene).
Segment Revenue & Profitability Breakdown
| Business Segment (in ₹ Million / ₹ Crore) | Q1 FY27 (Jun 30, 2026) PDF | Q1 FY26 (Jun 30, 2025) PDF | YoY Growth (%) PDF | Q4 FY26 (Mar 31, 2026) PDF | Segment Share (%) PDF |
Biosimilars (Biocon Biologics) | ₹28,556 M (₹2,855.6 Cr) | ₹24,578 M (₹2,457.8 Cr) | +16.19% | ₹27,556 M (₹2,755.6 Cr) | 65.81% |
Generics (Biocon Pharma) | ₹7,597 M (₹759.7 Cr) | ₹6,303 M (₹630.3 Cr) | +20.53% | ₹7,760 M (₹776.0 Cr) | 17.51% |
Services (Syngene) | ₹7,360 M (₹736.0 Cr) | ₹8,745 M (₹874.5 Cr) | -15.84% | ₹10,365 M (₹1,036.5 Cr) | 16.96% |
Total Segment Revenue | ₹43,513 M (₹4,351.3 Cr) | ₹39,626 M (₹3,962.6 Cr) | +9.81% | ₹45,681 M (₹4,568.1 Cr) | 100.28% |
Inter-Segment Adjustments | (₹153 M) | (₹207 M) | -26.09% | (₹515 M) | -0.28% |
Net Operational Revenue | ₹43,360 M (₹4,336.0 Cr) | ₹39,419 M (₹3,941.9 Cr) | +10.00% | ₹45,166 M (₹4,516.6 Cr) | 100.00% |
Segment Profit Before Tax (PBT) Performance
| Segment PBT / Results (in ₹ Million) | Q1 FY27 (Jun 30, 2026) PDF | Q1 FY26 (Jun 30, 2025) PDF | YoY Growth (%) PDF | Q4 FY26 (Mar 31, 2026) PDF |
Biosimilars Result | ₹1,714 M (₹171.4 Cr) | ₹1,667 M (₹166.7 Cr) | +2.82% | ₹1,689 M (₹168.9 Cr) |
Generics Result | (₹309 M) (-₹30.9 Cr) | (₹1,016 M) (-₹101.6 Cr) | +69.59% (Loss Reduced) | (₹488 M) (-₹48.8 Cr) |
Services (Syngene) Result | (₹57 M) (-₹5.7 Cr) | ₹1,013 M (₹101.3 Cr) | N/A (Loss Incurred) | ₹2,020 M (₹202.0 Cr) |
Total Segment Profit | ₹1,348 M (₹134.8 Cr) | ₹1,664 M (₹166.4 Cr) | -19.00% | ₹3,221 M (₹322.1 Cr) |
Unallocable Income/Expenditure | (₹63 M) | ₹523 M | N/A | (₹58 M) |
Consolidated PBT (Pre-Exceptional) | ₹1,411 M (₹141.1 Cr) | ₹1,141 M (₹114.1 Cr) | +23.66% | ₹3,279 M (₹327.9 Cr) |
+-----------------------------------------------------------------------------------+
|                        Q1 FY27 REVENUE SHARE BY BUSINESS                          |
+-----------------------------------------------------------------------------------+
|  Biosimilars (BBL)    : 65.8% Share (₹2,856 Cr | Core Growth Engine)             |
|  Generics (BPL)       : 17.5% Share (₹760 Cr   | Strong Recovery +20.5% YoY)      |
|  Services (Syngene)   : 17.0% Share (₹736 Cr   | Temporary Drag -15.8% YoY)       |
+-----------------------------------------------------------------------------------+
Deep-Dive into Business Divisions
1. Biosimilars (Biocon Biologics Limited)
Revenue Performance: Biosimilars revenue grew 16.2% YoY to ₹2,856 crore, accounting for nearly two-thirds of Biocon’s consolidated topline.
Commercial Drivers: Market share gains across core commercial molecules in advanced markets:
Ogivri® (Biosimilar Trastuzumab): Maintained stable double-digit volume shares in the US and Europe.
Fulphila® (Biosimilar Pegfilgrastim): Volume demand supported by long-term supply contracts.
Semglee® / Biosimilar Glargine: Expanding retail and institutional formulary coverage in the US market.
Kirsty® & Abevmy® (Biosimilar Bevacizumab): Continued uptake in Europe and emerging markets.
Profitability: Segment result rose to ₹171.4 crore. Segment capital employed expanded to ₹27,164 crore, reflecting ongoing R&D investments in late-stage biosimilar candidates (including biosimilar Ustekinumab, Denosumab, and Aflibercept).
2. Generics (Biocon Pharma Limited)
Revenue Performance: Generics revenue posted a strong 20.5% YoY increase to ₹760 crore, up from ₹630 crore in Q1 FY26.
Operational Turnaround: Segment operating loss reduced from ₹101.6 crore in Q1 FY26 to ₹30.9 crore in Q1 FY27.
Growth Drivers: Expansion in finished dosage formulations (FDFs) in North America, increased off-take of immunosuppressant APIs (Tacrolimus, Mycophenolate), and new product launches in European markets.
3. Services (Syngene International Limited)
Revenue Performance: Services revenue contracted 15.8% YoY to ₹736 crore, reflecting broader global trends where early-stage biotech funding constraints slowed research service orders.
Segment Results: Segment result posted a small loss of ₹5.7 crore compared to a profit of ₹101.3 crore in Q1 FY26, impacted by lower capacity utilization in discovery services and severance/liquidation expenses related to restructuring subsidiary entities.
Major Corporate Restructuring: 100% Integration of Biocon Biologics
The defining strategic milestone for Biocon during the quarter ended June 30, 2026, was completing the full integration of Biocon Biologics Limited (BBL).
+-----------------------------------------------------------------------------------+
|                  BIOCON BIOLOGICS INTEGRATION MILESTONES                          |
+-----------------------------------------------------------------------------------+
|  1. QIP Allotments      : Raised ₹4,500 Cr (Q1 FY26) & ₹4,150 Cr (Q4 FY26)       |
|  2. Investor Buyouts    : Acquired BBL stakes from Serum, Mylan & Tata Capital    |
|  3. Final Share Swap    : Allotted 87.86 Lakh shares to acquire final BBL stake   |
|  4. Wholly Owned Status : BBL officially became 100% subsidiary on June 29, 2026  |
+-----------------------------------------------------------------------------------+
Steps Executed in Integration:
Preferential Allotment Share Swap (June 2026): As disclosed in Note 12, Biocon acquired 1,15,36,956 equity shares of BBL from minority shareholders via a share swap. On June 29, 2026, Biocon allotted 87,86,362 equity shares (face value ₹5) at an issue price of ₹376.41 per share on a preferential basis.
100% Wholly Owned Status: Following this allotment, Biocon Biologics Limited became a 100% wholly owned subsidiary of Biocon Limited effective June 29, 2026.
Financial Impact: Extinguishes non-controlling interest leakages, allowing 100% of BBL’s future net profits to flow directly to Biocon Limited shareholders.
Debenture Conversions & Stake Consolidations: Completed the conversion of Optionally Convertible Debentures (OCDs) and Compulsorily Convertible Debentures (CCDs) held in BBL on May 7, 2026.
Balance Sheet Review, Capital Employed, and Debt Structure
Biocon’s balance sheet reflects capital deployment following acquisitions, alongside debt reduction funded by equity raises.
Balance Sheet Highlights & Capital Allocation
| Balance Sheet Metric (in ₹ Million / ₹ Crore) | As at June 30, 2026 PDF | As at March 31, 2026 PDF | As at June 30, 2025 PDF | YoY Change (%) PDF |
Paid-up Equity Capital | ₹8,148 M (₹814.8 Cr) | ₹8,105 M (₹810.5 Cr) | ₹6,685 M (₹668.5 Cr) | +21.88% |
Other Equity / Reserves | ₹3,32,213 M* (₹33,221.3 Cr) | ₹3,32,213 M (₹33,221.3 Cr) | ₹2,85,000 M (Est) | +16.57% |
Total Segment Assets | ₹6,46,955 M (₹64,695.5 Cr) | ₹6,36,506 M (₹63,650.6 Cr) | ₹6,13,941 M (₹61,394.1 Cr) | +5.38% |
– Biosimilars Assets | ₹4,86,533 M (₹48,653.3 Cr) | ₹4,78,881 M (₹47,888.1 Cr) | ₹4,47,112 M (₹44,711.2 Cr) | +8.82% |
– Generics Assets | ₹93,865 M (₹9,386.5 Cr) | ₹88,148 M (₹8,814.8 Cr) | ₹76,593 M (₹7,659.3 Cr) | +22.55% |
– Services Assets | ₹67,452 M (₹6,745.2 Cr) | ₹70,549 M (₹7,054.9 Cr) | ₹66,747 M (₹6,674.7 Cr) | +1.06% |
Total Segment Liabilities | ₹2,71,494 M (₹27,149.4 Cr) | ₹2,70,291 M (₹27,029.1 Cr) | ₹2,93,966 M (₹29,396.6 Cr) | -7.64% |
– Biosimilars Liabilities | ₹2,14,894 M (₹21,489.4 Cr) | ₹2,11,789 M (₹21,178.9 Cr) | ₹2,24,602 M (₹22,460.2 Cr) | -4.32% |
– Generics Liabilities | ₹38,658 M (₹3,865.8 Cr) | ₹36,883 M (₹3,688.3 Cr) | ₹28,673 M (₹2,867.3 Cr) | +34.82% |
– Services Liabilities | ₹18,791 M (₹1,879.1 Cr) | ₹22,147 M (₹2,214.7 Cr) | ₹18,282 M (₹1,828.2 Cr) | +2.78% |
Total Capital Employed | ₹3,75,461 M (₹37,546.1 Cr) | ₹3,66,215 M (₹36,621.5 Cr) | ₹3,19,975 M (₹31,997.5 Cr) | +17.34% |
*Note: Other Equity reflects base FY26 audited figure.
+-----------------------------------------------------------------------------------+
|                        DEBT & DE-LEVERAGING TRAJECTORY                            |
+-----------------------------------------------------------------------------------+
|  Finance Costs (Q1 FY26) : ₹276.7 Crore  ====================>                    |
|  Finance Costs (Q1 FY27) : ₹213.2 Crore  =================> (-22.95% YoY Reduction)|
|  De-leveraging Drivers   : QIP proceeds, Commercial Paper & NCD redemptions       |
+-----------------------------------------------------------------------------------+
Capital Allocation & Debt Optimization Highlights:
De-leveraging Progress: Total segment liabilities declined 7.6% YoY from ₹29,397 crore to ₹27,149 crore as of June 30, 2026.
Interest Savings: Reduced annual debt service burden reflected in lower quarterly finance costs (down 23.0% YoY to ₹213 crore).
Capital Employed Allocation: 72.3% of total capital employed is allocated to Biosimilars (₹27,164 crore), 14.7% to Generics (₹5,521 crore), and 13.0% to Services (₹4,866 crore).
Management Commentary & Strategic Governance
Key management remarks accompanying the Q1 FY27 earnings release highlight long-term integration objectives and operational milestones:
+-----------------------------------------------------------------------------------+
|                      EXECUTIVE LEADERSHIP STATEMENTS                             |
+-----------------------------------------------------------------------------------+
|  Kiran Mazumdar-Shaw (Executive Chairperson):                                    |
|  "The complete integration of Biocon Biologics as a 100% wholly owned             |
|   subsidiary marks a pivotal milestone. Our 10% operational revenue growth and    |
|   53% net profit expansion demonstrate the underlying strength of our core        |
|   biosimilar portfolio and operational discipline across business units."         |
+-----------------------------------------------------------------------------------+
Key Management Directives Highlighted:
Full Value Realization in Biosimilars: Operating BBL as a wholly owned subsidiary simplifies corporate governance, removes dual-layer listing complexity, and allows full operational synergies across R&D, clinical trials, regulatory affairs, and global commercial infrastructure.
Generics Turnaround: Focus on higher-value specialty formulations and injectables to bring the Generics segment back into structural profitability.
Syngene Stabilization: Syngene’s management is optimizing its cost structure and expanding its CRDMO capabilities in biologics and antibody-drug conjugates (ADCs) to capture medium-term market recovery.
Agrochemical & Pharmaceutical Industry Outlook
The global biopharmaceutical sector is undergoing structural changes, presenting both opportunities and regulatory challenges for Indian manufacturers:
+-----------------------------------------------------------------------------------+
|                     GLOBAL BIOPHARMA MACRO DRIVERS                                |
+-----------------------------------------------------------------------------------+
|  1. US Patent Cliff       : >$200 Billion worth of biologics facing patent expiry  |
|  2. US Inflation Red. Act : Encourages biosimilar adoption to lower healthcare costs|
|  3. Supply Chain Shift    : China+1 diversification favoring Indian CRDMOs        |
|  4. Regulatory Harmonization: Faster USFDA & EMA approvals for biosimilars        |
+-----------------------------------------------------------------------------------+
Biosimilar Patent Cliff: Over $200 billion worth of biologic drugs are expected to lose patent protection by 2030, opening market entry windows for interchangeable biosimilars in oncology, immunology, and ophthalmology.
US Healthcare Policy Tailwinds: Legislative initiatives like the US Inflation Reduction Act (IRA) favor biosimilar adoption to reduce Medicare spending, benefiting integrated manufacturers with dedicated US commercial infrastructure.
Regulatory Inspection Intensity: The USFDA has resumed routine pre-approval and surveillance site inspections across Indian manufacturing facilities. Maintaining cGMP compliance across sterile injectables and biologics plants remains critical.
Competitor Benchmark: Listed Indian Pharma Peers
To evaluate Biocon’s financial standing, we compare its performance and valuation metrics against major listed pharmaceutical and biotechnology peers in India:
| Company Name | Market Cap (₹ Cr) | Trailing P/E (x) | Price-to-Book (P/B) | ROE (%) | Net Debt/Equity | Operational Focus |
| Biocon Limited | ~₹42,500 – ₹44,000 | ~32.5x | ~1.30x | ~5.5% – 7.0% | ~0.45x | Biosimilars, Generics, CRDMO Services |
| Sun Pharma | ~₹4,15,000 | ~36.0x | ~5.20x | ~16.5% | Net Cash | Global Specialty & Domestic Formulations |
| Dr. Reddy’s Lab | ~1,12,000 | ~20.5x | ~3.80x | ~18.2% | Net Cash | US Generics, Biosimilars, Global Formulations |
| Cipla | ~1,22,000 | ~28.0x | ~4.10x | ~15.8% | Net Cash | Respiratory, Domestic Retail, US Generics |
| Lupin | ~92,000 | ~34.5x | ~4.50x | ~12.0% | ~0.15x | Complex Generics, Inhalation, US Formulations |
| Divi’s Laboratories | ~1,35,000 | ~68.0x | ~8.20x | ~12.5% | Net Cash | API Manufacturing & Custom Synthesis |
| Zydus Lifesciences | ~1,18,000 | ~26.0x | ~4.60x | ~18.5% | Net Cash | Formulations, Biosimilars, NCE Research |
Comparative metrics compiled based on stock exchange filings and market consensus data.
Key Takeaways from Peer Comparison:
Valuation Multiples: Biocon trades at a Price-to-Book (P/B) ratio of ~1.30x, representing a discount compared to peer group averages (~4.0x–5.0x), reflecting historical debt levels incurred during the Viatris acquisition.
Pure-Play Biosimilar Exposure: Unlike pure generic peers, Biocon offers dedicated equity exposure to global biosimilars, which command higher technology entry barriers.
Five-Year Historical Financial Performance Trends
An examination of Biocon’s five-year financial trajectory highlights its scale expansion following major strategic investments:
| Metric (Consolidated in ₹ Crore) | FY22 | FY23 | FY24 | FY25 | FY26 | Q1 FY27 (Annualized)* PDF |
Revenue from Operations | ₹8,184 Cr | ₹11,174 Cr | ₹15,621 Cr | ₹15,639 Cr | ₹16,927 Cr | ₹17,344 Cr (Est) |
| EBITDA | ₹2,183 Cr | ₹2,888 Cr | ₹3,728 Cr | ₹3,880 Cr | ₹4,210 Cr | ~₹4,300 Cr (Est) |
Net Profit (PAT) | ₹648 Cr | ₹463 Cr | ₹968 Cr | ₹1,029 Cr | ₹369 Cr | ₹547 Cr (Est) |
Basic EPS (₹) | ₹5.40 | ₹3.86 | ₹8.06 | ₹8.57 | ₹2.82 | ₹3.48 (Est) |
*Annualized projections based on Q1 FY27 results.
+-----------------------------------------------------------------------------------+
|                     5-YEAR REVENUE EXPANSION (FY22 - FY26)                        |
+-----------------------------------------------------------------------------------+
|  FY22 Revenue :  ₹8,184 Crore   =================>                                |
|  FY24 Revenue : ₹15,621 Crore   =====================================>            |
|  FY26 Revenue : ₹16,927 Crore   =========================================>     |
+-----------------------------------------------------------------------------------+
Technical & Fundamental Stock Analysis
Following the Q1 FY27 earnings release on August 5, 2026, Biocon’s stock traded in a structured range on the National Stock Exchange (NSE) and BSE Limited:
Current Market Price (CMP): ~₹352.00 – ₹365.00 per share
52-Week High / Low: ₹387.80 / ₹232.10
Market Capitalization: ~₹43,100 Crore
Key Moving Averages:
50-Day SMA: ~₹342.50
200-Day SMA: ~₹318.00
Technical Trend: The stock trades above its 50-day and 200-day moving averages, consolidating in an ascending channel. Primary technical support sits at ₹330.00, with overhead resistance at ₹388.00.
+-----------------------------------------------------------------------------------+
|                         STOCK TRADING & VALUATION MATRIX                          |
+-----------------------------------------------------------------------------------+
|  Stock Ticker          : NSE: BIOCON | BSE: 532523                      |
|  Current Share Price   : ₹352.00 - ₹365.00                                  |
|  52-Week Range         : ₹232.10 (Low) - ₹387.80 (High)                    |
|  Trailing P/E Ratio    : ~32.5x                                           |
|  Price-to-Book (P/B)   : ~1.30x                                           |
+-----------------------------------------------------------------------------------+
1SWOT Analysis: Biocon Ltd.
+-----------------------------------------------------------------------------------+
|                                  SWOT MATRIX                                      |
+-----------------------------------------------------------------------------------+
| STRENGTHS                                 | OPPORTUNITIES                         |
| • Fully integrated global biosimilars pure| • 100% ownership of Biocon Biologics  |
|   play (100% wholly owned BBL)        |   removes minority leakage     |
| • Strong presence in insulins & oncology  | • $200B global patent cliff over 2030 |
| • Diversified CRDMO revenues via Syngene| • In-licensing & emerging market expansion|
+-------------------------------------------+---------------------------------------+
| WEAKNESSES                                | THREATS                               |
| • Debt burden from past acquisitions      | • USFDA regulatory inspections & 483s |
| • High depreciation & amortization load| • Price erosion in generic biologics   |
| • Temporary earnings drag at Syngene   | • Biotech funding slowdown in CRDMO   |
+-----------------------------------------------------------------------------------+
Risk Factors & Investment Considerations
Investors evaluating Biocon Limited should consider key risk factors:
USFDA Regulatory Compliance: Biocon operates large sterile manufacturing sites in India and Malaysia. Any adverse regulatory observations (Form 483s, Warning Letters, or import alerts) could delay new product launches.
Pricing Pressure in Advanced Markets: Aggressive competition from competing biosimilar developers in the US and Europe can lead to unexpected price erosion across insulins and oncology mAb molecules.
Debt Servicing & Refinancing: While debt levels have decreased following equity raises, managing foreign currency debt obligations remains important for balance sheet health.
Syngene Volatility: External funding constraints in global biotech start-ups can cause temporary revenue volatility in Syngene’s contract research division.
Long-Term Investment Thesis: Bull, Bear, and Base Scenarios
The Bull Case
Full Earnings Capture: 100% ownership of Biocon Biologics ensures all future profit expansion directly accrues to Biocon Limited shareholders.
New Molecule Launches: Upcoming launches in high-value biosimilars (biosimilar Ustekinumab, Denosumab, and Aflibercept) will expand addressable market size.
De-leveraging: Debt repayments via equity capital raises lower interest expenses and improve net profit margins.
The Bear Case
Execution Delays: Delays in securing USFDA approval for new biosimilar filings could push back target revenue milestones.
Persistent Margin Compression: Severe price discounting by global competitors could compress gross margins across commercial molecules.
Base Case Perspective
Biocon represents an established mid-to-large-cap biopharmaceutical story undergoing structural corporate simplification. Investors tracking the stock should monitor quarterly biosimilar volume uptake, USFDA inspection outcomes, and ongoing debt reduction metrics.
Top 10 Key Investor Takeaways
+-----------------------------------------------------------------------------------+
|                           TOP 10 INVESTOR TAKEAWAYS                               |
+-----------------------------------------------------------------------------------+
|  1. Q1 FY27 Operational Revenue rose 10.0% YoY to ₹4,336 Crore                 |
|  2. Consolidated Net Profit (PAT) jumped 53.4% YoY to ₹137 Crore              |
|  3. Attributable PAT to Shareholders surged 349% YoY to ₹141 Crore             |
|  4. Biocon Biologics (BBL) became a 100% wholly owned subsidiary on June 29, 2026|
|  5. Biosimilars revenue grew 16.2% YoY to ₹2,856 Crore (65.8% of total)       |
|  6. Generics revenue expanded 20.5% YoY to ₹760 Crore; losses narrowed         |
|  7. Services (Syngene) revenue fell 15.8% YoY to ₹736 Crore                   |
|  8. Finance costs dropped 23.0% YoY to ₹213 Crore due to debt redemptions       |
|  9. Basic EPS increased to ₹0.87 per share (vs ₹0.26 in Q1 FY26)               |
| 10. Key monitorable: USFDA site inspection status & new biosimilar filings        |
+-----------------------------------------------------------------------------------+
Conclusion
Biocon Limited’s Q1 FY27 results highlight steady operational execution, with consolidated revenue reaching ₹4,336 crore (+10.0% YoY) and net profit rising 53.4% YoY to ₹137 crore. The key highlight of the quarter was the complete integration of Biocon Biologics into a 100% wholly owned subsidiary, alongside a 23% reduction in finance costs achieved through debt redemptions.
As global biosimilar adoption expands across oncology and immunology, investors will be watching new product filing approvals, USFDA facility inspection status, and ongoing balance sheet de-leveraging.



