

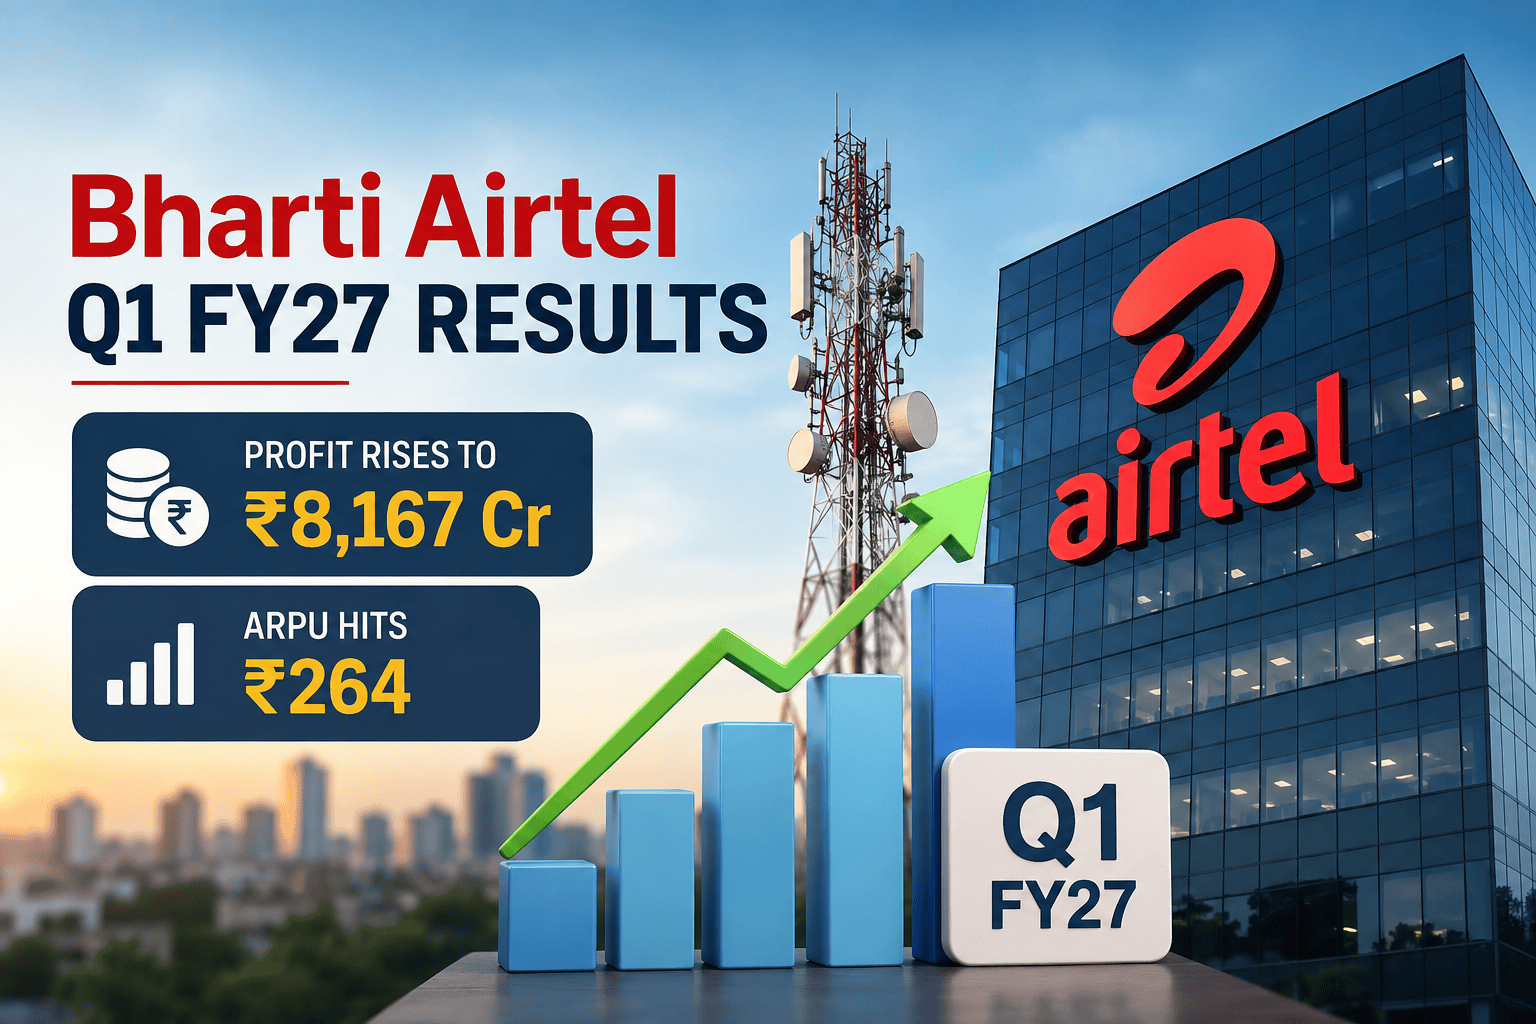
Bharti Airtel Limited reported a robust financial performance for the first quarter ended June 30, 2026 (Q1 FY27), driven by persistent mobile premiumization in India, robust growth in Homes broadband additions, and operational resilience across its African markets. Consolidated revenue surged 18.4% year-on-year to ₹585,391 million, compared to ₹494,626 million in the corresponding quarter of the previous year. Net income after exceptional items rose 37.3% year-on-year to ₹81,674 million, supported by strong underlying operational leverage, margin preservation, and disciplined capital management.
The primary catalyst for the quarter was India Mobile Services, where Average Revenue Per User (ARPU) advanced to ₹264 from ₹250 in Q1 FY26. The company’s customer obsession strategy, network quality enhancements via 5G expansion, and accelerated customer migration from feature phones to smartphones contributed to healthy organic growth. Consolidated EBITDA reached ₹335,986 million, expanding 19.3% YoY, while EBITDA margin broadened by 0.4 percentage points to 57.4%. Operating cash flow generation remained strong, enabling Bharti Airtel to maintain capital allocation discipline while reducing net debt excluding lease obligations significantly to ₹818,521 million.
+-----------------------------------------------------------------------------------+
|                            BHARTI AIRTEL Q1 FY27 AT A GLANCE                      |
+------------------------------------+----------------------------------------------+
| Consolidated Revenue               | ₹585,391 Million (+18.4% YoY)                |
| Consolidated EBITDA                | ₹335,986 Million (+19.3% YoY)                |
| EBITDA Margin                      | 57.4% (up 40 bps YoY)                        |
| Net Profit (After Exceptional)     | ₹81,674 Million (+37.3% YoY)                 |
| India Mobile ARPU                  | ₹264 (vs ₹250 in Q1 FY26)                    |
| Global Customer Base               | 680.89 Million (+12.5% YoY)                  |
| Net Debt (Excl. Leases)            | ₹818,521 Million (down 34.8% YoY)            |
+------------------------------------+----------------------------------------------+
Company Overview & Market Position
Bharti Airtel stands as one of the world’s leading telecommunications providers. Operating across 17 countries spanning India, 14 Sub-Saharan African markets, and presence via equity-accounted associates in Sri Lanka and Bangladesh, the company serves an aggregate footprint covering roughly 24% of the global population. As of June 30, 2026, Bharti Airtel achieved a milestone global customer base of 680.89 million, up 12.5% YoY. GSMA Intelligence data confirms Airtel’s standing as the second-largest mobile operator globally.
+-----------------------------------------------------------------------------------+
|                        BHARTI AIRTEL OPERATIONAL FOOTPRINT                        |
+------------------------------------+----------------------------------------------+
| Total Global Customers             | 680.89 Million                               |
| India Customer Base                | 491.89 Million                               |
| Africa Customer Base               | 189.00 Million                               |
| India Mobile 4G/5G Data Users      | 301.77 Million (80.5% penetration)           |
| India Fiber Network                | 542,570 Route Kilometers                     |
| Global Tower Footprint             | 388,791 Towers                               |
+------------------------------------+----------------------------------------------+
The company operates a diversified portfolio comprising Consumer (B2C) and Business (B2B) verticals:
India B2C Services: Encompasses Mobile Services, Homes Broadband (FTTH), and Digital TV (DTH & IPTV). Mobile coverage extends across 7,905 census towns and 835,011 non-census towns and villages, covering 97.4% of the Indian population.
India B2B Services (Airtel Business): Provides end-to-end Information and Communications Technology (ICT) infrastructure, cloud services, cyber security, IoT connectivity, CPaaS, and global subsea connectivity spanning over 421,000 route kilometers across 50+ countries.
Passive Infrastructure Services: Operated through its subsidiary, Indus Towers Limited (consolidated line-by-line effective November 19, 2024), maintaining 267,611 macro towers across 22 telecom circles in India.
Africa Operations: Carried out by London- and Nigerian-listed Airtel Africa plc, offering mobile voice, high-speed mobile data, and mobile financial services (Airtel Money) across 14 Sub-Saharan nations.
Q1 FY27 Financial Highlights
The following table summarizes Bharti Airtel’s audited consolidated financial statements for the quarter ended June 30, 2026, prepared under Indian Accounting Standards (Ind-AS), compared with the prior year period and preceding quarter.
| Financial Parameter (in ₹ Million) | Q1 FY27 (Jun 2026) | Q4 FY26 (Mar 2026) | Q1 FY26 (Jun 2025) | YoY Growth (%) | QoQ Growth (%) |
| Total Revenue | 585,391 | 553,832 | 494,626 | +18.4% | +5.7% |
| EBITDA | 335,986 | 320,382 | 281,668 | +19.3% | +4.9% |
| EBITDA Margin (%) | 57.4% | 57.8% | 56.9% | +40 bps | -40 bps |
| EBITDAAL (Pre-Ind-AS 116) | 298,396 | 286,466 | 249,945 | +19.4% | +4.2% |
| EBITDAAL Margin (%) | 51.0% | 51.7% | 50.5% | +50 bps | -70 bps |
| EBIT | 192,816 | 181,560 | 156,209 | +23.4% | +6.2% |
| Finance Costs (Net) | 52,634 | 50,348 | 51,993 | +1.2% | +4.5% |
| Profit Before Tax (PBT) | 141,262 | 132,054 | 105,044 | +34.5% | +7.0% |
| Tax Expense | 41,510 | 40,327 | 30,826 | +34.7% | +2.9% |
| Net Income (Pre-Exceptional) | 80,572 | 72,449 | 59,479 | +35.5% | +11.2% |
| Exceptional Items (Net of Tax/NCI) | 1,102 | (803) | 0 | N/A | N/A |
| Net Income (Post-Exceptional) | 81,674 | 73,251 | 59,479 | +37.3% | +11.5% |
| Capital Expenditure (Capex) | 133,860 | 160,656 | 83,070 | +61.1% | -16.7% |
| Operating Free Cash Flow (EBITDA – Capex) | 202,126 | 159,726 | 198,598 | +1.8% | +26.5% |
| Net Debt (Excl. Lease Obligations) | 818,521 | 910,485 | 1,254,893 | -34.8% | -10.1% |
| Net Debt (Incl. Lease Obligations) | 1,572,396 | 1,647,888 | 1,915,794 | -17.9% | -4.6% |
Detailed Revenue Analysis
Bharti Airtel’s total revenues grew 18.4% YoY to ₹585,391 million, reflecting positive traction across all major operating business segments:
+-----------------------------------------------------------------------------------+
|                        Q1 FY27 REVENUE CONTRIBUTION BY SEGMENT                    |
+------------------------------------+----------------------------------------------+
| India Mobile Services              | ₹299,289 Million (51.1% of Consolidated)      |
| Airtel Africa                      | ₹175,657 Million (30.0% of Consolidated)      |
| Passive Infrastructure (Indus)     | ₹84,311 Million (14.4% of Consolidated)       |
| Airtel Business (B2B)              | ₹56,654 Million (9.7% of Consolidated)        |
| Homes Services (Broadband)         | ₹22,875 Million (3.9% of Consolidated)        |
| Digital TV Services                | ₹7,734 Million (1.3% of Consolidated)         |
+------------------------------------+----------------------------------------------+
*Note: Inter-segment eliminations and reclassifications apply.
India Mobile Services: Generated revenues of ₹299,289 million, up 9.2% YoY from ₹273,966 million. Growth was propelled by data volume expansion, steady gains in 4G/5G subscribers, and tariff structural improvements over the past 12 months.
Homes Services: Continued its high-growth trajectory, generating ₹22,875 million, up 33.2% YoY from ₹17,179 million. The rapid scaling of Local Cable Operator (LCO) partnerships extended Airtel’s fiber footprint to 1,653 cities.
Airtel Business: Revenue expanded 12.0% YoY to ₹56,654 million, driven by persistent demand for corporate data connectivity, cloud integration, IoT solutions, and CPaaS platforms.
Digital TV Services: Recorded ₹7,734 million in revenue, representing a 1.4% YoY increase. The integration of IPTV offerings across 2,000+ cities helped stabilize subscription metrics.
Passive Infrastructure Services: Indus Towers contributed ₹84,311 million to top-line revenues, expanding 4.6% YoY, supported by continuous macro-tower rollouts and operator co-location additions.
Airtel Africa: Reported revenues in INR reached ₹175,657 million, up 45.4% YoY. In USD constant currency terms, Africa revenue grew 21.1% YoY to $1,836 million, demonstrating strong operational tailwinds in mobile voice, data, and mobile money services.
Profitability Analysis
Consolidated EBITDA for Q1 FY27 reached ₹335,986 million, compared with ₹281,668 million in Q1 FY26. Profitability margins held firm, benefiting from operating leverage as incremental network traffic was processed over established fiber and tower assets.
+-----------------------------------------------------------------------------------+
|                           Q1 FY27 MARGIN STRUCTURE                                |
+------------------------------------+----------------------------------------------+
| Consolidated EBITDA Margin         | 57.4% (vs 56.9% in Q1 FY26)                  |
| India SA EBITDA Margin             | 60.1% (vs 59.5% in Q1 FY26)                  |
| India Mobile EBITDA Margin         | 60.8% (vs 59.4% in Q1 FY26)                  |
| Airtel Africa EBITDA Margin        | 50.2% (vs 48.1% in Q1 FY26)                  |
| Consolidated EBIT Margin           | 32.9% (vs 31.6% in Q1 FY26)                  |
+------------------------------------+----------------------------------------------+
Total consolidated operating expenses (excluding access charges, license fees, and cost of goods sold) stood at ₹169,000 million, up 14.6% YoY. Energy expenses across network sites remained a focus, with India energy costs coming in at ₹41,987 million for the quarter.
Depreciation and amortization expenses increased by 14.2% YoY to ₹142,350 million, reflecting higher asset creation from ongoing 5G network deployments and fiber infrastructure additions. Net finance costs remained controlled at ₹52,634 million, up 1.2% YoY, as lower overall borrowing costs offset higher lease interest expenses.
Consolidated Profit Before Tax (PBT) expanded 34.5% YoY to ₹141,262 million. Income tax expense stood at ₹41,510 million. Net income after exceptional items reached ₹81,674 million, compared to ₹59,479 million in Q1 FY26.
ARPU (Average Revenue Per User) Analysis
India Mobile ARPU increased to ₹264 in Q1 FY27, representing a 5.4% YoY growth from ₹250 in Q1 FY26 and a 2.6% QoQ gain from ₹257 in Q4 FY26.
+-----------------------------------------------------------------------------------+
|                        INDIA MOBILE ARPU TRAJECTORY (in ₹)                        |
+------------------------------------+----------------------------------------------+
| Q1 FY26 (June 2025)                | ₹250                                         |
| Q2 FY26 (September 2025)           | ₹256                                         |
| Q3 FY26 (December 2025)            | ₹259                                         |
| Q4 FY26 (March 2026)               | ₹257                                         |
| Q1 FY27 (June 2026)                | ₹264                                         |
+------------------------------------+----------------------------------------------+
ARPU expansion was driven by structural market drivers:
Smartphone Migration: Continuous conversion of 2G feature phone users into 4G/5G data subscribers.
Postpaid Growth: Postpaid subscriber base reached 30.00 million (excluding IoT), growing 12.9% YoY. Total postpaid connections including B2B IoT/M2M connections expanded 58.3% YoY to 112.77 million.
Data Consumption Gains: Average monthly data usage per customer surged to 34.4 GB in Q1 FY27, up 27.7% YoY from 26.9 GB.
Premiumization Initiatives: Introduction of differentiated services such as ‘Fast Lane’ (leveraging 5G slicing technology for guaranteed performance) and bundled family plans.
Subscriber Analysis
Bharti Airtel consolidated its market leadership in India while driving digital adoption across its footprint.
+-----------------------------------------------------------------------------------+
|                         INDIA OPERATIONAL KPIS SUMMARY                            |
+------------------------------------+----------------------------------------------+
| Total India Customers              | 491.89 Million (+12.8% YoY)                  |
| India Mobile Customers             | 376.51 Million (+3.8% YoY)                   |
| 4G/5G Data Customers               | 301.77 Million (80.5% of Mobile Base)        |
| Mobile Monthly Churn               | 2.6% (vs 2.7% in Q1 FY26)                    |
| Homes Broadband Customers          | 14.69 Million (+33.9% YoY)                   |
| Digital TV Customers               | 16.00 Million (+2.0% YoY)                    |
+------------------------------------+----------------------------------------------+
Mobile Subscriber Highlights (India)
Total India Mobile subscriber base stood at 376.51 million, with 3.27 million net additions in Q1 FY27.
Smartphone (4G/5G) data customer base reached 301.77 million, representing 80.5% of the total mobile user base. Net 4G/5G additions stood at 5.02 million QoQ and 21.08 million YoY.
Mobile monthly churn remained stable at 2.6%.
Total voice traffic on the network reached 1,276 billion minutes, while total data traffic grew 36.0% YoY to 31,062 million GBs (31.06 Petabytes).
Fixed Broadband & Digital TV
Homes broadband base reached 14.69 million customers, adding 473,000 net users during the quarter.
Digital TV base stood at 16.00 million customers, with an ARPU of ₹160.
Airtel Africa Performance
Airtel Africa plc delivered strong constant-currency top-line expansion, supported by active data adoption and mobile financial services growth.
+-----------------------------------------------------------------------------------+
|                      AIRTEL AFRICA FINANCIAL SUMMARY (USD)                        |
+------------------------------------+----------------------------------------------+
| Revenue (Constant Currency)        | $1,836 Million (+21.1% YoY)                  |
| Revenue (Reported Currency)        | $1,853 Million (+31.0% YoY)                  |
| EBITDA (Constant Currency)         | $921 Million (+24.4% YoY)                    |
| EBITDA Margin                      | 50.1% (vs 48.8% in Q1 FY26)                  |
| Total Africa Customers             | 189.00 Million (+11.6% YoY)                  |
| Data Customer Base                 | 87.33 Million (46.2% penetration)            |
| Airtel Money Active Users          | 56.49 Million (+23.3% YoY)                   |
| Airtel Money Transaction Value     | $60.98 Billion (+37.4% YoY)                  |
+------------------------------------+----------------------------------------------+
Operational Highlights
Customer Growth: Total customer base reached 189.00 million, adding 5.45 million net users in Q1 FY27. Data customers reached 87.33 million.
Mobile Money Momentum: Active Airtel Money customers reached 56.49 million. Annualized transaction value processed via the platform reached $60.98 billion, generating $400 million in Airtel Money revenue (+25.8% YoY in constant currency).
Strategic Developments: Airtel Africa launched a share buyback program of up to $110 million. The company confirmed London as its preferred listing venue for the proposed IPO of Airtel Money, subject to regulatory approvals.
5G Strategy & Infrastructure Expansion
Bharti Airtel accelerated its infrastructure density across India, expanding its 5G footprint through targeted deployments:
+-----------------------------------------------------------------------------------+
|                       INFRASTRUCTURE & 5G ROLLOUT METRICS                         |
+------------------------------------+----------------------------------------------+
| India Mobile Broadband Base Stations| 1,202,434 (+68,465 YoY)                      |
| India Network Towers               | 347,491 (+7,631 YoY)                         |
| Optic Fiber Footprint              | 542,570 Route Kilometers (+45,171 Rkms YoY)   |
| Upper North 5G Additions (12 mos)  | 2,900+ New Sites                             |
| Maharashtra & Goa 5G Additions     | 3,400+ New Sites                             |
| UP East 5G Additions (12 mos)      | 4,300+ New Sites                             |
+------------------------------------+----------------------------------------------+
5G Network Deployment: Deployed tens of thousands of 5G sites over the past 12 months, including 4,300+ new sites in UP East, 3,400+ in Maharashtra & Goa, and 2,900+ in the Upper North region.
5G Monetization: Airtel launched Fast Lane, utilizing 5G Standalone/Non-Standalone network slicing capabilities to deliver dedicated, low-latency high-speed connectivity for premium postpaid users.
Enterprise Use Cases: Unveiled Airtel Secure Workforce, a fully-managed Zero Trust Architecture (ZTA) cyber security solution designed to protect hybrid corporate workforces against AI-driven threats.
Management Commentary & Strategic Priorities
Management Highlights & Strategic Focus
Global Milestone: Airtel surpassed 650 million global customers, solidifying its position as the world’s second-largest telecommunications operator.
Credit Rating Upgrade: S&P Global upgraded Bharti Airtel’s credit rating to ‘BBB+’, citing robust earnings, strong cash flow generation, and balance sheet deleveraging.
Governance Transitions: Sunil Bharti Mittal retired as Chair of the Board of Airtel Africa plc, succeeded by Gopal Vittal as Non-Executive Chair effective July 9, 2026. Rahul Vatts was elevated to Group Chief Regulatory Officer and Director – Corporate Affairs.
Capital Allocation: Total Q1 FY27 capex stood at ₹133,860 million. Management reiterated its commitment to long-term free cash flow generation, targeted network densification, and balance sheet strength.
Segment-Wise Performance Table
The following table provides a detailed segment breakdown of Bharti Airtel’s operations for Q1 FY27 compared with Q1 FY26:
| Business Segment | Revenue (₹ Mn) | YoY Rev Growth (%) | EBITDA (₹ Mn) | EBITDA Margin (%) | Capex (₹ Mn) | Cumulative Inv. (₹ Mn) |
| Mobile Services (India) | 299,289 | +9.2% | 181,871 | 60.8% | 45,764 | 3,829,608 |
| Homes Services | 22,875 | +33.2% | 11,239 | 49.1% | 18,996 | 275,864 |
| Digital TV Services | 7,734 | +1.4% | 3,321 | 42.9% | 5,883 | 157,168 |
| Airtel Business (B2B) | 56,654 | +12.0% | 24,922 | 44.0% | 9,439 | 423,061 |
| Passive Infra (Indus) | 84,311 | +4.6% | 46,220 | 54.8% | 17,140 | 1,161,093 |
| India SA Sub-Total | 412,140 | +9.7% | 247,810 | 60.1% | 96,982 | 5,880,021 |
| Airtel Africa | 175,657 | +45.4% | 88,177 | 50.2% | 36,878 | 968,752 |
| Eliminations / Others | (2,406) | N/A | (1) | N/A | 0 | 0 |
| Consolidated Total | 585,391 | +18.4% | 335,986 | 57.4% | 133,860 | 6,848,773 |
Balance Sheet Analysis
Bharti Airtel’s balance sheet strengthened considerably over the past 12 months, supported by profit retention, reduced debt obligations, and credit rating upgrades.
+-----------------------------------------------------------------------------------+
|                        BALANCE SHEET & DEBT POSITION                              |
+------------------------------------+----------------------------------------------+
| Total Assets                       | ₹5,715,450 Million                           |
| Total Shareholders' Equity (Parent)| ₹1,618,151 Million                           |
| Net Debt (Excl. Lease Obligations) | ₹818,521 Million (vs ₹1,254,893 Mn in Q1 FY26)|
| Net Debt (Incl. Lease Obligations) | ₹1,572,396 Million                           |
| Net Debt to EBITDA (Annualized)    | 1.17x (vs 1.70x in Q1 FY26)                  |
| Pre-Ind-AS Net Debt / EBITDAAL     | 0.69x (vs 1.26x in Q1 FY26)                  |
| Interest Coverage Ratio            | 7.64x (vs 6.32x in Q1 FY26)                  |
+------------------------------------+----------------------------------------------+
Key Balance Sheet Trends
Capital Structure: Shareholders’ equity attributable to the parent rose to ₹1,618,151 million, up from ₹1,197,236 million as of June 30, 2025. Book value per equity share advanced to ₹259.32.
Deleveraging Momentum: Net debt excluding lease obligations dropped by ₹436,372 million over the past year, standing at ₹818,521 million ($8,675 million).
Credit Ratios: Net Debt-to-EBITDA (annualized) improved to 1.17x, compared to 1.70x in Q1 FY26. Excluding lease obligations, Net Debt-to-EBITDAAL dropped below 0.70x to 0.69x. Interest coverage ratio expanded to 7.64x.
Cash Flow Analysis
Bharti Airtel generated healthy operational cash flows in Q1 FY27, providing full self-funding capacity for capital expenditure programs and debt servicing.
+-----------------------------------------------------------------------------------+
|                         CASH FLOW SUMMARY (Q1 FY27)                               |
+------------------------------------+----------------------------------------------+
| Net Cash from Operating Activities | ₹336,346 Million                             |
| Operating Free Cash Flow (EBITDA-Capex)| ₹202,126 Million                          |
| Capital Expenditure (Capex)        | ₹133,860 Million                             |
| Cash & Cash Equivalents (End Period)| ₹198,360 Million                            |
+------------------------------------+----------------------------------------------+
Operating Cash Flow: Net cash generated from operating activities totaled ₹336,346 million, up from ₹306,898 million in Q1 FY26, driven by higher operational EBITDA and working capital management.
Investing Cash Flow: Net cash used in investing activities reached ₹318,110 million, including capital additions to property, plant, and equipment (PPE) of ₹138,484 million and investments in short-term liquid funds.
Financing Cash Flow: Net cash used in financing activities stood at ₹65,264 million, reflecting lease payments of ₹21,863 million, interest payments of ₹32,095 million, and buyback of perpetual bonds from non-controlling interests of ₹45,513 million.
Peer Comparison
The Indian telecommunications sector remains a structural duopoly between Bharti Airtel and Reliance Jio, with Vodafone Idea and state-owned BSNL maintaining smaller market shares.
| Parameter | Bharti Airtel (Q1 FY27) | Reliance Jio (Industry Context) | Vodafone Idea (Industry Context) |
| Consolidated Revenue (₹ Mn) | 585,391 | Dominant market leader in total user volume | Focus on capital raising & 4G/5G upgrades |
| India Mobile ARPU (₹) | 264 | Premium market benchmark | Under pressure due to subscriber churn |
| 4G/5G Customer Base (Mn) | 301.77 | Pure-play 4G/5G network | Transitioning 2G users to 4G |
| Homes Broadband Base (Mn) | 14.69 | Rapid FTTH and AirFiber expansion | Niche presence |
| Net Debt / EBITDA | 1.17x | Well-capitalized balance sheet | Elevated leverage levels |
| Consolidated EBITDA Margin | 57.4% | ~50–52% | Margin constrained by scale |
Comparative Insights
Bharti Airtel maintains the industry benchmark for India Mobile ARPU at ₹264, reflecting high premiumization, strong postpaid market share, and high enterprise revenue contributions. While Reliance Jio leads in total raw mobile customer volume, Airtel demonstrates superior capital efficiency, higher return on capital employed (ROCE at 21.5%), and a corporate ICT services portfolio via Airtel Business.
Share Price Reaction & Market Valuation
Following the submission of Q1 FY27 earnings on August 4, 2026, Bharti Airtel stock traded firmly on the BSE and NSE.
+-----------------------------------------------------------------------------------+
|                        STOCK MARKET SNAPSHOT (JUNE 30, 2026)                      |
+------------------------------------+----------------------------------------------+
| BSE Closing Price                  | ₹1,852 per share                             |
| Market Capitalization              | ₹11,559 Billion ($122.51 Billion)            |
| Enterprise Value                   | ₹13,131 Billion ($139.17 Billion)            |
| EV / EBITDA Multiple               | 9.77x                                        |
| Price-to-Earnings (P/E) Ratio      | 37.75x                                       |
| Price-to-Book (P/B) Ratio          | 7.14x                                        |
| 1-Year Relative Performance        | -7.8% (vs Sensex -8.5%, Nifty -6.5%)         |
+------------------------------------+----------------------------------------------+
The stock traded near ₹1,852 per share, giving the company a market capitalization of ₹11,559 billion ($122.51 billion). Enterprise Value stood at ₹13,131 billion, placing the trailing EV/EBITDA multiple at 9.77x. Institutional market consensus remains positive, supported by the S&P credit rating upgrade to ‘BBB+’ and deleveraging progress.
Analyst Reactions & Consensus
Sell-side equity research analysts across major domestic and international brokerages maintain an optimistic outlook on Bharti Airtel Limited.
Consensus Rating: Overwhelmingly “BUY” / “OUTPERFORM”.
Key Bull Thesis Arguments:
Sustained ARPU Expansion: Expected structural industry tariff revisions and ongoing 2G-to-4G/5G conversion provide upside visibility toward the ₹300 ARPU target.
Free Cash Flow Inflection: As peak 5G capital expenditure tapers off, free cash flow generation is expected to accelerate, driving accelerated balance sheet deleveraging and higher dividend payouts.
Non-Mobile Growth Engines: Rapid growth in Homes broadband (+33.2% YoY revenue) and Airtel Business (+12.0% YoY revenue) diversifies revenue away from pure mobile tariffs.
Key Bear/Risk Arguments:
Currency devaluation in key African markets (e.g., Nigerian Naira volatility) affecting translated earnings.
Competitive pricing pressures in fixed broadband and enterprise connectivity segments.
SWOT Analysis
+-----------------------------------------------------------------------------------+
|                            BHARTI AIRTEL SWOT ANALYSIS                            |
+-----------------------------------------------------------------------------------+
| STRENGTHS                                  | WEAKNESSES                           |
| • Industry-leading India Mobile ARPU (₹264)| • Exposure to African currency risks |
| • Diversified footprint (India, B2B, Africa)| • High capital intensity in 5G/Fiber |
| • S&P Investment grade rating ('BBB+')     | • Lower margins in Digital TV segment|
+--------------------------------------------+--------------------------------------+
| OPPORTUNITIES                              | THREATS                              |
| • 5G enterprise monetization (ZTA, Slicing)| • Fierce price competition in FTTH   |
| • Airtel Money IPO listing in London       | • Regulatory shifts in spectrum fees |
| • Scaling B2B cloud, IoT, and data centers | • Macroeconomic shocks in Africa     |
+-----------------------------------------------------------------------------------+
Key Growth Opportunities
Enterprise 5G Monetization: Solutions like Airtel Secure Workforce and network slicing (Fast Lane) position Airtel to capture high-margin corporate IT security and dedicated connectivity spending.
FTTH Broadband Penetration: Expanding the LCO partnership model across Tier-2, Tier-3, and Tier-4 towns offers significant growth upside for the Homes division.
Airtel Money Fintech Expansion: The planned London listing of Airtel Money provides a catalyst to unlock value in African digital payments and financial services.
Data Centers & Cloud (Nxtra): Expanding Nxtra data center capacity addresses rising domestic demand for cloud infrastructure, enterprise hosting, and AI workloads.
Key Business & Sector Risks
Foreign Exchange Volatility: Currency devaluations in Sub-Saharan African economies can impact reported rupee numbers.
Regulatory & Spectrum Costs: Future regulatory adjustments regarding spectrum usage charges or licensing frameworks remain an ongoing consideration.
Capital Intensity: Maintaining network density, fiber backhaul expansion, and subsea cable investments requires disciplined capital allocation.
Investment Thesis
Bull Case: ARPU breaches ₹300 within 12–18 months driven by tariff revisions and 5G uptake. Peak capex tapers, expanding free cash flows. Airtel Money IPO unlocks value, driving market capitalization higher.
Base Case: Mobile ARPU grows steadily at 6–8% annually. Homes broadband and Airtel Business maintain double-digit top-line growth. Net debt-to-EBITDA remains comfortably below 1.2x, supporting steady earnings compounding.
Bear Case: Heightened market competition delays tariff revisions. African currency devaluations erode international profits, keeping consolidated earnings range-bound.
Key Takeaways
Consolidated Revenue: Reached ₹585,391 million in Q1 FY27, up 18.4% YoY.
Consolidated EBITDA: Rose 19.3% YoY to ₹335,986 million with a 57.4% margin.
Net Profit: Post-exceptional net income stood at ₹81,674 million, up 37.3% YoY.
India Mobile ARPU: Expanded to ₹264, leading the domestic industry.
4G/5G Penetration: Smartphone users reached 301.77 million (80.5% of mobile base).
Homes Broadband: Revenues jumped 33.2% YoY to ₹22,875 million with 14.69 million subscribers.
Airtel Business: Revenue grew 12.0% YoY to ₹56,654 million.
Airtel Africa: Constant currency revenue expanded 21.1% YoY to $1,836 million.
Balance Sheet: Net debt excluding lease obligations dropped 34.8% YoY to ₹818,521 million.
Credit Rating: S&P Global upgraded Bharti Airtel’s credit rating to ‘BBB+’.
Global Footprint: Aggregate subscriber base reached 680.89 million across 17 countries.
Conclusion
Bharti Airtel Limited’s Q1 FY27 financial results reflect sustained operational momentum across both domestic and international markets. By combining mobile ARPU expansion, rapid growth in fixed broadband and B2B digital services, and balance sheet deleveraging, the company has positioned itself for long-term free cash flow generation and value creation. Supported by an upgraded ‘BBB+’ credit rating from S&P, disciplined capital allocation, and innovative 5G enterprise solutions, Bharti Airtel continues to demonstrate strong industry leadership in the global telecommunications sector.



