

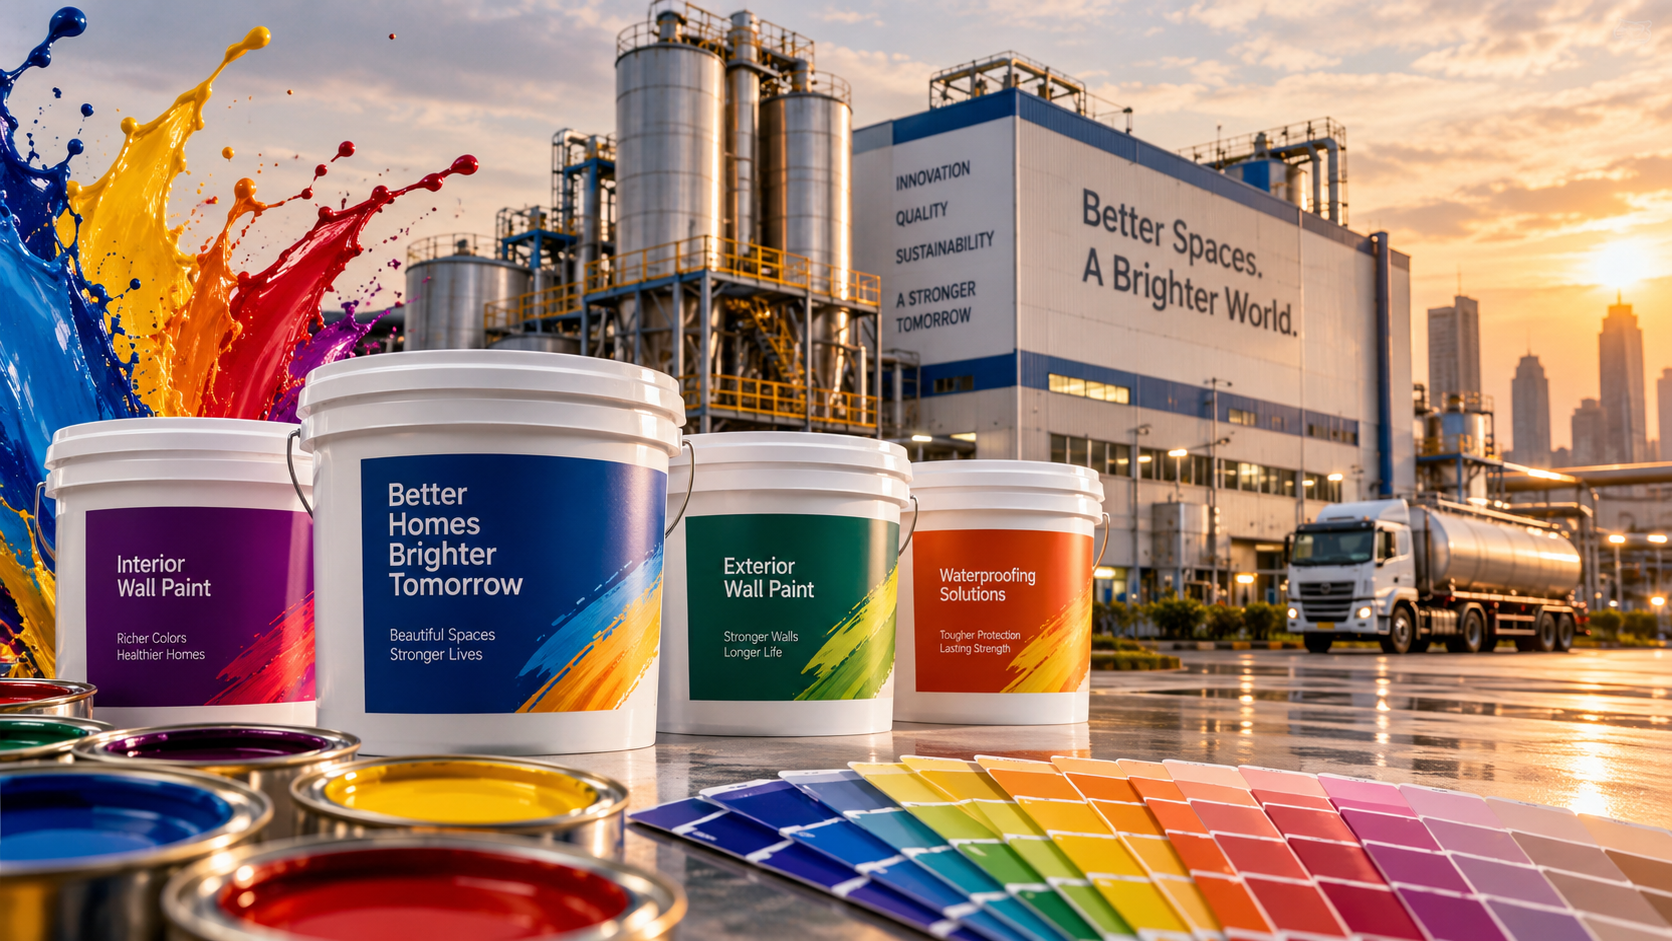
Berger Paints India Limited delivered a strong operational performance in the first quarter of Financial Year 2026–27 (Q1 FY27). The Kolkata-headquartered paint and coatings manufacturer reported double-digit growth across top-line and bottom-line metrics, navigating a challenging global geopolitical backdrop marked by rising crude prices and supply chain turbulence.
Driven by steady volume pick-up in decorative coatings, price hikes implemented in late Q1, and sustained demand in the automotive segment following GST rationalizations, Berger Paints reported a consolidated net profit surge of 28.6% year-on-year (YoY). With broader domestic demand showing signs of recovery and the monsoon progressing well, investors are reviewing whether Berger Paints can maintain its growth trajectory amidst intensifying competitive pressure from established rivals and new industry entrants.
Company Overview
Founded in 1923, Berger Paints India Limited is the second-largest paint company in India and ranks among the top 15 coatings manufacturers globally. The company manufactures and distributes decorative finishes, industrial coatings, protective coatings, automotive coatings, waterproofing products, and construction chemicals.
┌─────────────────────────────────────────────────────────────────────────────┐
│                       BERGER PAINTS INDIA LIMITED                           │
│                      Business & Revenue Architecture                         │
└──────────────────────────────────────┬──────────────────────────────────────┘
                                       │
         ┌─────────────────────────────┼─────────────────────────────┐
         ▼                             ▼                             ▼
┌─────────────────┐           ┌─────────────────┐           ┌─────────────────┐
│   DECORATIVE    │           │   INDUSTRIAL    │           │  INTERNATIONAL  │
│    COATINGS     │           │   & SPECIALTY   │           │   OPERATIONS    │
└────────┬────────┘           └────────┬────────┘           └────────┬────────┘
         │                             │                             │
 ┌───────┴───────┐             ┌───────┴───────┐             ┌───────┴───────┐
 │ • Interior /  │             │ • Automotive  │             │ • Bolix S.A.  │
 │   Exterior    │             │   Coatings    │             │   (Poland/EU) │
 │ • Premium     │             │ • Protective  │             │ • Nepal       │
 │   Emulsions   │             │   Coatings    │             │   Operations  │
 │ • Waterproof- │             │ • General     │             │ • UK & Cyprus │
 │   ing & CC    │             │   Industrials │             │   Subsidiaries│
 └───────────────┘             └───────────────┘             └───────────────┘
Business Model & Revenue Distribution: Berger Paints generates approximately 80% of its revenues from the decorative paint business. The remaining 20% stems from industrial segments, including automotive coatings, protective coatings, general industrial finishes, and powder coatings.
Product Categories: Key retail brands include Silk (luxurious emulsions), Easy Clean (stain-resistant paints), WeatherCoat Anti-Dustt (exterior protection), Express Painting (automated application services), and newly launched lines such as Kolor Plus and the Metallics range.
Waterproofing & Construction Chemicals: Operating both directly and through its subsidiary STP Limited, Berger offers comprehensive waterproofing systems, concrete admixtures, and structural repair formulations.
Manufacturing & Distribution Network: The company operates state-of-the-art manufacturing facilities spread across India. Its distribution network spans over 55,000 retail dealers supported by tinting machines placed at retail touchpoints.
International Footprint: Berger Paints maintains active operations in Nepal (via Berger Jenson & Nicholson) and Europe. Its Polish subsidiary, Bolix S.A., is a major regional player in External Thermal Insulation Composite Systems (ETICS). Joint ventures include Berger Becker Coatings (coil coatings) and Berger Nippon Paint Automotive Coatings.
Q1 FY27 Financial Highlights
During the quarter ended June 30, 2026, Berger Paints delivered a strong performance on both standalone and consolidated levels. Consolidated revenue from operations grew 12.0% YoY to ₹3,583.75 crore, while consolidated net profit increased 28.6% YoY to ₹405.01 crore.
┌─────────────────────────────────────────────────────────────────────────────┐
│                     Q1 FY27 CONSOLIDATED FINANCIAL SUMMARY                   │
├───────────────────────────┬───────────────────────────┬─────────────────────┤
│ Metric                    │ Q1 FY27 (₹ Cr)            │ YoY Growth (%)      │
├───────────────────────────┼───────────────────────────┼─────────────────────┤
│ Revenue from Operations   │ ₹3,583.75                 │ ▲ 12.0%             │
│ EBITDA (excl. Other Inc)  │ ₹607.40                   │ ▲ 15.0%             │
│ Net Profit (PAT)          │ ₹405.01                   │ ▲ 28.6%             │
│ Diluted EPS               │ ₹3.47                     │ ▲ 28.5%             │
└───────────────────────────┴───────────────────────────┴─────────────────────┘
The tables below provide the detailed financial performance metrics extracted directly from the company’s official filing on August 5, 2026:
Standalone Financial Summary (Q1 FY27)
| Financial Metric | Q1 FY27 (₹ Cr) | Q4 FY26 (₹ Cr) | Q1 FY26 (₹ Cr) | YoY Growth (%) | QoQ Growth (%) |
Revenue from Operations | 3,226.68 | 2,504.00 | 2,862.62 | 12.72% | 28.86% |
Other Income | 39.14 | 36.15 | 27.53 | 42.17% | 8.27% |
Total Income | 3,265.82 | 2,540.15 | 2,890.15 | 13.00% | 28.57% |
Cost of Materials & Stock | 2,047.84 | 1,625.94 | 1,591.14 | 28.70% | 25.95% |
Changes in Inventories | (88.55) | (181.02) | 124.40 | -171.18% | -51.08% |
Employee Expense | 180.30 | 160.64 | 160.04 | 12.66% | 12.24% |
Finance Costs | 9.96 | 9.45 | 11.36 | -12.32% | 5.40% |
Depreciation & Amortization | 91.11 | 88.15 | 83.06 | 9.69% | 3.36% |
Other Expenses | 524.87 | 439.70 | 487.55 | 7.65% | 19.37% |
Total Expenses | 2,765.53 | 2,142.86 | 2,457.55 | 12.53% | 29.06% |
EBITDA (excl. Other Income) | 562.20 | 449.29 | 499.50 | 12.55% | 25.13% |
Profit Before Tax (PBT) | 500.29 | 434.10 | 395.79 | 26.40% | 15.25% |
Total Tax Expense | 131.61 | 106.82 | 102.03 | 28.99% | 23.21% |
Net Profit (PAT) | 368.68 | 327.28 | 293.76 | 25.50% | 12.65% |
Basic & Diluted EPS (₹) | 3.16 | 2.81 | 2.52 | 25.40% | 12.46% |
Consolidated Financial Summary (Q1 FY27)
| Financial Metric | Q1 FY27 (₹ Cr) | Q4 FY26 (₹ Cr) | Q1 FY26 (₹ Cr) | YoY Growth (%) | QoQ Growth (%) |
Revenue from Operations | 3,583.75 | 2,868.03 | 3,200.76 | 11.97% | 24.96% |
Other Income | 38.90 | 21.71 | 28.46 | 36.68% | 79.18% |
Total Income | 3,622.65 | 2,889.74 | 3,229.22 | 12.18% | 25.36% |
EBITDA (excl. Other Income) | 607.40 | 470.07 | 528.40 | 14.95% | 29.22% |
EBITDA Margin (%) | 16.95% | 16.39% | 16.51% | +44 bps | +56 bps |
Finance Costs | 12.46 | 11.60 | 14.48 | -13.95% | 7.41% |
Depreciation & Amortization | 103.06 | 101.04 | 93.98 | 9.66% | 2.00% |
Share of JV Profit | 11.77 | 10.92 | 11.17 | 5.37% | 7.78% |
Profit Before Tax (PBT) | 542.59 | 438.49 | 422.77 | 28.34% | 23.74% |
Total Tax Expense | 137.58 | 103.24 | 107.73 | 27.71% | 33.26% |
Net Profit (PAT) | 405.01 | 335.25 | 315.04 | 28.56% | 20.81% |
PAT Attributable to Owners | 404.34 | 334.77 | 314.63 | 28.51% | 20.78% |
Diluted EPS (₹) | 3.47 | 2.87 | 2.70 | 28.52% | 20.91% |
Quarter-on-Quarter (QoQ) Comparison
The sequential comparison highlights strong seasonal recovery and operational execution from Q4 FY26 to Q1 FY27.
┌─────────────────────────────────────────────────────────────────────────────┐
│                   SEQUENTIAL PERFORMANCE (Q4 FY26 vs Q1 FY27)               │
├───────────────────────────────────┬───────────────────┬─────────────────────┤
│ Consolidated Metric               │ Q4 FY26 (₹ Cr)    │ Q1 FY27 (₹ Cr)      │
├───────────────────────────────────┼───────────────────┼─────────────────────┤
│ Revenue from Operations           │ ₹2,868.03         │ ₹3,583.75 (+25.0%)  │
│ EBITDA (excl. Other Income)       │ ₹470.07           │ ₹607.40   (+29.2%)  │
│ Net Profit (PAT)                  │ ₹335.25           │ ₹405.01   (+20.8%)  │
└───────────────────────────────────┴───────────────────┴─────────────────────┘
| Metric (Consolidated) | Q1 FY27 (₹ Cr) | Q4 FY26 (₹ Cr) | Absolute Change (₹ Cr) | QoQ Variance (%) |
Revenue from Operations | 3,583.75 | 2,868.03 | +715.72 | +24.96% |
Total Income | 3,622.65 | 2,889.74 | +732.91 | +25.36% |
Cost of Materials & Inventory | 2,118.55 | 1,600.68 | +517.87 | +32.35% |
Employee Expense | 245.08 | 222.39 | +22.69 | +10.20% |
Other Expenses | 612.68 | 563.29 | +49.39 | +8.77% |
Operating EBITDA | 607.40 | 470.07 | +137.33 | +29.22% |
Profit Before Tax (PBT) | 542.59 | 438.49 | +104.10 | +23.74% |
Net Profit (PAT) | 405.01 | 335.25 | +69.76 | +20.81% |
Key Sequential Takeaways:
Seasonal Demand Expansion: Revenue surged nearly 25% sequentially, driven by pre-monsoon painting schedules and demand in residential real estate.
Margin Expansion: Consolidated EBITDA margin improved by 56 basis points QoQ to 16.95% due to higher operating leverage and strict control over fixed overheads.
No Exceptional Loss Items: PBT reflected clean operational growth without negative disruptions from exceptional inventory write-offs or plant disruptions seen in earlier quarters.
Year-on-Year (YoY) Comparison
Comparing Q1 FY27 against Q1 FY26 highlights sustained top-line expansion and bottom-line profit recovery.
| Metric (Consolidated) | Q1 FY27 (₹ Cr) | Q1 FY26 (₹ Cr) | Absolute Change (₹ Cr) | YoY Growth (%) |
Revenue from Operations | 3,583.75 | 3,200.76 | +382.99 | +11.97% |
Operating EBITDA | 607.40 | 528.40 | +79.00 | +14.95% |
EBITDA Margin (%) | 16.95% | 16.51% | — | +44 bps |
Finance Costs | 12.46 | 14.48 | -2.02 | -13.95% |
Depreciation | 103.06 | 93.98 | +9.08 | +9.66% |
Profit Before Tax (PBT) | 542.59 | 422.77 | +119.82 | +28.34% |
Net Profit (PAT) | 405.01 | 315.04 | +89.97 | +28.56% |
Key YoY Drivers:
Top-Line Growth: Standalone value growth stood at 12.72%, outpacing underlying volume growth as price increases implemented toward late Q1 began realizing full effect.
Base Effect Benefit: In Q1 FY26, profitability was hit by an exceptional loss of ₹36.81 crore from a warehouse fire incident in Barasat, West Bengal. The absence of exceptional losses in Q1 FY27 boosted YoY PBT and PAT growth.
Segment-wise Performance
┌─────────────────────────────────────────────────────────────────────────────┐
│                        SEGMENT PERFORMANCE SUMMARY                          │
├──────────────────────────────┬──────────────────────────────────────────────┤
│ Segment                      │ Key Highlights & Growth Drivers              │
├──────────────────────────────┼──────────────────────────────────────────────┤
│ Decorative Coatings          │ Double-digit growth; led by Kolor Plus &     │
│                              │ WeatherCoat premium products                 │
│ Automotive Coatings          │ Outperformed broader industry; supported by  │
│                              │ GST relief and lower interest rates          │
│ Waterproofing & CC           │ Strong double-digit expansion; market expansion│
│                              │ via STP Ltd and retail dealer network        │
│ Industrial & Protective      │ Modest volume growth; price hikes to register │
│                              │ full effect starting Q2 FY27                 │
│ International & JVs          │ Strong JV performance (Berger Becker &       │
│                              │ Nippon Paint); European operations steady    │
└──────────────────────────────┴──────────────────────────────────────────────┘
Decorative Paint Business:
Value growth outpaced volume growth during Q1 FY27.
Premium exterior and interior emulsions experienced high demand, supported by marketing pushes for the Kolor Plus line and the Metallics range.
Growth was boosted by expansion in tier-3, tier-4, and underpenetrated urban retail markets.
Automotive Coatings:
Delivered standout performance during the quarter.
Vehicle demand, reduced financing rates, and lower overall ownership costs expanded auto assembly production, boosting OEM coating volumes.
Berger Nippon Paint Automotive Coatings JV delivered strong financial and volume contributions.
Waterproofing & Construction Chemicals:
Maintained double-digit volume growth.
Growth was driven by home construction, urban infrastructure projects, and increasing adoption of waterproofing prior to paint application.
Industrial & Protective Coatings:
Industrial segments delivered lower volume growth compared to decorative and automotive divisions.
Price hikes implemented late in Q1 FY27 will fully realize starting Q2 FY27, which is expected to support revenue and profitability in the coming quarters.
International Business & Joint Ventures:
European subsidiary Bolix S.A. performed steadily despite macroeconomic caution across the European Union.
Joint ventures Berger Becker Coatings (coil coatings) and Berger Nippon Paint Automotive Coatings recorded strong growth, contributing ₹11.77 crore to consolidated profit.
Management Commentary
Managing Director & Chief Executive Officer Abhijit Roy shared key operational insights following the approval of results on August 5, 2026:
“The progressive demand improvement seen in the previous quarter continued into the 1st quarter of the year which enabled the achievement of a Standalone value growth of 12.7% for the quarter. The value growth outpaced volume growth on the back of the price increases with the full benefit to accrue going forward. Our performance this quarter was driven by strong growths both in Automotive and Decorative segments.”
┌─────────────────────────────────────────────────────────────────────────────┐
│                         MANAGEMENT PERSPECTIVE                              │
├──────────────────────────┬──────────────────────────────────────────────────┤
│ Factor                   │ Commentary                                       │
├──────────────────────────┼──────────────────────────────────────────────────┤
│ Raw Material Costs       │ Crude inflation created margin headwinds; offset  │
│                          │ through operational efficiencies & price hikes   │
│ Margin Outlook           │ Consolidated EBITDA margin at 16.95% came in     │
│                          │ slightly ahead of guidance                       │
│ Industrial Realization   │ Late-Q1 price hikes will fully benefit Q2 FY27   │
│ Demand Tailwinds         │ Timely monsoon progress & festive season setup   │
└──────────────────────────┴──────────────────────────────────────────────────┘
Demand Environment: Operational momentum improved across major domestic markets, urban territories, and semi-urban distribution corridors.
Raw Material Inflation & Margins: Geopolitical instability in West Asia disrupted crude oil availability and prices, inflating crude-derivative raw material inputs. While this created headwinds for gross margins, operational discipline helped maintain an EBITDA margin of 16.95%, coming in slightly ahead of company guidance.
Brand Strategy: Berger launched its new corporate campaign featuring the tagline “Jaise Bhi Ho Din, Rang Bana Rahe”, emphasizing product durability and brand connection.
Key Growth Drivers
                            ┌────────────────────────┐
                            │   KEY GROWTH DRIVERS   │
                            └───────────┬────────────┘
                                        │
        ┌───────────────────┬───────────┴───────────┬───────────────────┐
        ▼                   ▼                       ▼                   ▼
┌───────────────┐   ┌───────────────┐       ┌───────────────┐   ┌───────────────┐
│ Housing &     │   │ Waterproofing │       │ Premium       │   │ Network       │
│ Urbanization  │   │ Expansion     │       │ Portfolio     │   │ Reach         │
└───────┬───────┘   └───────┬───────┘       └───────┬───────┘   └───────┬───────┘
        │                   │                       │                   │
  Infrastructure      Pre-painting              Higher margins      Tier 2/3/4
  investments &       adoption via              via Silk, Easy      market dealer
  re-painting         STP Ltd products          Clean, & Metallics  expansion
Housing Revival & Infrastructure Outlay: Infrastructure spending, urban renewal projects, and housing completions continue to drive structural demand for interior and exterior paints.
Expanding Waterproofing Penetration: Waterproofing coatings are growing at nearly double the rate of standard decorative paints. Berger’s integrated retail strategy captures this demand before decorative painting begins.
Product Premiumization: Consumers are increasingly trading up to high-durability, anti-dust, and washable paint products, lifting average selling prices (ASPs).
Dealer & Distribution Expansion: Expansion into tier-2, tier-3, and tier-4 locations, along with automated tinting machines at retail points, continues to expand market reach.
Major Risks
Crude Oil & Raw Material Volatility: Titanium dioxide ($TiO_2$), monomers, resins, and solvents are directly tied to global crude oil prices. Escalations in West Asian conflicts or supply bottlenecks pose cost risks.
Heightened Competitive Intensity:
Asian Paints: Market leader with deep distribution scale and brand strength.
Birla Opus (Grasim Industries): Aggressive capacity additions, trade discounts, and marketing campaigns from new entrants could pressure industry margins.
Kansai Nerolac & Akzo Nobel: Competing aggressively in industrial coatings, decorative segments, and premium categories.
Monsoon Spatial Distribution: Excessive rainfall during peak painting months can delay exterior residential painting projects.
Foreign Exchange Fluctuations: Currency volatility impacts foreign currency debt servicing and import costs for crucial raw materials.
Brokerage View
Following the Q1 FY27 results announcement, equity research analysts from major financial institutions expressed mixed perspectives:
┌─────────────────────────────────────────────────────────────────────────────┐
│                            BROKERAGE SENTIMENT                              │
├─────────────────────┬───────────────────────────────────────────────────────┤
│ Perspective         │ Core Rationale                                        │
├─────────────────────┼───────────────────────────────────────────────────────┤
│ Bull Case           │ • Resilient distribution network in East/North India │
│                     │ • Outperformance in automotive coatings segment       │
│                     │ • Expanding waterproofing & construction footprint   │
├─────────────────────┼───────────────────────────────────────────────────────┤
│ Bear Case           │ • Increasing trade discounts from new entrants        │
│                     │ • Near-term gross margin pressure from crude prices   │
│                     │ • Valuation multiples leave minimal safety margin     │
└─────────────────────┴───────────────────────────────────────────────────────┘
Bullish Arguments: Analysts highlight Berger’s strong distribution presence in East and North India, its outperformance in automotive coatings, expanding waterproofing footprint, and operational efficiency as key strengths. Price hikes implemented in late Q1 are expected to support earnings in Q2 FY27.
Bearish Arguments: Cautious analysts point to price competition and trade discounts from new entrants, potential margin compression from higher raw material costs, and elevated valuation multiples.
Share Price Analysis & Valuation
Berger Paints India Ltd. (NSE: BERGEPAINT | BSE: 509480) reacted positively to the Q1 FY27 results, trading higher in afternoon market sessions.
┌─────────────────────────────────────────────────────────────────────────────┐
│                         MARKET VALUATION METRICS                            │
├─────────────────────────────┬───────────────────────────────────────────────┤
│ Metric                      │ Figure / Range                                │
├─────────────────────────────┼───────────────────────────────────────────────┤
│ Current Market Price (CMP)  │ ₹533.80 per share                             │
│ Market Capitalization       │ ~₹62,241 Crore                                │
│ 52-Week High / Low          │ ₹594.55 / ₹391.10                             │
│ Price-to-Earnings (P/E)     │ ~54.5x (TTM)                                  │
│ Price-to-Book (P/B)         │ ~8.88x                                        │
└─────────────────────────────┴───────────────────────────────────────────────┘
Current Market Price (CMP): ₹533.80 per share
Market Capitalization: ~₹62,241 Crore
52-Week Range: ₹391.10 – ₹594.55
Price-to-Earnings (P/E) Ratio: ~54.5x TTM
Price-to-Book (P/B) Ratio: ~8.88x
Technical Levels
Immediate Support: ₹520.00 / ₹505.00
Immediate Resistance: ₹545.00 / ₹565.00
Trend Analysis: The stock has recovered from its 52-week low of ₹391.10, establishing higher-low chart patterns. A sustained move above ₹545.00 could open room toward its 52-week high of ₹594.55.
Financial Ratio Analysis
The following ratio analysis reflects Berger Paints’ standalone and consolidated financial position based on reported Q1 FY27 disclosures:
| Ratio Category | Metric | Q1 FY27 Value | Q1 FY26 Value | Status / Trend |
| Profitability Ratios | Consolidated EBITDA Margin | 16.95% | 16.51% | Expanded (+44 bps) |
Consolidated Net Profit Margin | 11.30% | 9.84% | Expanded (+146 bps) | |
Standalone Net Profit Margin | 11.43% | 10.26% | Expanded (+117 bps) | |
| Solvency Ratios | Finance Costs to Revenue | 0.35% | 0.45% | Improved (-10 bps) |
Tax Rate Efficiency | 25.35% | 25.48% | Stable | |
| Per Share Ratios | Consolidated Diluted EPS | ₹3.47 | ₹2.70 | Surged (+28.52%) |
Standalone Diluted EPS | ₹3.16 | ₹2.52 | Surged (+25.40%) |
Competitive Comparison
The table below compares Berger Paints with major listed paint manufacturers in India:
┌─────────────────────────────────────────────────────────────────────────────┐
│                          PEER COMPARISON OVERVIEW                           │
├─────────────────────┬───────────────────┬───────────────────┬───────────────┤
│ Metric              │ Berger Paints     │ Asian Paints      │ Kansai Nerolac│
├─────────────────────┼───────────────────┼───────────────────┼───────────────┤
│ Market Cap (₹ Cr)   │ ~₹62,241          │ ~₹2,63,635        │ ~₹16,500      │
│ Q1 FY27 Rev Growth  │ +12.0% YoY        │ ~+6% to +8% YoY   │ +9.7% YoY     │
│ Q1 FY27 Net Profit  │ ₹405 Cr (+28.6%)  │ Industry Lead     │ ₹228 Cr (+5.9%)│
│ Core Focus          │ Dec / Auto / WP   │ Decorative Leader │ Auto & Dec    │
└─────────────────────┴───────────────────┴───────────────────┴───────────────┘
| Parameter | Berger Paints India PDF | Asian Paints | Kansai Nerolac | Akzo Nobel India | Indigo Paints |
| Market Cap (₹ Cr) | ~62,241 | ~2,63,635 | ~16,500 | ~15,200 | ~6,800 |
| Q1 FY27 Top-line YoY | +12.00% | +6% to +8% (Est.) | +9.70% | +7% to +9% (Est.) | +10% to +12% (Est.) |
| Q1 FY27 Net Profit (₹ Cr) | ₹405.01 | Segment Leader | ₹228.41 | ~115 (Est.) | ~38 (Est.) |
| Q1 FY27 PAT YoY Growth | +28.56% | Steady | +5.90% | Steady | Moderate |
| P/E Ratio (TTM) | ~54.5x | ~52x | ~32x | ~34x | ~48x |
| Dominant Market Segment | Decorative & Auto | Decorative Emulsions | Automotive & Industrial | Premium Finishes | Tier 3/4 Dist. |
SWOT Analysis
                       ┌────────────────────────────────┐
                       │         SWOT ANALYSIS          │
                       └───────────────┬────────────────┘
                                       │
        ┌──────────────────────┬───────┴───────┬──────────────────────┐
        ▼                      ▼               ▼                      ▼
┌───────────────┐      ┌───────────────┐      ┌───────────────┐      ┌───────────────┐
│  STRENGTHS    │      │  WEAKNESSES   │      │ OPPORTUNITIES │      │    THREATS    │
├───────────────┤      ├───────────────┤      ├───────────────┤      ├───────────────┤
│ • #2 in India │      │ • Raw material│      │ • Waterproofing│      │ • Grasim      │
│ • Strong Auto │      │   crude dependency   │   expansion   │      │   entry       │
│   segment JV  │      │ • European    │      │ • Real estate │      │ • Crude oil   │
│ • Brand equity│      │   sub margins │      │   revival     │      │   inflation   │
└───────────────┘      └───────────────┘      └───────────────┘      └───────────────┘
| SWOT Dimension | Strategic Factors |
| Strengths | • Second-largest market share in India’s decorative paint sector. • Diversified revenues across decorative coatings, industrial finishes, and waterproofing. • Strong automotive relationships via the Berger Nippon Paint JV. • Established brand recall driven by marketing campaigns. |
| Weaknesses | • High reliance on crude oil derivatives for input raw materials. • Moderate margins in European overseas step-down operations. |
| Opportunities | • Expanding adoption of waterproofing products across urban and rural markets. • Ongoing urban housing completions and infrastructure spending. • Deepening dealer reach and machine tinting penetrations in tier-3/4 markets. |
| Threats | • Aggressive capacity expansion and price discounts from Grasim (Birla Opus). • Geopolitical tension in West Asia driving crude oil spikes. • Unseasonal or extended monsoon patterns impacting exterior paint demand. |
ESG Analysis & Sustainability
Environmental Initiatives: Berger Paints continues to transition toward low-VOC (Volatile Organic Compounds) and lead-free green formulations. Water recycling systems are active across major manufacturing facilities.
Energy-Saving Products: Through European subsidiary Bolix S.A., Berger manufactures External Thermal Insulation Composite Systems (ETICS) designed to improve building energy efficiency across European markets.
Social Responsibility & Training: Through its iTrain Centers, the company provides skill development and training for painters and contractors in modern application methods and automated equipment.
Governance: The Board of Directors includes independent directors overseeing audit, nomination, and stakeholder committees. Financial statements for Q1 FY27 received an unmodified review report from statutory auditors BSR & Co. LLP.
Future Outlook & FY27 Guidance
┌─────────────────────────────────────────────────────────────────────────────┐
│                            FY27 STRATEGIC OUTLOOK                           │
├──────────────────────────────┬──────────────────────────────────────────────┤
│ Focus Area                   │ Management Direction                         │
├──────────────────────────────┼──────────────────────────────────────────────┤
│ Volume & Value Growth        │ Expect double-digit volume growth            │
│ Margin Band Target           │ Maintain EBITDA margin around ~16.0% - 17.5% │
│ Industrial Price Realization │ Full price hike benefits starting Q2 FY27    │
│ Festive Season Setup         │ Expecting strong demand leading into Diwali  │
└──────────────────────────────┴──────────────────────────────────────────────┘
Revenue Trajectory: Management projects sustained double-digit revenue expansion for FY27, supported by festive painting season demand, home completion cycles, and expansion of waterproofing products.
Margin Expectations: Consolidated EBITDA margin is expected to remain between 16.0% and 17.5%. Price hikes taken in industrial segments will offset raw material input costs starting in Q2 FY27.
Capacity Expansion: Planned capital expenditures will expand manufacturing capacity across decorative emulsions and industrial coatings over the next 24 to 36 months.
Investment Thesis
┌─────────────────────────────────────────────────────────────────────────────┐
│                           INVESTMENT SUITABILITY                            │
├─────────────────────────┬───────────────────────────────────────────────────┤
│ Investor Profile        │ Thesis & Recommendation                           │
├─────────────────────────┼───────────────────────────────────────────────────┤
│ Long-Term Investors     │  SUITABLE: High ROCE, market share, structural growth│
│ Dividend Investors      │  MODERATE: Consistent payouts (~0.7% to 1.0% yield)│
│ Growth Investors        │  SUITABLE: Double-digit top/bottom-line growth    │
│ Value Investors         │ ⚠️ CAUTION: High P/E (~54.5x) limits safety margin │
└─────────────────────────┴───────────────────────────────────────────────────┘
For Long-Term Investors: SUITABLE. Berger Paints remains a high-quality compounder in the Indian consumer discretionary sector. Its distribution strength, brand equity, and expansion into waterproofing position it well to participate in India’s structural real estate growth.
For Dividend Investors: MODERATE. The company provides steady annual dividend payouts, though the yield (~0.7% to 1.0%) appeals more to growth-oriented dividend investors.
For Growth Investors: SUITABLE. Q1 FY27 results confirm top-line growth (12% YoY) and net profit growth (28.6% YoY), outperforming several sector peers.
For Value Investors: CAUTION. Trading at a forward P/E multiple above 50x, the stock trades at premium valuations. Value investors may prefer to accumulate shares during broader market pullbacks.
Conclusion
Berger Paints India Ltd. delivered a strong performance in Q1 FY27, achieving double-digit revenue growth and a 28.6% surge in consolidated net profit. By balancing price hikes with volume momentum in decorative paints and benefiting from outperformance in the automotive division, the company demonstrated operational resilience despite crude price volatility. While competition from new market entrants warrants close observation, Berger Paints’ execution, distribution network, and expanding product portfolio support its long-term investment outlook.



