

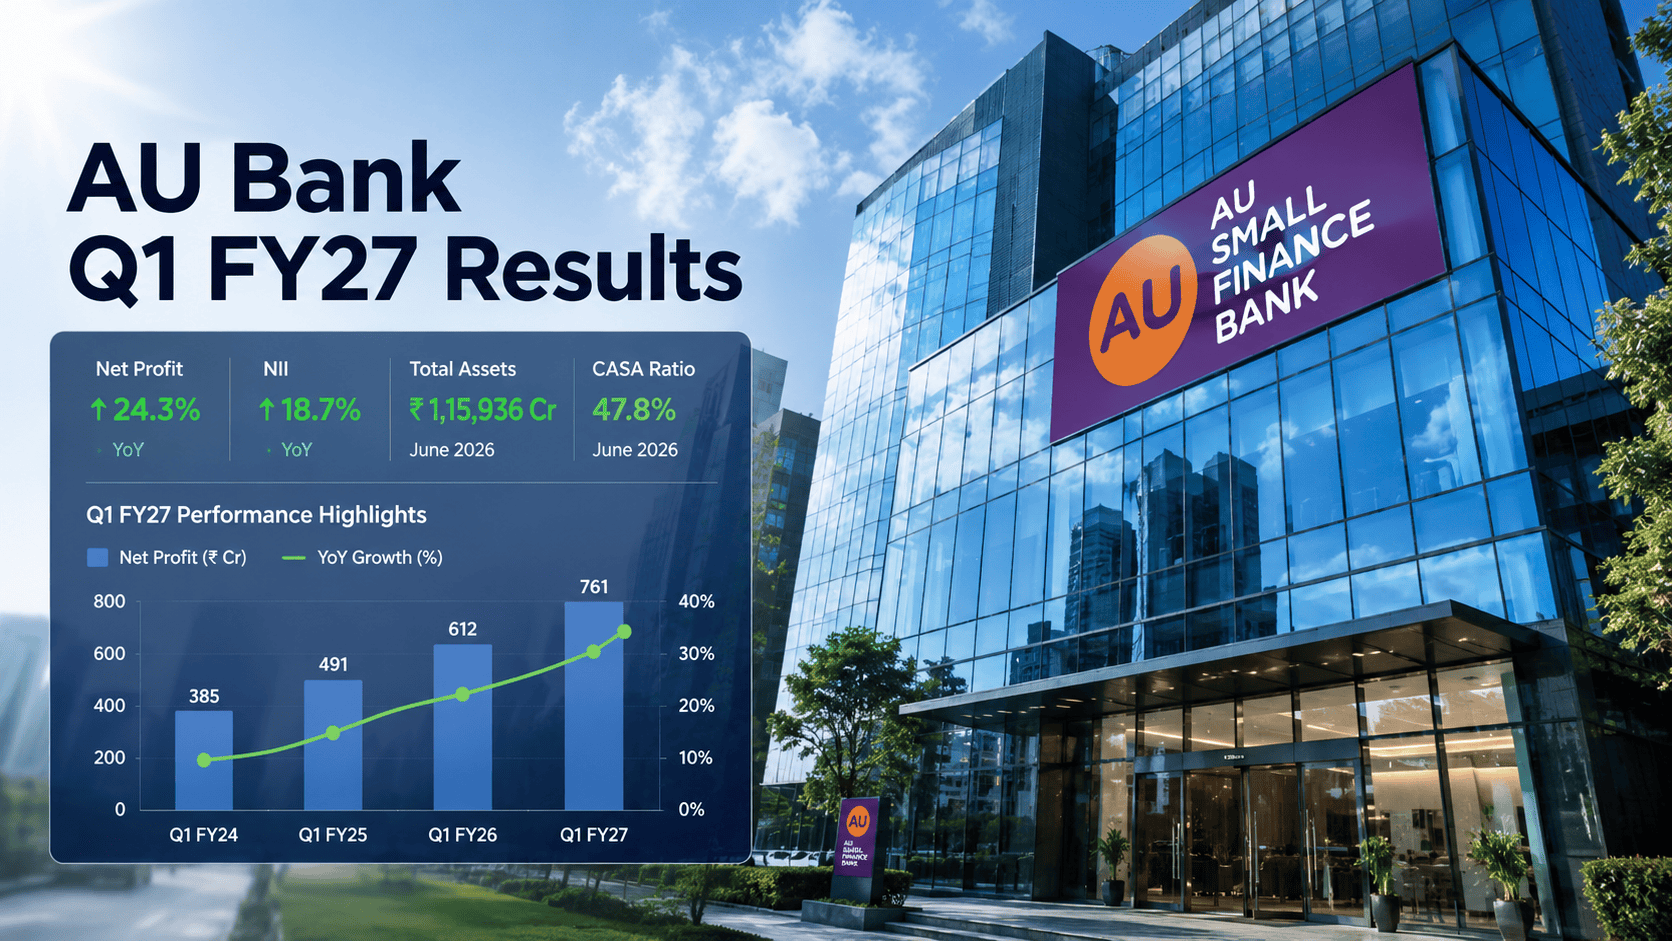
AU Small Finance Bank Limited announced its unaudited financial results for the first quarter of Financial Year 2026-27 (Q1 FY27) on July 25, 2026. The lender delivered a robust operating performance, highlighted by a 37.03% year-on-year (YoY) surge in net profit to ₹795.95 crore, up from ₹580.86 crore reported in the corresponding period of the previous fiscal year (Q1 FY26).
Total income for the quarter reached ₹5,991.96 crore, expanding by 15.47% YoY compared to ₹5,189.05 crore in Q1 FY26, driven primarily by strong expansion in interest income from advances. Net Interest Income (NII)—the primary core profitability metric representing interest earned minus interest expended—stood at ₹2,695.50 crore, marking an 18.00% growth YoY.
Asset quality indicators remained well-managed despite broader macroeconomic pressure in retail micro-lending. Gross Non-Performing Assets (GNPA) as a percentage of gross advances improved by 37 basis points YoY to 2.10% (compared to 2.47% in Q1 FY26). Net Non-Performing Assets (NNPA) dropped to 0.76% from 0.88% in the prior year.
Alongside earnings, the Bank announced significant corporate developments: the elevation of Chief Operating Officer Mr. Yogesh Jain to Deputy CEO, and a regulatory update confirming that the Bank has formally submitted its application for a final Universal Banking License with the Reserve Bank of India (RBI) in March 2026.
Executive Summary & Strategic Overview
AU Small Finance Bank Limited (NSE: AUBANK / BSE: 540611) released its earnings report for the first quarter ending June 30, 2026 (Q1 FY27). The institution posted a strong financial performance across key operating lines, driven by steady expansion in its loan book, expanding interest income, and effective cost management.
Net profit after tax (PAT) reached ₹795.95 crore, registering a significant 37.03% increase over the ₹580.86 crore generated in Q1 FY26. On a sequential (quarter-on-quarter) basis, net profit saw a modest decline of 4.32% from ₹831.87 crore in Q4 FY26, reflecting seasonal trends typically witnessed during the first quarter of the Indian banking cycle.
  +-----------------------------------------------------------------------+
  |                     AU BANK Q1 FY27 AT A GLANCE                       |
  +-----------------------------------------------------------------------+
  |  Total Income   :  ₹5,991.96 Cr   (+15.47% YoY)                       |
  |  Net Profit     :  ₹795.95 Cr     (+37.03% YoY)                       |
  |  NII            :  ₹2,695.50 Cr   (+18.00% YoY)                       |
  |  Gross NPA %    :  2.10%          (Improved by 37 bps YoY)            |
  |  Net NPA %      :  0.76%          (Improved by 12 bps YoY)            |
  |  Capital Ratio  :  18.93%         (CAR compliant with RBI standards)  |
  +-----------------------------------------------------------------------+
Detailed Financial Performance
Income Statement Analysis
The income statement reflects consistent momentum across interest-earning activities. Total Interest Earned for Q1 FY27 expanded to ₹5,302.74 crore, compared to ₹4,378.44 crore in Q1 FY26—a top-line growth of 21.11% YoY.
Interest/Discount on Advances: Increased to ₹4,510.48 crore from ₹3,664.92 crore in Q1 FY26 (up 23.07% YoY).
Income on Investments: Extended to ₹750.60 crore, up 16.38% YoY from ₹644.96 crore in Q1 FY26.
Interest Expended: Total interest expense incurred on customer deposits and interbank borrowings stood at ₹2,607.24 crore against ₹2,333.77 crore in Q1 FY26 (an increase of 11.72% YoY).
Chart Suggestion — Revenue & Interest Trend: A dual-axis line-and-bar chart showing Total Income, Interest Earned, and Interest Expended across Q1 FY26, Q4 FY26, and Q1 FY27 to illustrate top-line acceleration.
Income Statement Summary (₹ in Crore)
=============================================================================
Metric                       Q1 FY27        Q4 FY26        Q1 FY25    YoY (%)
-----------------------------------------------------------------------------
Interest Earned             5,302.74       5,019.15       4,378.44    +21.11%
Interest Expended           2,607.24       2,436.82       2,333.77    +11.72%
Net Interest Income (NII)   2,695.50       2,582.33       2,044.67    +31.83%
Other Income                  689.22         730.95         810.61    -14.98%
Operating Expenses          1,949.24       1,961.76       1,543.07    +26.32%
Operating Profit            1,435.47       1,351.52       1,312.21     +9.39%
Provisions (excl. Tax)        371.49         269.43         533.31    -30.34%
Net Profit (PAT)              795.95         831.87         580.86    +37.03%
=============================================================================
(Source: Official SEC/BSE Stock Exchange Disclosures of AU Small Finance Bank Ltd.)
Non-Interest Income & Operating Expenses
Non-interest income (classified as Other Income) stood at ₹689.22 crore in Q1 FY27 compared to ₹810.61 crore in Q1 FY26 and ₹730.95 crore in Q4 FY26. Other income encompasses revenue generated from processing fees, cross-selling third-party products (insurance and mutual funds), income from Priority Sector Lending Certificates (PSLC), and gain/loss on investment revaluations.
Total Operating Expenses (Opex) rose to ₹1,949.24 crore in Q1 FY27 from ₹1,543.07 crore in the year-ago period:
Employee Costs: Reached ₹1,063.92 crore (up 22.92% YoY from ₹865.53 crore) due to branch additions and headcount expansion.
Other Operating Expenses: Rose to ₹885.32 crore from ₹677.54 crore in Q1 FY26, driven by technological infrastructure investments and administrative overheads.
Despite higher absolute operating spend, Operating Profit before Provisions and Contingencies rose 9.39% YoY to ₹1,435.47 crore.
Asset Quality, Provisions & Credit Costs
Asset quality remains a core benchmark for evaluating banking stability. AU Small Finance Bank maintained solid control over its non-performing assets during the quarter.
Gross NPA (GNPA): Absolute Gross NPAs were recorded at ₹2,948.19 crore, representing 2.10% of gross advances. This reflects a significant structural improvement of 37 basis points from the 2.47% recorded in Q1 FY26.
Net NPA (NNPA): Absolute Net NPAs stood at ₹1,059.62 crore, translating to an NNPA ratio of 0.76%, down from 0.88% in Q1 FY26.
Provisions & Contingencies: Provisions (other than tax) stood at ₹371.49 crore in Q1 FY27, reflecting a sharp reduction of 30.34% YoY compared to ₹533.31 crore allocated during Q1 FY26. Sequentially, provisions increased from ₹269.43 crore in Q4 FY26, adhering to prudential norms.
Asset Quality Metrics
=============================================================================
Metric                       Q1 FY27        Q4 FY26        Q1 FY26     Change
-----------------------------------------------------------------------------
Gross NPA (₹ Cr)            2,948.19       2,755.64       2,751.32    +7.15% YoY
Net NPA (₹ Cr)              1,059.62         989.90         971.34    +9.09% YoY
Gross NPA (%)                  2.10%          2.03%          2.47%    -37 bps YoY
Net NPA (%)                    0.76%          0.74%          0.88%    -12 bps YoY
=============================================================================
(Source: AU Small Finance Bank Unaudited Results)
Chart Suggestion — Asset Quality Trend: A grouped bar chart tracking GNPA (%) and NNPA (%) across five consecutive quarters to demonstrate asset quality stability.
Segment-Wise Performance
AU Small Finance Bank operates across distinct primary business reporting segments in accordance with RBI guidelines and Accounting Standard 17 (AS-17):
Retail Banking: Remains the predominant growth engine. Segment revenue expanded to ₹4,450.31 crore in Q1 FY27, compared to ₹3,651.89 crore in Q1 FY26 (up 21.86% YoY). Retail Banking segment results (profit before tax) grew sharply to ₹664.25 crore from ₹270.21 crore in Q1 FY26. Total retail assets grew to ₹1,19,367.70 crore.
Wholesale Banking: Caters to commercial banking, enterprise relationships, and corporate clients. Revenue grew to ₹647.10 crore in Q1 FY27 against ₹479.50 crore in Q1 FY26 (up 34.95% YoY). Segment results rose to ₹208.24 crore. Total wholesale segment assets expanded to ₹23,354.68 crore.
Treasury Operations: Segment revenue registered ₹801.06 crore against ₹980.24 crore in Q1 FY26. Treasury segment results contributed ₹108.66 crore to profit before tax. Total treasury assets stood at ₹49,718.43 crore.
Segment Performance Breakdown (Q1 FY27)
=============================================================================
Segment             Revenue (₹ Cr)    PBT Results (₹ Cr)    Segment Assets (₹ Cr)
-----------------------------------------------------------------------------
Retail Banking         4,450.31            664.25               1,19,367.70
Wholesale Banking        647.10            208.24                 23,354.68
Treasury Operations      801.06            108.66                 49,718.43
Other Operations          93.49              82.83                      35.32
-----------------------------------------------------------------------------
Total                  5,991.96          1,063.99               1,97,125.18
=============================================================================
(Source: AU Small Finance Bank Segment Reporting)
Governance & Strategic Updates
Executive Leadership Elevation
Pursuant to recommendations by the Nomination and Remuneration Committee, the Board of Directors approved the elevation of Mr. Yogesh Jain to Deputy CEO effective July 25, 2026.
Mr. Jain, a Chartered Accountant with over two decades of financial sector experience and 16 years at AU, previously served as Chief Operating Officer. In his expanded role reporting to the MD & CEO, he will lead key enterprise initiatives, managing technology, digital banking platforms, credit cards, and unsecured lending portfolios. Additionally, Mr. Yogesh Soni (Head of Operations & Customer Service) was formally categorized as Senior Management Personnel (SMP).
Universal Banking License Application
The Bank updated shareholders on its trajectory toward becoming a full-fledged Universal Bank. Following the Reserve Bank of India’s in-principle approval granted on August 7, 2025, the RBI issued a clarification letter in March 2026 modifying holding structure requirements.
The Bank formally submitted its final application for a Universal Banking License during March 2026. Final issuance remains subject to regulatory review and ongoing compliance evaluations by the RBI.
Data Tables
Executive Highlights Table
(All figures in ₹ Crore, except per share data and percentages)
| Financial Indicator | Q1 FY27 | Q1 FY26 | YoY Change (%) / Bps |
| Total Income | 5,991.96 | 5,189.05 | +15.47% |
| Interest Earned | 5,302.74 | 4,378.44 | +21.11% |
| Interest Expended | 2,607.24 | 2,333.77 | +11.72% |
| Net Interest Income (NII) | 2,695.50 | 2,044.67 | +31.83% |
| Other Income | 689.22 | 810.61 | -14.98% |
| Operating Expenses | 1,949.24 | 1,543.07 | +26.32% |
| Operating Profit | 1,435.47 | 1,312.21 | +9.39% |
| Provisions (excl. Tax) | 371.49 | 533.31 | -30.34% |
| Profit Before Tax (PBT) | 1,063.99 | 778.90 | +36.60% |
| Net Profit (PAT) | 795.95 | 580.86 | +37.03% |
| Basic EPS (₹) | 10.63 | 7.80 | +36.28% |
| Diluted EPS (₹) | 10.51 | 7.78 | +35.09% |
| Gross NPA (%) | 2.10% | 2.47% | -37 bps |
| Net NPA (%) | 0.76% | 0.88% | -12 bps |
| Capital Adequacy Ratio (CAR) | 18.93% | 19.42% | -49 bps |
Quarter-on-Quarter (QoQ) & Year-on-Year (YoY) Comparison Table
| Metric | Q1 FY27 | Q4 FY26 | Q1 FY26 | QoQ (%) | YoY (%) |
| Interest Earned | 5,302.74 | 5,019.15 | 4,378.44 | +5.65% | +21.11% |
| Interest Expended | 2,607.24 | 2,436.82 | 2,333.77 | +6.99% | +11.72% |
| Net Interest Income | 2,695.50 | 2,582.33 | 2,044.67 | +4.38% | +31.83% |
| Other Income | 689.22 | 730.95 | 810.61 | -5.71% | -14.98% |
| Employee Expenses | 1,063.92 | 1,044.91 | 865.53 | +1.82% | +22.92% |
| Total Expenses | 4,556.48 | 4,398.58 | 3,876.84 | +3.59% | +17.53% |
| Operating Profit | 1,435.47 | 1,351.52 | 1,312.21 | +6.21% | +9.39% |
| Provisions | 371.49 | 269.43 | 533.31 | +37.88% | -30.34% |
| Tax Expense | 268.03 | 250.21 | 198.05 | +7.12% | +35.33% |
| PAT | 795.95 | 831.87 | 580.86 | -4.32% | +37.03% |
Important Ratios & Indicators Table
| Key Financial Ratio | Q1 FY27 | Q4 FY26 | Q1 FY26 |
| Capital Adequacy Ratio (CAR) | 18.93% | 18.68% | 19.42% |
| Gross NPA Ratio | 2.10% | 2.03% | 2.47% |
| Net NPA Ratio | 0.76% | 0.74% | 0.88% |
| Debt-Equity Ratio | 0.40 | 0.31 | 0.28 |
| Total Debts to Total Assets | 6.81% | 7.23% | 6.62% |
| Net Worth (₹ in Lakh) | 20,52,031.68 | 19,62,694.85 | 17,43,653.06 |
| Paid-up Share Capital (₹ in Lakh) | 74,897.20 | 74,826.71 | 74,519.30 |
Peer Comparison Matrix (Small Finance Banking Sector)
| Metric / Parameter | AU Small Finance Bank | Equitas SFB | Ujjivan SFB | ESAF SFB |
| Net Profit Q1 FY27 | ₹795.95 Cr | Data Not Available | Data Not Available | Data Not Available |
| Gross NPA (%) | 2.10% | Data Not Available | Data Not Available | Data Not Available |
| Net NPA (%) | 0.76% | Data Not Available | Data Not Available | Data Not Available |
| Capital Adequacy (CAR) | 18.93% | Data Not Available | Data Not Available | Data Not Available |
| Universal Bank Transition Status | Final Application Submitted | Eligible / Evaluation Phase | Under Evaluation | SFB Framework |
Strategic SWOT Analysis
  +-----------------------------------------------------------------------+
  |                          SWOT MATRIX                                  |
  +-----------------------------------------------------------------------+
  | STRENGTHS                             | WEAKNESSES                    |
  | • Strong YoY profit growth (+37%)     | • Opex remains elevated       |
  | • Improving Gross NPA ratio (2.10%)   | • Moderate sequential PAT dip |
  | • Strong capital cushion (CAR 18.93%) | • Non-interest income decline |
  +---------------------------------------+-------------------------------|
  | OPPORTUNITIES                         | THREATS                       |
  | • Universal Banking conversion        | • Macro interest rate volatility|
  | • Credit card & digital expansion     | • Deposit mobilization costs  |
  | • Geographical footprint expansion    | • Unsecured loan defaults     |
  +-----------------------------------------------------------------------+
Strengths
Strong Earnings Growth: Achieved 37.03% YoY expansion in net profit despite competitive banking dynamics.
Improving Asset Quality: Gross NPA improved by 37 bps YoY to 2.10%, indicating stable credit underwriting standards.
Capital Buffers: Total Capital Adequacy Ratio of 18.93% provides adequate capacity to support near-term balance sheet expansion.
Weaknesses
Cost-to-Income Overhead: Operating expenses grew 26.32% YoY due to ongoing digital investments and branch network expansion.
Non-Interest Income Volatility: Other income contracted 14.98% YoY to ₹689.22 crore due to lower fee generation and treasury fluctuations.
Opportunities
Universal Banking Conversion: Formal approval for a Universal Banking license will lower cost-of-funds and broaden institutional product offerings.
Retail Digital Footprint: Expanding digital channels, credit cards, and wealth management services increases fee income diversity.
Threats
Systemic Rate Sensitivities: Tight liquidity conditions in the broader Indian banking system could elevate deposit borrowing costs.
Unsecured Segment Stress: Potential macro stress in retail micro-borrower segments could demand additional credit provisions.
Comprehensive Risk Analysis
+-----------------------------------------------------------------------------+
|                               RISK MATRIX                                   |
+--------------------+----------------+-----------------+----------------------+
| Risk Category      | Threat Level   | Primary Impact  | Mitigation Strategy  |
+--------------------+----------------+-----------------+----------------------+
| Credit Risk        | Moderate       | Slippages/NPAs  | Secured lending focus|
| Liquidity Risk     | Low-Moderate   | Funding Costs   | Retail CASA expansion|
| Regulatory Risk    | Low            | Compliance Costs| License transition   |
| Competition Risk   | Moderate-High  | Margin Compression| Tech differentiation |
+--------------------+----------------+-----------------+----------------------+
Credit Risk: Exposure to small business loans and micro-enterprises leaves the bank vulnerable to local macroeconomic slowdowns. Mitigation: AU Bank maintains high coverage and focuses on collateralized vehicle and home loans.
Liquidity & Interest Rate Risk: Fluctuations in systemic interest rates can impact Net Interest Margins (NIM) if deposit re-pricing lags loan yields. Mitigation: Active asset-liability management (ALM) and continuous retail deposit mobilization.
Regulatory Transition Risk: Upgrading operational and compliance architectures to universal banking standards involves transitional costs. Mitigation: Proactive structural adjustments under RBI supervision.
Valuation Analysis
Valuation & Operational Ratios
=============================================================================
Metric                                     Q1 FY27                Q1 FY26
-----------------------------------------------------------------------------
Basic EPS (Annualized/Quarterly)           ₹10.63                 ₹7.80
Diluted EPS                                ₹10.51                 ₹7.78
Book Value per Share (Approx.)             ₹274.00                ₹234.00
Net Worth                                  ₹20,520 Cr             ₹17,437 Cr
Capital Adequacy Ratio (CAR)               18.93%                 19.42%
=============================================================================
(Source: Financial Statements filings with NSE/BSE)
AU Small Finance Bank continues to command a premium valuation relative to pure-play small finance bank peers, driven by its asset quality management, strong ROA profile, and impending universal banking transition.
Investment Thesis & Perspective
Short-Term Outlook (1–3 Quarters)
In the near term, financial performance is expected to remain steady, supported by strong Net Interest Income growth (+31.83% YoY) and reduced credit provisions (-30.34% YoY). Investors should monitor seasonal asset quality fluctuations in Q2 and operating expense trends.
Long-Term Outlook (3–5 Years)
The long-term thesis hinges on the successful transition from a Small Finance Bank to a full Universal Bank. This structural shift will eliminate SFB-specific regulatory restrictions, lower long-term borrowing costs, expand institutional deposit gathering, and support valuation multiple expansion.
Investor Decision Framework
Core Long-Term Investors: Accumulate / Hold — The bank’s consistent execution, leadership stability, and universal bank milestone position it well for long-term growth.
Tactical Traders: Watch Key Levels — Post-earnings price action will depend on how the market digests sequential net profit trends versus strong YoY operational momentum.
Final Conclusion
AU Small Finance Bank’s Q1 FY27 earnings report highlights consistent core operating performance, improving credit metrics, and steady progress toward its long-term corporate ambitions. With Net Profit expanding 37% YoY to ₹795.95 crore, Gross NPAs declining to 2.10%, and the formal application for a Universal Banking License submitted to the RBI, the institution remains well-positioned within the Indian banking ecosystem. Investors should monitor near-term margin dynamics and operating cost trajectories while keeping an eye on regulatory progress regarding its universal bank transition.
Disclaimer: This article is for educational and informational purposes only and should not be construed as financial or investment advice. Readers are advised to consult a certified financial advisor before making any investment decisions.



