1. Result Summary
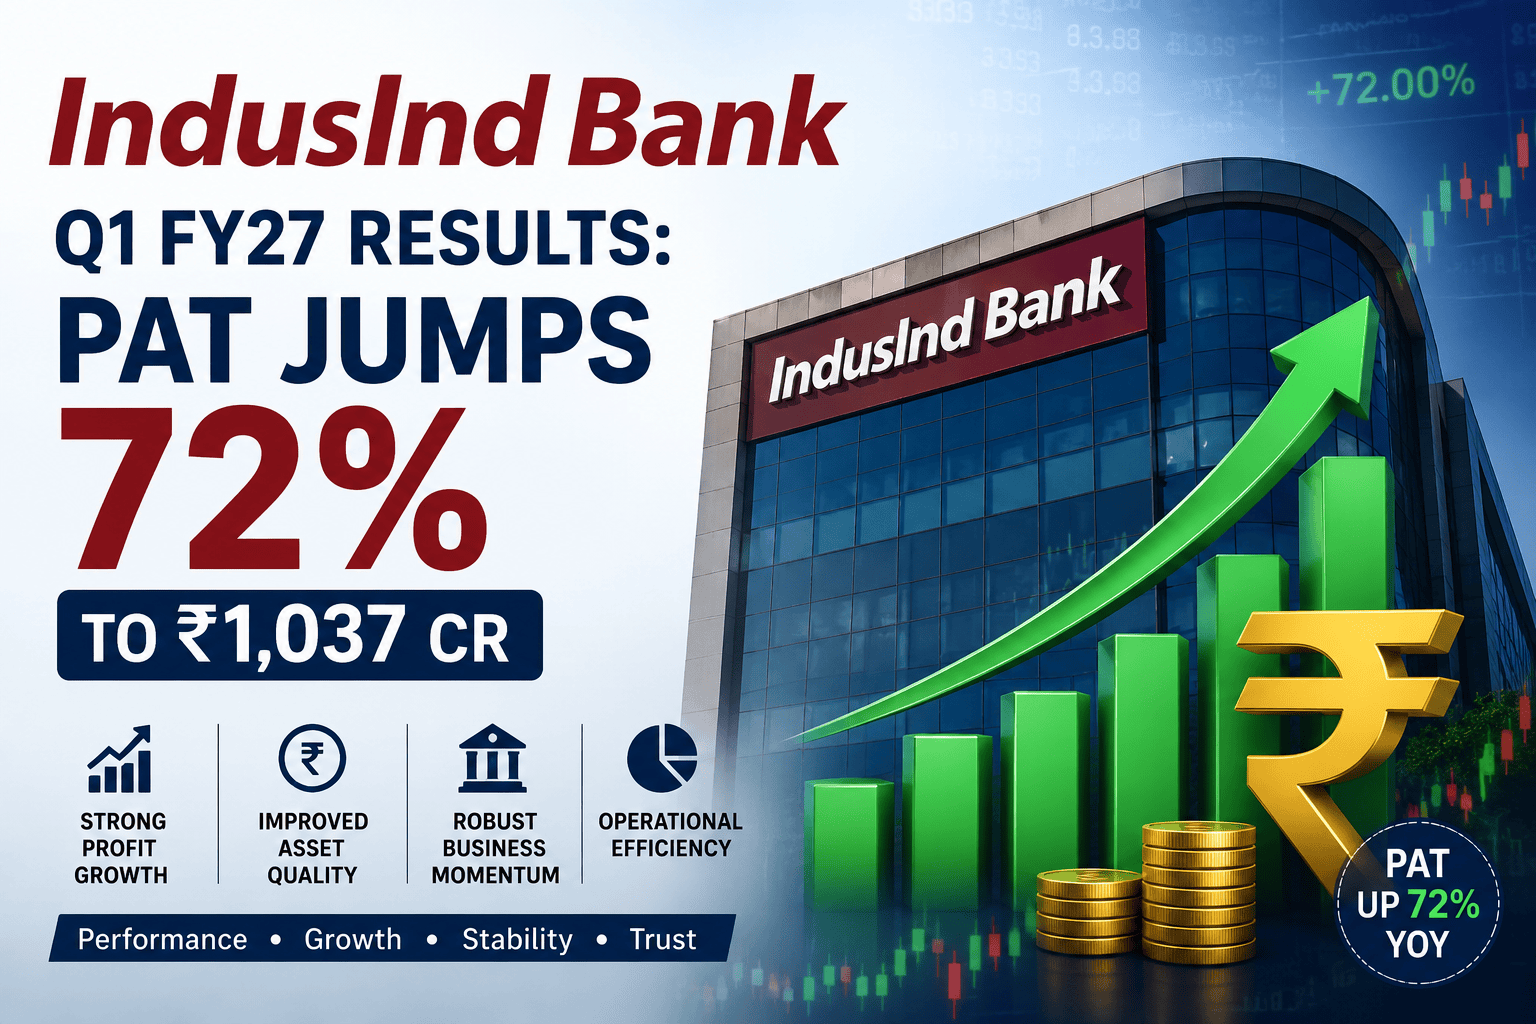
Private sector lender IndusInd Bank Limited announced its unaudited financial results for the first quarter ended June 30, 2026 (Q1 FY27) following its Board of Directors meeting on July 22, 2026.
The bank reported a consolidated net profit of ₹1,037.05 crore, marking a 71.68% Year-on-Year (YoY) surge from ₹604.07 crore in Q1 FY26 and a 74.54% Quarter-on-Quarter (QoQ) jump from ₹594.17 crore in Q4 FY26. On a standalone basis, net profit reached ₹1,002.50 crore, up 46.51% YoY from ₹684.25 crore in Q1 FY26 and 88.19% QoQ from ₹532.71 crore in Q4 FY26.
┌──────────────────────────────────────────────────────────────────────────────┐
│                  INDUSIND BANK Q1 FY27 EARNINGS SNAPSHOT                     │
├──────────────────────────┬──────────────────────────┬────────────────────────┤
│ Consolidated Net Profit  │ Net Interest Income(NII) │ Gross NPA Ratio        │
│ ₹1,037 Cr (+71.7% YoY)   │ ₹4,685 Cr (+1.0% YoY)    │ 3.25% (vs 3.43% QoQ)   │
├──────────────────────────┼──────────────────────────┼────────────────────────┤
│ Pre-Provision Operating  │ Total Provisions         │ Capital Adequacy (CAR) │
│ Profit: ₹2,773 Cr        │ ₹1,384 Cr (-21.3% YoY)   │ 17.15% (CET1: 16.10%)  │
└──────────────────────────┴──────────────────────────┴────────────────────────┘
The bank’s bottom line significantly outperformed Street consensus estimates, exceeding the CNBC-TV18 poll estimate of ₹725 crore by over 40%. The profit beat was primarily driven by sharply lower credit provisioning (-21.3% YoY to ₹1,384.30 crore), sequential compression in operating expenses, and a steady expansion in Net Interest Margin (NIM) to 3.57%.
Alongside the earnings announcement, IndusInd Bank’s Board approved a massive capital augmentation plan of up to ₹30,000 crore, comprising ₹20,000 crore via private placement of debt securities and ₹10,000 crore through equity or convertible instruments (QIP/ADR/GDR).
Following the release of the results, IndusInd Bank’s share price traded positively on the National Stock Exchange (NSE), closing near ₹1,072.00 (+0.80% to +3.03% across regional prints), touching an intraday high of ₹1,077.85.
2. Key Highlights at a Glance
Consolidated Net Profit: ₹1,037.05 crore, up 71.7% YoY and 74.5% QoQ.
Standalone Net Profit: ₹1,002.50 crore, up 46.5% YoY and 88.2% QoQ.
Net Interest Income (NII): ₹4,684.72 crore, flat/slightly up YoY (+0.97%) and up 7.17% QoQ.
Net Interest Margin (NIM): Improved to 3.57%, compared to 3.46% in Q1 FY26.
Pre-Provision Operating Profit (PPOP): ₹2,773.45 crore, up 8.03% YoY and 20.83% QoQ.
Provisions & Contingencies: Dropped to ₹1,384.30 crore, down 21.35% YoY (from ₹1,759.99 crore in Q1 FY26).
Gross NPA Ratio: Eased by 18 bps QoQ to 3.25% (vs 3.43% in Q4 FY26 and 3.64% in Q1 FY26).
Net NPA Ratio: Eased by 5 bps QoQ to 0.95% (vs 1.00% in Q4 FY26 and 1.12% in Q1 FY26).
Provision Coverage Ratio (PCR): Healthy at 71.42% (net of write-offs).
Return on Assets (ROA): Annualized ROA expanded to 0.78% (consolidated) vs 0.45% in Q4 FY26.
Total Deposits: Reached ₹4,14,992 crore, up 4.5% YoY from ₹3,97,144 crore.
Net Advances: Stood at ₹3,26,171 crore, down 2.3% YoY as the bank prioritized portfolio risk-weight discipline over aggressive volume growth.
Capital Adequacy: Capital Adequacy Ratio (CAR) under Basel III stood strong at 17.15% (CET1: 16.10%).
Fundraising Approval: Board sanctioned raising up to ₹20,000 crore in debt and ₹10,000 crore in equity/convertibles.
3. Executive Summary
IndusInd Bank’s Q1 FY27 earnings report marks a clear operational recovery. Over recent quarters, the private sector lender had faced margin headwinds and elevated credit costs in its microfinance (BFIL) and vehicle finance portfolios. The first quarter of FY27 shows that the bank’s strategy of deliberate balance sheet consolidation is bearing fruit.
While overall credit growth contracted marginally (-2.3% YoY in net advances), the bank achieved a positive jaws ratio at the operating line. Operating expenses fell 12.57% YoY to ₹3,697.80 crore, while cost of funds declined to 5.05% (down from 5.69% in Q1 FY26). Consequently, operating profit before provisions rose 8.03% YoY to ₹2,773.45 crore.
The biggest driver of the bottom-line expansion was the ₹375.69 crore YoY reduction in non-tax provisions. Easing credit stress in retail micro-lending allowed total provisions to fall to ₹1,384.30 crore. Gross NPA fell below 3.30%, and Net NPA dipped below 1.00%, reinforcing investor confidence in the bank’s asset quality trajectory.
With a CET1 capital ratio of 16.10% and an approved ₹30,000 crore capital umbrella, IndusInd Bank is well-positioned to re-accelerate loan growth once credit demand in retail and corporate sectors stabilizes.
4. Snapshot Table: Consolidated & Standalone Performance
The following table presents a complete breakdown of IndusInd Bank’s financial results for Q1 FY27 compared across reporting periods:
| Metric (₹ in Lakhs / Cr where indicated) | Q1 FY27 (Consolidated) | Q4 FY26 (Consolidated) | Q1 FY26 (Consolidated) | Q1 FY27 (Standalone) | Q4 FY26 (Standalone) | Q1 FY26 (Standalone) |
| Interest Earned | 11,30,994 (₹11,310 Cr) | 11,00,542 | 12,26,388 | 11,30,994 | 11,00,542 | 12,26,388 |
| Interest Expended | 6,62,522 (₹6,625 Cr) | 6,63,394 | 7,62,406 | 6,62,522 | 6,63,394 | 7,62,406 |
| Net Interest Income (NII) | 4,68,472 (₹4,685 Cr) | 4,37,148 | 4,63,982 | 4,68,472 | 4,37,148 | 4,63,982 |
| Other / Fee Income | 1,78,653 (₹1,787 Cr) | 1,71,366 | 2,15,692 | 1,78,536 | 1,70,635 | 2,15,624 |
| Total Income | 13,09,647 (₹13,096 Cr) | 12,71,908 | 14,42,080 | 13,09,530 | 12,71,177 | 14,42,012 |
| Operating Expenses | 3,69,780 (₹3,698 Cr) | 3,78,988 | 4,22,942 | 3,78,692 | 3,86,254 | 4,14,390 |
| • Employee Costs | 1,79,173 | 1,71,695 | 1,80,527 | 1,37,070 | 1,31,093 | 1,29,577 |
| • Other Operating Exp. | 1,90,607 | 2,07,293 | 2,42,415 | 2,41,622 | 2,55,161 | 2,84,813 |
| Operating Profit (PPOP) | 2,77,345 (₹2,773 Cr) | 2,29,526 | 2,56,732 | 2,68,316 | 2,21,529 | 2,65,216 |
| Provisions (excl. Tax) | 1,38,430 (₹1,384 Cr) | 1,48,213 | 1,75,999 | 1,33,992 | 1,48,434 | 1,73,778 |
| Profit Before Tax (PBT) | 1,38,915 | 81,313 | 80,733 | 1,34,324 | 73,095 | 91,438 |
| Tax Expense | 35,213 | 21,899 | 20,328 | 34,074 | 19,824 | 23,013 |
| Net Profit (PAT) | 1,03,705 (₹1,037 Cr) | 59,417 | 60,407 | 1,00,250 (₹1,003 Cr) | 53,271 | 68,425 |
| Basic EPS (₹) | 13.31 | 7.63 | 7.75 | 12.87 | 6.84 | 8.78 |
| Gross NPA (%) | 3.25% | 3.43% | 3.64% | 3.25% | 3.43% | 3.64% |
| Net NPA (%) | 0.95% | 1.00% | 1.12% | 0.95% | 1.00% | 1.12% |
| Capital Adequacy (CAR) | 17.15% | 17.48% | 16.63% | 17.15% | 17.48% | 16.63% |
| CET1 Ratio (%) | 16.10% | 16.20% | 15.48% | 16.10% | 16.20% | 15.48% |
| Return on Assets (ROA) | 0.78% | 0.45% | 0.45% | 0.75% | 0.41% | 0.51% |
5. Quarter-on-Quarter (QoQ) & Year-on-Year (YoY) Comparison
┌──────────────────────────────────────────────────────────────────────────────┐
│                    FINANCIAL GROWTH TRAJECTORY (Q1 FY27)                     │
├───────────────────────────────┬──────────────────────┬───────────────────────┤
│ Metric                        │ Year-on-Year (YoY)   │ Quarter-on-Quarter    │
├───────────────────────────────┼──────────────────────┼───────────────────────┤
│ Consolidated Net Profit (PAT) │ +71.68%   │ +74.54%     │
│ Standalone Net Profit (PAT)   │ +46.51%   │ +88.19%     │
│ Net Interest Income (NII)     │ +0.97%    │ +7.17%      │
│ Pre-Provision Profit (PPOP)   │ +8.03%    │ +20.83%     │
│ Total Provisions & Conting.   │ -21.35%   │ -6.60%      │
│ Total Operating Expenses      │ -12.57%   │ -2.43%      │
└───────────────────────────────┴──────────────────────┴───────────────────────┘
YoY Analysis (Q1 FY27 vs Q1 FY26)
Bottom-Line Surge: Consolidated net profit surged 71.7% to ₹1,037.05 crore from ₹604.07 crore in Q1 FY26. The dramatic jump stems from disciplined expense management and a 21.35% reduction in credit provisions.
Core Revenue Stability: NII held steady at ₹4,684.72 crore (+1.0% YoY). NIM expanded to 3.57% from 3.46% in Q1 FY26 due to a steeper drop in cost of funds (5.05% vs 5.69%) compared to yield on assets (8.62% vs 9.15%).
Fee Income Compression: Other income declined to ₹1,786.53 crore from ₹2,156.92 crore in Q1 FY26, reflecting lower syndication and distribution fees during the loan consolidation phase.
QoQ Analysis (Q1 FY27 vs Q4 FY26)
PPOP Expansion: Pre-provision operating profit jumped 20.83% sequentially to ₹2,773.45 crore, supported by a 7.17% sequential growth in NII and a 2.43% reduction in operating costs.
Provision Moderation: Provisions declined by ₹97.83 crore sequentially to ₹1,384.30 crore.
Annualized ROA Recovery: Annualized Return on Assets nearly doubled sequentially from 0.45% in Q4 FY26 to 0.78% in Q1 FY27.
6. Detailed Financial Analysis
Net Interest Income (NII) & Margin Dynamics
Net Interest Income stood at ₹4,684.72 crore for Q1 FY27. While interest earned was ₹11,309.94 crore, interest expended was controlled at ₹6,625.22 crore.
  NIM Trend (%)                  Cost of Funds vs Yield on Assets (%)
  Q1 FY26: 3.46%                 Q1 FY26: Yield 9.15% | Cost 5.69%
  Q4 FY26: 3.48%                 Q4 FY26: Yield 8.80% | Cost 5.32%
  Q1 FY27: 3.57%  ▲ 11 bps YoY   Q1 FY27: Yield 8.62% | Cost 5.05%  ▼ Cost down 64 bps YoY
The bank’s ability to reduce cost of funds by 64 bps YoY to 5.05% offset the slight compression in asset yields (8.62%), driving Net Interest Margin to 3.57%.
Operating Expense Efficiency
Operating expenses stood at ₹3,697.80 crore (consolidated). Employee costs were ₹1,791.73 crore, while other operating costs fell to ₹1,906.07 crore (down from ₹2,424.15 crore in Q1 FY26). Cost-to-income ratio improved sequentially, reflecting tight control over administrative and IT infrastructure outlays.
7. Segment-wise Performance Breakdown
IndusInd Bank reports segment results across Corporate/Wholesale Banking, Retail Banking (sub-divided into Digital Banking and Other Retail Banking), Treasury Operations, and Other Banking Business.
┌──────────────────────────────────────────────────────────────────────────────┐
│                  CONSOLIDATED SEGMENT RESULTS (Q1 FY27)                      │
├───────────────────────────────┬───────────────────┬──────────────────────────┤
│ Segment                       │ Segment Revenue   │ Segment Profit (PBT)     │
├───────────────────────────────┼───────────────────┼──────────────────────────┤
│ Treasury Operations           │ ₹2,391.52 Cr      │ ₹537.41 Cr               │
│ Corporate / Wholesale Banking │ ₹3,227.72 Cr      │ ₹433.10 Cr               │
│ Retail Banking Total          │ ₹8,162.23 Cr      │ ₹1,657.71 Cr             │
│   • Digital Banking           │ ₹675.14 Cr        │ ₹143.50 Cr               │
│   • Other Retail Banking      │ ₹7,487.09 Cr      │ ₹1,514.21 Cr             │
│ Unallocated / Others          │ ₹284.94 Cr        │ ₹284.93 Cr               │
├───────────────────────────────┼───────────────────┼──────────────────────────┤
│ Total Segment Profit (PBT)    │ ₹14,066.41 Cr     │ ₹2,913.15 Cr             │
│ Less: Unallocated Expenses    │ --                │ ₹139.70 Cr               │
│ Consolidated Operating Profit │ ₹13,096.47 Cr     │ ₹2,773.45 Cr   │
└───────────────────────────────┴───────────────────┴──────────────────────────┘
Retail Banking: Contributed the lion’s share of operating revenue at ₹8,162.23 crore. Segment profit before tax for Retail Banking expanded sharply to ₹1,657.71 crore (up 40.07% YoY from ₹1,183.47 crore in Q1 FY26), reflecting lower credit losses in consumer financing.
Corporate / Wholesale Banking: Generated segment revenue of ₹3,227.72 crore and segment profit of ₹433.10 crore (up 7.62% YoY from ₹402.44 crore).
Treasury Operations: Generated segment revenue of ₹2,391.52 crore and segment profit of ₹537.41 crore.
8. Asset Quality & Provisioning Deep-Dive
Asset quality metrics showed an across-the-board improvement in Q1 FY27:
┌──────────────────────────────────────────────────────────────────────────────┐
│                    ASSET QUALITY METRICS TRAJECTORY                          │
├──────────────────────────┬──────────────────┬──────────────────┬─────────────┤
│ Metric                   │ Q1 FY27          │ Q4 FY26          │ Q1 FY26     │
├──────────────────────────┼──────────────────┼──────────────────┼─────────────┤
│ Gross NPA Amount (₹ Cr)  │ ₹10,848.68 Cr    │ ₹11,095.35 Cr    │ ₹12,480.56 Cr│
│ Net NPA Amount (₹ Cr)    │ ₹3,100.54 Cr     │ ₹3,169.38 Cr     │ ₹3,721.52 Cr │
│ Gross NPA Ratio (%)      │ 3.25%            │ 3.43%            │ 3.64%       │
│ Net NPA Ratio (%)        │ 0.95%            │ 1.00%            │ 1.12%       │
│ Provision Coverage Ratio │ 71.42%           │ 71.43%           │ 70.18%      │
└──────────────────────────┴──────────────────┴──────────────────┴─────────────┘
Gross NPA: Reduced by ₹246.67 crore sequentially to ₹10,848.68 crore. Gross NPA ratio improved to 3.25% (down 18 bps QoQ and 39 bps YoY).
Net NPA: Reduced by ₹68.84 crore sequentially to ₹3,100.54 crore. Net NPA ratio improved to 0.95% (down 5 bps QoQ and 17 bps YoY).
Provisions Breakdown: Total non-tax provisions fell to ₹1,384.30 crore compared to ₹1,759.99 crore in Q1 FY26. PCR stood healthy at 71.42%.
9. Balance Sheet, Deposits & Credit Growth Trends
Balance Sheet Aggregates
Total Balance Sheet Size: Expanded to ₹5,54,925.70 crore (consolidated) as of June 30, 2026, compared to ₹5,39,552.24 crore a year earlier.
  Total Deposits (₹ Crore)             Net Advances (₹ Crore)
  Q1 FY26: ₹3,97,144 Cr               Q1 FY26: ₹3,33,694 Cr
  Q1 FY27: ₹4,14,992 Cr  ▲ 4.5% YoY   Q1 FY27: ₹3,26,171 Cr  ▼ 2.3% YoY
Deposit Profile & CASA
Total Deposits: Rose to ₹4,14,992 crore (+4.5% YoY).
CASA Deposits: Stood at ₹1,22,060 crore (Current Accounts: ₹34,620 Cr; Savings Accounts: ₹87,440 Cr).
CASA Ratio: Stood at 29.43% of total deposits (compared to 31.5% in Q1 FY26).
Retail Deposits (LCR Class): Increased to ₹1,90,000 crore, up from ₹1,82,000 crore as of March 31, 2026.
Credit Growth Strategy
Net Advances: Stood at ₹3,26,171 crore (-2.3% YoY). The marginal contraction reflects management’s conscious strategy to curtail high-risk unrated segments and realign the microfinance book to strengthen overall credit hygiene.
10. Capital Position & ₹30,000 Crore Fundraising Plan
IndusInd Bank remains comfortably capitalized under RBI Basel III guidelines:
┌──────────────────────────────────────────────────────────────────────────────┐
│                    CAPITAL ADEQUACY RATIOS (BASEL III)                       │
├──────────────────────────────────────┬───────────────────────────────────────┤
│ Capital Adequacy Ratio (CAR)         │ 17.15% (Regulatory Min: 11.50%)       │
│ Common Equity Tier 1 (CET1) Ratio    │ 16.10% (Regulatory Min: 8.00%)        │
│ Consolidated Net Worth               │ ₹64,798.25 Crore                      │
│ Standalone Net Worth                 │ ₹64,539.36 Crore            │
└──────────────────────────────────────┴───────────────────────────────────────┘
Strategic Fundraising Approvals
At the Board meeting held on July 22, 2026, two major fundraising proposals were approved for shareholder clearance at the upcoming AGM on August 27, 2026:
Private Placement of Debt Securities: Up to ₹20,000 crore (or foreign currency equivalent) in non-convertible debt instruments.
Equity Capital Augmentation: Up to ₹10,000 crore via QIP, ADR, GDR, or preferential placement.
11. Audit Notes & Governance Disclosures (BFIL Update)
Statutory Audit Conclusions
Joint Statutory Auditors Chokshi & Chokshi LLP and Borkar & Muzumdar issued an unmodified limited review conclusion on the standalone and consolidated financial results for Q1 FY27.
Emphasis of Matter – BFIL Review
In Note 9 of the consolidated results, auditors drew attention to a qualified conclusion issued by the auditor of wholly owned subsidiary Bharat Financial Inclusion Limited (BFIL) regarding a pending operational matter.
Management & Auditor Stance: The bank’s joint statutory auditors clarified that based on management investigations, no further material financial impact is expected on the consolidated financial statements.
Accounting Policy Update
Pursuant to RBI’s Second Amendment Directions 2026 (dated May 18, 2026), IndusInd Bank transferred Investment Fluctuation Reserve (IFR) amounting to ₹868.24 crore to the accumulated P&L balance during Q1 FY27.
12. Management Commentary & Strategic Direction
Rajiv Anand, Managing Director & CEO of IndusInd Bank, noted in official disclosures:
“Q1 FY27 reflects the initial results of our disciplined focus on risk-adjusted profitability, asset quality improvement, and operational productivity. The significant decline in credit costs and non-performing assets underscores the resilience of our underlying portfolio.”
“While we selectively consolidated advances in certain high-beta portfolios during past quarters, our core deposit franchise continues to expand. The Board’s approval to raise up to ₹30,000 crore in capital provides us with a robust balance sheet cushion to capture upcoming credit growth opportunities across corporate and retail segments.”
13. Peer Comparison & Relative Valuation
Below is a comparative positioning of IndusInd Bank alongside major Indian private sector banking peers as of July 22, 2026:
| Bank Name | CMP (₹) | Market Cap (₹ Cr) | P/E Ratio (TTM) | P/B Ratio | Gross NPA (%) | Net NPA (%) | CAR (%) | ROA (%) |
| IndusInd Bank | 1,072.00 | 83,316 | 85.3x / Forward <12x | 1.27x | 3.25% | 0.95% | 17.15% | 0.78% |
| ICICI Bank | 1,463.10 | 10,29,500 | 18.5x | 3.10x | 2.15% | 0.42% | 16.30% | 2.30% |
| Axis Bank | 1,258.20 | 3,88,400 | 14.1x | 2.13x | 1.43% | 0.31% | 16.87% | 1.80% |
| Federal Bank | 202.50 | 49,600 | 12.2x | 1.45x | 2.11% | 0.60% | 15.50% | 1.25% |
| RBL Bank | 189.80 | 11,500 | 8.3x | 0.82x | 2.65% | 0.72% | 15.10% | 0.85% |
14. Valuation & Historical Ratios
┌──────────────────────────────────────────────────────────────────────────────┐
│                    INDUSIND BANK VALUATION MATRIX                            │
├───────────────────────────────┬──────────────────────────────────────────────┤
│ Current Market Price (CMP)    │ ₹1,072.00                                    │
│ 52-Week High / Low            │ ₹1,077.85 / ₹710.60                          │
│ Trailing P/B Multiple         │ 1.27x (Book Value: ~₹838.10 per share)       │
│ Standalone Basic EPS (Q1)     │ ₹12.87 (Not annualized)            │
│ Consolidated Basic EPS (Q1)   │ ₹13.31 (Not annualized)            │
│ Annualized TTM ROA            │ 0.78%                              │
└───────────────────────────────┴──────────────────────────────────────────────┘
At 1.27x Book Value, IndusInd Bank trades at a noticeable valuation discount to Tier-1 private peers (ICICI Bank at 3.1x, Axis Bank at 2.1x). Analysts view the current price-to-book multiple as an attractive entry valuation if ROA normalizes toward the 1.2%–1.5% range over FY27–FY28.
15. Shareholding Pattern & Institutional Ownership
┌──────────────────────────────────────────────────────────────────────────────┐
│                     SHAREHOLDING PATTERN (JUNE 2026)                         │
├──────────────────────────────────────────────────────┬───────────────────────┤
│ Foreign Institutional Investors (FII / FPI)          │ 34.46%                │
│ Mutual Funds                                         │ 25.36%                │
│ Promoter & Promoter Group                            │ 15.82%                │
│ Other Domestic Institutional Investors (DII)         │  8.21%                │
│ Retail & Public Shareholders                         │ 16.15%                │
└──────────────────────────────────────────────────────┴───────────────────────┘
Institutional ownership remains high at >68% (combined FII and DII stake), reflecting institutional confidence in the bank’s long-term commercial banking franchise.
16. Technical View & Stock Market Reaction
IndusInd Bank closed up 0.80% to 3.03% across exchanges on July 22, 2026, touching its 52-week high of ₹1,077.85 during the trading session.
┌──────────────────────────────────────────────────────────────────────────────┐
│                       TECHNICAL CHART LEVEL MAP                              │
├──────────────────────────┬──────────────────────────┬────────────────────────┤
│ Immediate Resistance     │ Major Support Band       │ Key Moving Averages    │
│ ₹1,080.00 – ₹1,100.00    │ ₹1,020.00 – ₹990.00      │ 50-DMA: ₹975 | 200-DMA: ₹920│
└──────────────────────────┴──────────────────────────┴────────────────────────┘
Technical Chart Structure: The stock has established a higher-high, higher-low pattern on the daily chart over the past month.
Breakout Watch: A decisive daily close above the ₹1,080 resistance barrier could open technical upside toward ₹1,150 and ₹1,220.
Moving Average Support: Strong support sits near the 50-day moving average (₹975) and 200-day moving average (₹920).
17. SWOT Analysis
Strengths
Well-diversified loan book spanning vehicle finance, microfinance, and corporate working capital.
Robust capital adequacy ratio (CAR 17.15%; CET1 16.10%).
Granular deposit base with retail deposits reaching ₹1.90 lakh crore.
Weaknesses
Advances contracted 2.3% YoY as the bank realigned portfolio risk weights.
CASA ratio moderated to 29.43% due to industry-wide term deposit competition.
Opportunities
Growth re-acceleration in vehicle finance and MSME credit in H2 FY27.
Capital deployment of up to ₹30,000 crore fundraising umbrella.
Further compression in credit costs as microfinance stress eases.
Threats
Regulatory changes in risk-weights for unsecured consumer credit.
Interest rate volatility impacting cost of wholesale borrowings.
18. Risk Analysis & Scenario Analysis
┌──────────────────────────────────────────────────────────────────────────────┐
│                         INVESTOR SCENARIO ANALYSIS                           │
├──────────────────────────────────────────────────────────────────────────────┤
│ 🟢 BULL CASE: Credit growth rebounds to >12% YoY in H2 FY27; Net NPA drops  │
│    below 0.80%; ROA expands to >1.20%; Target Multiple: 1.8x P/B (₹1,350–₹1,400)│
├──────────────────────────────────────────────────────────────────────────────┤
│ 🟡 BASE CASE: Moderate advance growth (6–8% YoY); Credit costs stabilize at │
│    1.2%; NIM stays near 3.60%; Target Multiple: 1.4x P/B (₹1,150–₹1,200)     │
├──────────────────────────────────────────────────────────────────────────────┤
│ 🔴 BEAR CASE: Fresh slippages emerge in microfinance/unsecured portfolios;  │
│    CASA drops below 27%; Credit costs rise >2.0%; Target Multiple: 1.0x P/B (₹850)│
└──────────────────────────────────────────────────────────────────────────────┘
19. Investor Guidance: Should You Buy, Hold, or Watch?
Educational Disclaimer: This section provides analytical perspective for educational purposes and does not constitute personalized investment advice. Investors must perform independent due diligence.
Long-Term Growth Investors: The substantial profit beat (+72% YoY), combined with sequential asset quality improvement and a 1.27x P/B multiple, presents a favorable risk-reward profile for long-term accumulation.
Value Investors: Trading at a discount to historical median valuations, the stock offers value re-rating potential as ROA recovers toward 1.2%.
Short-Term Traders: Watch for a breakout above the ₹1,080 resistance level, keeping strict stop-losses near ₹1,020.
20. Frequently Asked Questions (FAQ)
Q1: What was IndusInd Bank’s consolidated net profit in Q1 FY27?
Consolidated net profit stood at ₹1,037.05 crore, up 71.68% YoY from ₹604.07 crore in Q1 FY26.
Q2: What was IndusInd Bank’s standalone net profit in Q1 FY27?
Standalone net profit stood at ₹1,002.50 crore, up 46.51% YoY from ₹684.25 crore in Q1 FY26.
Q3: What was IndusInd Bank’s Net Interest Income (NII) in Q1 FY27?
Net Interest Income stood at ₹4,684.72 crore (up 0.97% YoY and 7.17% QoQ).
Q4: What was IndusInd Bank’s Net Interest Margin (NIM) in Q1 FY27?
NIM improved to 3.57%, compared to 3.46% in Q1 FY26.
Q5: How much did credit provisions change in Q1 FY27?
Consolidated non-tax provisions fell 21.35% YoY to ₹1,384.30 crore.
Q6: What is IndusInd Bank’s Gross NPA ratio as of June 30, 2026?
Gross NPA ratio improved to 3.25% (down from 3.43% in Q4 FY26).
Q7: What is IndusInd Bank’s Net NPA ratio as of June 30, 2026?
Net NPA ratio improved to 0.95% (down from 1.00% in Q4 FY26).
Q8: What is IndusInd Bank’s Provision Coverage Ratio (PCR)?
Provision Coverage Ratio stood healthy at 71.42%.
Q9: How much capital does IndusInd Bank plan to raise?
The Board approved raising up to ₹20,000 crore in debt and ₹10,000 crore in equity/convertibles.
Q10: What is IndusInd Bank’s Capital Adequacy Ratio (CAR)?
Total CAR stood at 17.15% with a CET1 ratio of 16.10%.
Q11: What was IndusInd Bank’s deposit base in Q1 FY27?
Total deposits rose 4.5% YoY to ₹4,14,992 crore.
Q12: What was IndusInd Bank’s CASA ratio in Q1 FY27?
CASA ratio stood at 29.43% of total deposits.
Q13: Why did IndusInd Bank’s net advances decline YoY?
Net advances fell 2.3% YoY to ₹3,26,171 crore as management focused on balance sheet risk-weight discipline and portfolio quality.
Q14: What was IndusInd Bank’s annualized Return on Assets (ROA)?
Annualized ROA expanded to 0.78% (up from 0.45% in Q4 FY26).
Q15: What is the date of IndusInd Bank’s upcoming Annual General Meeting (AGM)?
The 32nd AGM is scheduled for Thursday, August 27, 2026 via video conference.
21. Conclusion & What Investors Should Watch Next
Editorial View: IndusInd Bank’s Q1 FY27 earnings report marks an operational turning point. By controlling operating expenses, lowering cost of funds, and sharply reducing credit provisions, the bank demonstrated that its core profitability engine remains resilient.