Executive Summary & Quick Takeaways
Aditya Birla Sun Life AMC Limited (ABSLAMC) declared its unaudited standalone and consolidated financial results for the first quarter ended June 30, 2026 (Q1 FY27) on July 21, 2026. The asset management major delivered steady top-line and bottom-line expansion on a year-on-year (YoY) basis, driven by market momentum, robust inflows, and institutional mandate expansion.
+-----------------------------------------------------------------------------------+
|                        Q1 FY27 FINANCIAL HIGHLIGHTS (CONSOLIDATED)               |
+-----------------------------------------------------------------------------------+
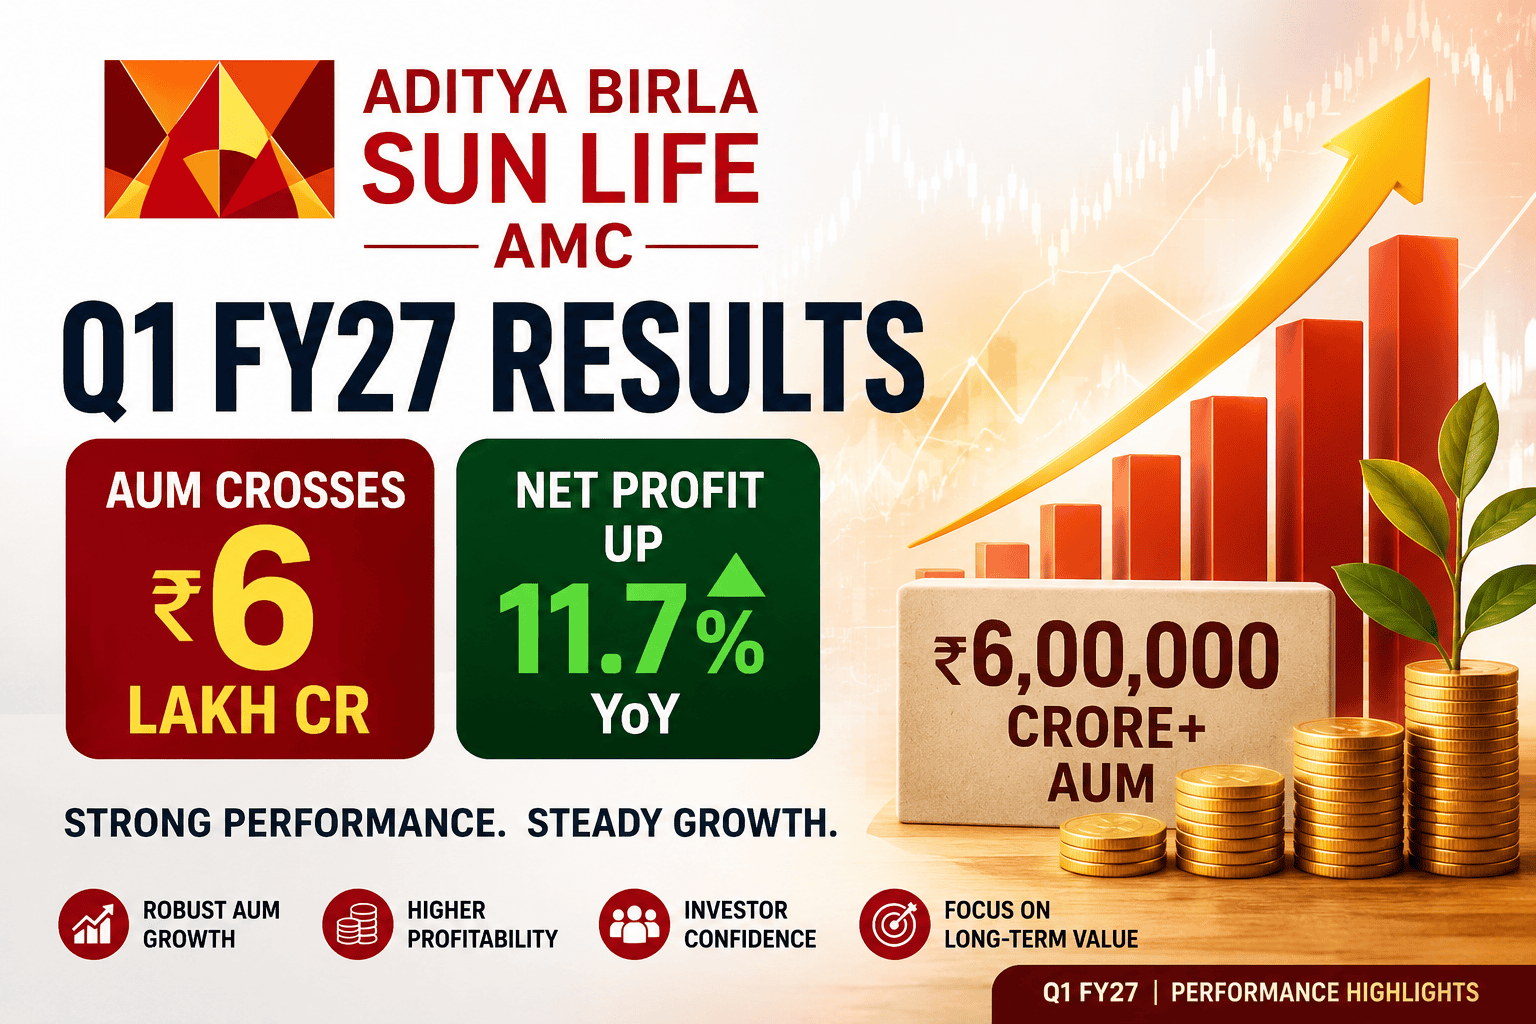
|  Consolidated Net Profit   :  ₹309.49 Cr  (▲ 11.69% YoY vs ₹277.11 Cr)             |
|  Consolidated Total Income :  ₹625.35 Cr  (▲ 10.63% YoY vs ₹565.27 Cr)             |
|  Revenue from Operations   :  ₹462.96 Cr  (▲  3.48% YoY vs ₹447.39 Cr)             |
|  Total Quarterly Average AUM:  ₹6,27,900 Cr (▲ 42.00% YoY crossing ₹6 Lakh Cr)    |
|  Standalone Net Profit     :  ₹311.38 Cr  (▲ 12.46% YoY vs ₹276.89 Cr)             |
+-----------------------------------------------------------------------------------+
5 Biggest Takeaways
AUM Benchmark: Total average AUM (including Alternate Assets and institutional mandates) reached a milestone of ₹6,27,900 crore (~₹6.28 lakh crore), up 42% YoY.
Double-Digit Profit Expansion: Consolidated net profit rose 11.69% YoY to ₹309.49 crore. Sequential profit jumped significantly from ₹187.11 crore in Q4 FY26, primarily aided by mark-to-market (MTM) gains in Other Income.
Core Operating Revenue: Revenue from operations grew 3.48% YoY to ₹462.96 crore. On a sequential quarter-on-quarter (QoQ) basis, core operational revenue grew 1.03% from ₹458.23 crore in Q4 FY26.
Expense Trends: Consolidated total expenses rose to ₹219.28 crore in Q1 FY27 from ₹192.99 crore in Q1 FY26, driven by higher employee costs (including ESOP charges) and operational technology costs.
Market Reaction: Despite positive YoY profit growth, stock prices faced selling pressure on the result day, closing down 6.53% at ₹1,045.60 on the NSE. Investors digested higher employee expense run-rates and yield compression concerns.
Company Overview
Aditya Birla Sun Life AMC Limited is a joint venture between Aditya Birla Capital Limited and Sun Life (India) AMC Investments Inc. Established as one of India’s premier non-bank backed asset managers, ABSLAMC serves as the investment manager to Aditya Birla Sun Life Mutual Fund.
+-----------------------------------------------------------------------------------+
|                            CORPORATE PROFILE & STRUCTURE                          |
+-----------------------------------------------------------------------------------+
|  Promoter Group         :  Aditya Birla Capital Ltd (62.5%)                       |
|                            Sun Life (India) AMC Investments Inc. (12.2%)          |
|  Combined Promoter Stake :  74.71%                                                |
|  Presence               :  310+ locations pan-India                               |
|  Investor Folios        :  ~11.1 Million Folios                                   |
|  Subsidiaries           :  Singapore, Dubai (DIFC), Mauritius, GIFT City (IFSC)    |
+-----------------------------------------------------------------------------------+
Business Model & Revenue Drivers
The primary business model of ABSLAMC centres on asset management services. Key revenue streams include:
Management Fees: Tiered Total Expense Ratio (TER) charged on Mutual Fund AUM (Equity, Hybrid, Debt, Passive).
Alternate Investment Solutions: Investment management and advisory fees from Portfolio Management Services (PMS), Alternative Investment Funds (AIF), and Real Estate funds.
Offshore & International Advisory: Services provided via overseas subsidiaries in Singapore, Dubai, Mauritius, and GIFT City.
Treasury & Other Income: Returns on corporate treasury deployments, seed investments in proprietary schemes, and mark-to-market gain/loss on investment portfolios.
Q1 FY27 Financial Performance Analysis
Consolidated Financial Results Comparison
| Financial Metric (in ₹ Crore) | Q1 FY27 (Unaudited) | Q4 FY26 (Audited) | Q1 FY26 (Unaudited) | YoY Change (%) | QoQ Change (%) |
| Revenue from Operations | 462.96 | 458.23 | 447.39 | +3.48% | +1.03% |
| Other Income | 162.39 | (32.86) | 117.88 | +37.76% | Turnaround |
| Total Income | 625.35 | 425.37 | 565.27 | +10.63% | +47.01% |
| Finance Costs | 1.13 | 1.18 | 1.31 | -13.74% | -4.24% |
| Employee Benefit Expense | 116.34 | 104.44 | 92.63 | +25.60% | +11.39% |
| Fees & Commission Expense | 15.36 | 15.57 | 13.47 | +14.03% | -1.35% |
| Depreciation & Amortisation | 12.82 | 12.98 | 10.27 | +24.83% | -1.23% |
| Other Expenses | 73.63 | 71.80 | 75.31 | -2.23% | +2.55% |
| Total Expenses | 219.28 | 205.97 | 192.99 | +13.62% | +6.46% |
| Profit Before Tax (PBT) | 406.07 | 219.40 | 372.28 | +9.08% | +85.08% |
| Current Tax | 74.46 | 71.92 | 80.29 | -7.26% | +3.53% |
| Deferred Tax | 22.12 | (39.63) | 14.88 | +48.66% | Turnaround |
| Total Tax Expense | 96.58 | 32.29 | 95.17 | +1.48% | +199.10% |
| Net Profit (PAT) | 309.49 | 187.11 | 277.11 | +11.69% | +65.41% |
| Basic EPS (₹) | 10.72 | 6.48 | 9.60 | +11.67% | +65.43% |
| Diluted EPS (₹) | 10.57 | 6.46 | 9.59 | +10.22% | +63.62% |
Standalone Financial Results Comparison
| Financial Metric (in ₹ Crore) | Q1 FY27 (Unaudited) | Q4 FY26 (Audited) | Q1 FY26 (Unaudited) | YoY Change (%) | QoQ Change (%) |
| Revenue from Operations | 455.52 | 455.24 | 441.93 | +3.08% | +0.06% |
| Other Income | 162.20 | (33.24) | 117.56 | +37.97% | Turnaround |
| Total Income | 617.72 | 422.00 | 559.49 | +10.41% | +46.38% |
| Total Expenses | 210.19 | 197.85 | 187.43 | +12.14% | +6.24% |
| Profit Before Tax (PBT) | 407.53 | 224.15 | 372.06 | +9.53% | +81.81% |
| Net Profit (PAT) | 311.38 | 191.74 | 276.89 | +12.46% | +62.40% |
| Standalone Basic EPS (₹) | 10.78 | 6.64 | 9.60 | +12.29% | +62.35% |
Income & Expense Breakdown Analysis
Other Income Dynamics: The single most prominent driver of sequential income growth was the turnaround in Other Income. In Q4 FY26, Other Income stood negative at -₹32.86 crore on a consolidated basis due to mark-to-market accounting adjustments on treasury investments. In Q1 FY27, equity and fixed-income market rallies generated ₹162.39 crore in Other Income, boosting total PBT.
Employee Expense Inflation: Employee benefits increased 25.60% YoY to ₹116.34 crore. This surge was influenced by annual increments, variable pay provisions, and stock option grants (ESOPs) issued under company incentive schemes.
Operational Margins: Operating Profit Margin (OPM) on core operational revenue experienced modest compression YoY as administrative, tech, and compliance overheads expanded ahead of top-line revenue growth.
Assets Under Management (AUM) Analysis
+-----------------------------------------------------------------------------------+
|                        Q1 FY27 AUM METRICS AT A GLANCE                            |
+-----------------------------------------------------------------------------------+
|  Overall Average AUM (incl. Alternates) :  ₹6,27,900 Crore  (▲ 42% YoY)          |
|  Mutual Fund Quarterly Average AUM     :  ₹4,27,700 Crore                         |
|  Equity Mutual Fund QAAUM              :  ₹1,98,700 Crore                         |
|  Equity Market Share (ex-ETF)          :  3.97%                                   |
|  Overall Mutual Fund Market Share      :  5.79% (ex-ETF)                          |
|  Alternate Assets (PMS/AIF/Offshore)   :  ₹3,26,000 Crore+                        |
|  Monthly SIP Book                      :  ~₹1,204 Crore / month                 |
|  Total Investor Folios                 :  11.1 Million                            |
+-----------------------------------------------------------------------------------+
Key Highlights of AUM Performance
Alternate Segment Thrust: The overall AUM surge to ₹6.28 lakh crore was heavily aided by the onboarding and scaling of institutional mandates, notably the Employees’ Provident Fund Organisation (EPFO) debt mandate within the alternate assets vertical.
Equity Growth: Equity QAAUM stood at ₹1,98,700 crore. Equity assets continue to command higher revenue yields relative to debt or liquid categories.
SIP Flow Trajectory: Systematic Investment Plan (SIP) monthly flows remained resilient at over ₹1,200 crore per month, providing stable long-term net inflows into equity strategies.
Segment & Subsidiary Performance
Aditya Birla Sun Life AMC operates under a single primary reportable segment—Asset Management Services—in accordance with Ind AS 108.
Overseas Subsidiaries Breakdown
The group operates four wholly owned international subsidiaries:
Aditya Birla Sun Life AMC (Mauritius) Limited
Aditya Birla Sun Life Asset Management Company Pte. Ltd. (Singapore)
Aditya Birla Sun Life Asset Management Company Limited (DIFC, Dubai)
Aditya Birla Sun Life AMC International (IFSC) Limited (GIFT City, India)
+-----------------------------------------------------------------------------------+
|                     Q1 FY27 INTERNATIONAL SUBSIDIARY PERFORMANCE                  |
+-----------------------------------------------------------------------------------+
|  Combined Revenue from 4 Subsidiaries :  ₹9.40 Crore                              |
|  Combined Net Loss After Tax           :  (₹1.90 Crore)                           |
|  Impact on Consolidated Financials    :  Minor drag on short-term profits         |
+-----------------------------------------------------------------------------------+
For Q1 FY27, the four overseas subsidiaries collectively contributed ₹9.40 crore in revenue and a net loss after tax of ₹1.90 crore, reflecting continued front-loaded setup and distribution investments in offshore jurisdictions.
Management Commentary & Growth Guidance
> "Crossing the ₹6 lakh crore overall AUM mark in Q1 FY27 is a structural milestone for our organization. We remain focused on widening our retail distribution foot-print across Beyond-30 (B-30) cities, enhancing our passive investment offerings, and growing our alternate asset strategies."
> — Key takeaway synthesized from management commentary and earnings updates.
Strategic Focus Areas
Expansion of Passive Solutions: The appointment of dedicated leadership for the Passives desk reflects ABSLAMC’s focus on index funds, ETFs, and smart-beta products.
Geographic Penetration: ABSLAMC maintains a distribution presence across 310+ locations, leveraging over 95,500 registered distributors. B-30 locations represent a key growth engine for incremental equity SIPs.
Corporate Governance & Capital Allocation: The Board of Directors reaffirmed a final dividend recommendation of ₹25.50 per share (face value ₹5 each) for FY26, scheduled for shareholder approval at the 32nd AGM on July 29, 2026.
Sector & Peer Comparison
The Indian Asset Management industry benefits from structural financialization of domestic household savings, expanding SIP books, and deepening capital market participation.
| Company Name | Market Cap (₹ Cr) | Q1 FY27 / Recent Revenue (₹ Cr) | Recent Qtr Net Profit (₹ Cr) | P/E Ratio (TTM) | P/B Ratio | Dividend Yield (%) | ROCE (%) |
| ICICI Prudential AMC | ~1,57,312 | 1,564.22 | 964.63 | 45.13 | 12.10 | 0.86% | 115.10% |
| HDFC AMC | ~1,13,645 | 1,098.50 | 838.36 | 38.53 | 11.20 | 2.04% | 42.88% |
| Nippon Life India AMC | ~75,852 | 738.73 | 384.72 | 49.60 | 9.80 | 1.81% | 43.80% |
| Aditya Birla Sun Life AMC | ~30,164 | 625.35 | 309.49 | 31.05 | 7.67 | 2.42% | 32.23% |
| UTI AMC | ~12,083 | 390.28 | (51.44) | 25.71 | 3.20 | 4.25% | 15.57% |
Analytical Takeaway on Peer Positioning
Valuation Discount: ABSLAMC trades at a P/E multiple of ~31.05x, presenting a valuation discount compared to large peers like ICICI AMC (45.1x) and Nippon Life India AMC (49.6x).
High Dividend Yield: At ~2.42%, ABSLAMC offers one of the highest dividend yields among top-tier listed Indian AMCs.
Stock Market Reaction & Technical Overview
On the results declaration day (July 21, 2026), ABSLAMC stock experienced profit-booking following an initial higher open.
+-----------------------------------------------------------------------------------+
|                        STOCK TRADING SNAPSHOT (NSE: ABSLAMC)                      |
+-----------------------------------------------------------------------------------+
|  Closing Price (July 21, 2026) :  ₹1,045.60                                   |
|  Day's Price Change            :  -₹73.00 (-6.53%)                                |
|  Day's High / Low              :  ₹1,126.90 / ₹1,038.10                           |
|  Previous Close                :  ₹1,118.60                                      |
|  52-Week High / Low            :  ₹1,224.90 / ₹708.00                            |
|  Market Capitalisation         :  ~₹30,132 Crore                                  |
+-----------------------------------------------------------------------------------+
Technical Chart & Moving Averages
Support Levels: Immediate support rests around the 100-day Exponential Moving Average (100 EMA) at ₹1,040.50, followed by major psychological support at ₹1,000.00.
Resistance Levels: Key short-term resistance stands at ₹1,115.00 (20 EMA), followed by ₹1,167.00.
Medium-Term Trend: Despite the post-earnings dip, the stock maintains a 6-month gain of over 36% and a 1-year return of ~33%.
SWOT Analysis
                        +----------------------------------------+
                        |               STRENGTHS                |
                        | • Strong promoter lineage (Aditya     |
                        |   Birla Group & Sun Life Financial).   |
                        | • Diverse AUM mix across ₹6.28 L Cr.   |
                        | • Pan-India presence (310+ cities).    |
                        +----------------------------------------+
                                            |
                        +----------------------------------------+
                        |              WEAKNESSES                |
                        | • Moderate core revenue growth (3.5% Y/Y)|
                        | • Higher employee benefit expense cost.|
                        | • Overseas subsidiaries in gestation.  |
                        +----------------------------------------+
                                            |
                        +----------------------------------------+
                        |             OPPORTUNITIES              |
                        | • Rapid retail expansion via B-30.     |
                        | • Expanding passive and AIF business.  |
                        | • Increasing financialisation of SIPs. |
                        +----------------------------------------+
                                            |
                        +----------------------------------------+
                        |                THREATS                 |
                        | • SEBI TER expense structure changes.  |
                        | • Intense competitive fee wars.        |
                        | • Market corrections impacting AUM.    |
                        +----------------------------------------+
Risk Analysis
Regulatory Risks (SEBI Directives): Any potential regulatory overhaul of total expense ratio (TER) slabs by SEBI could compress asset management fee margins across the mutual fund industry.
Market Volatility Risk: A sustained market correction could reduce overall equity AUM due to mark-to-market depreciation, directly impacting management fee collections.
Execution & Cost Risk: Escalating employee costs, technology spend, and marketing outlays could weigh on operational profit margins if core AUM growth moderates.
Growth Drivers & Future Outlook
Financialization Trend: Domestic monthly SIP inflows into Indian mutual funds continue to set records, providing a long-term tailwind for retail AMCs.
Passive & Smart-Beta Thrust: ABSLAMC’s strategy to expand its index fund and ETF pipeline aims to capture inflows from passive-oriented institutional and retail investors.
Alternate Investment Scaling: Leveraging PMS and AIF licenses allows ABSLAMC to offer customized high-yield strategies to High-Net-Worth Individuals (HNIs) and family offices.
Three Scenarios: Bull, Base & Bear Case
+-----------------------------------------------------------------------------------+
|                              3-YEAR SCENARIO ANALYSIS                             |
+-----------------------------------------------------------------------------------+
| BULL CASE (Target P/E: 38x - 40x):                                                |
| • Equity AUM grows >20% CAGR driven by robust SIP inflows and market performance.  |
| • Core revenue growth accelerates >12% YoY; international units turn profitable.  |
| • Target Price Band: ₹1,400 - ₹1,550                                              |
|                                                                                   |
| BASE CASE (Target P/E: 30x - 32x):                                                |
| • Total AUM grows 12%-15% CAGR; core revenue grows 6%-8% YoY.                     |
| • Operating margins stabilize around 58%-60%.                                     |
| • Target Price Band: ₹1,100 - ₹1,220                                              |
|                                                                                   |
| BEAR CASE (Target P/E: 22x - 25x):                                                |
| • Severe equity market downturn drops equity AUM; SEBI introduces tighter TER caps. |
| • Cost inflation dampens net profit growth.                                       |
| • Target Price Band: ₹800 - ₹900                                                  |
+-----------------------------------------------------------------------------------+