1. Introduction
In the city gas distribution (CGD) market, expanding sales volume alongside raw material price fluctuations plays a major role in shaping profit margins. Adani Total Gas Limited (ATGL) demonstrated this dynamic in its Q1 FY27 earnings report published on July 21, 2026.
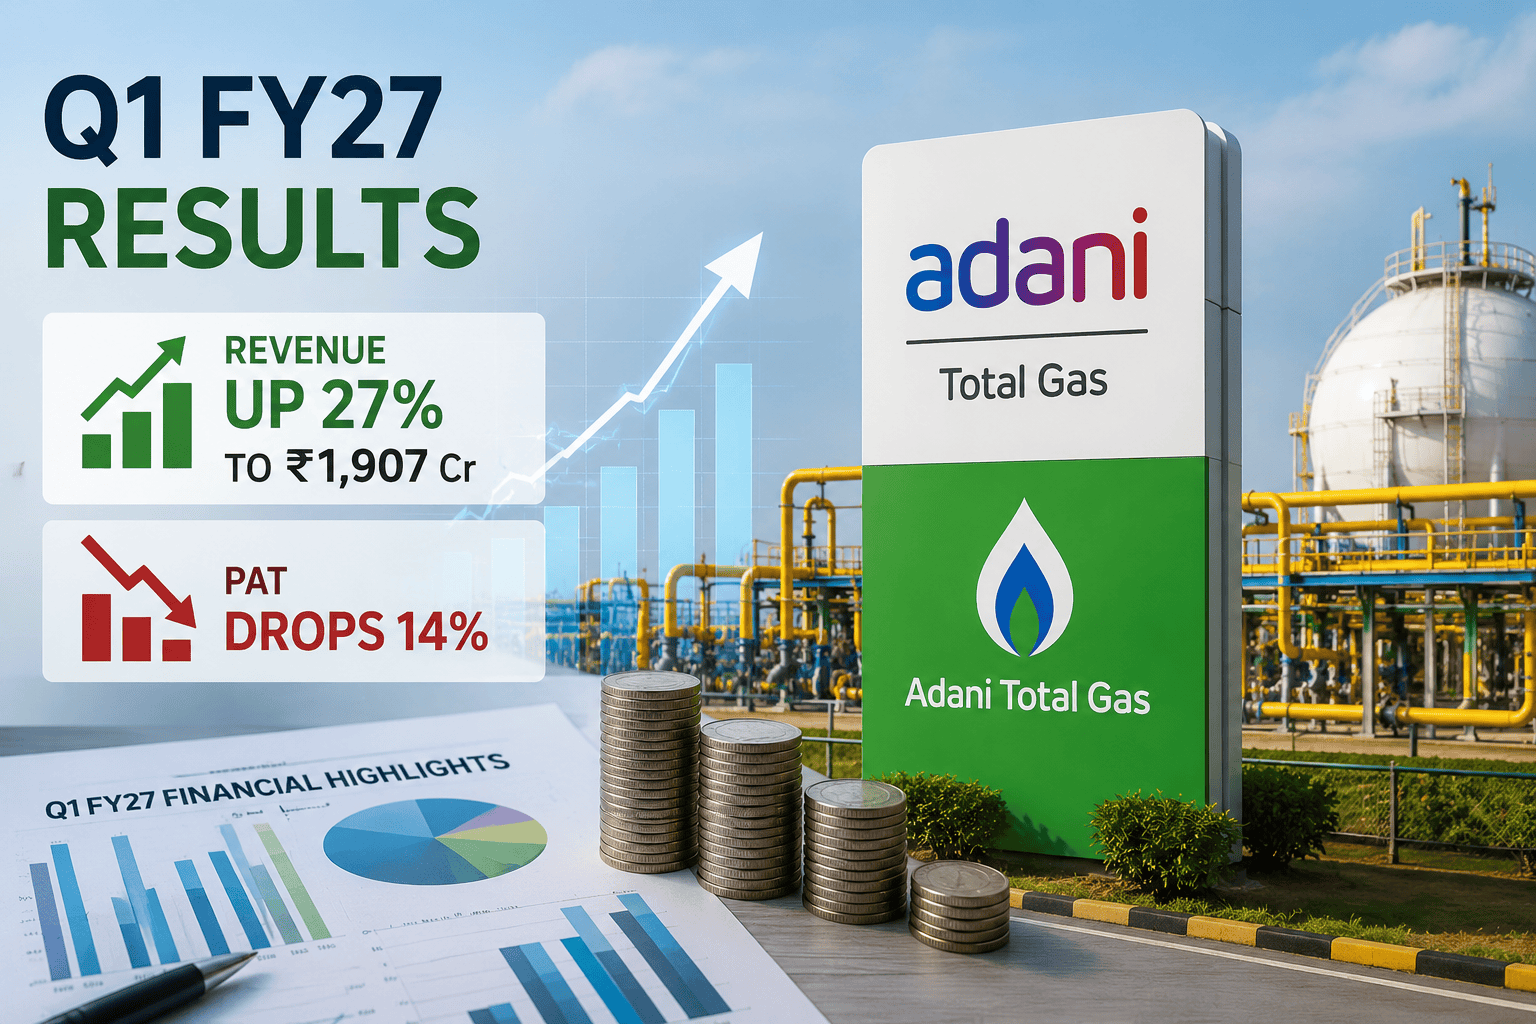
The company achieved a 27.26% YoY surge in top-line operational revenue, reaching ₹1,906.79 crore. This growth was supported by steady CNG adoption in urban transport corridors and expanding Piped Natural Gas (PNG) connections across domestic and industrial customer bases.
However, consolidated net profit fell 14.23% YoY to ₹141.72 crore. The main driver behind this margin squeeze was a 40.30% jump in raw natural gas procurement costs (₹1,302.51 crore). This increase was caused by lower domestic APM (Administered Price Mechanism) gas allocations and greater reliance on imported spot/term LNG cargoes.
On the stock exchanges, ATGL shares closed at ₹701.00 on the NSE following the earnings announcement, down 1.67% on the day.
                +---------------------------------------------------+
                |            ADANI TOTAL GAS LIMITED (ATGL)         |
                |               City Gas Infrastructure             |
                +-------------------------+-------------------------+
                                          |
          +-------------------------------+-------------------------------+
          |                                                               |
+---------v----------+                                          +---------v----------+
|    CNG BUSINESS    |                                          |    PNG BUSINESS    |
| Transport Sector   |                                          | Domestic Households|
|  600+ Fuel Stations|                                          | Industrial & Comms |
+--------------------+                                          +--------------------+
2. Executive Summary (10 Key Highlights)
Operational Topline Growth: Consolidated revenue from operations jumped 27.26% YoY to ₹1,906.79 crore in Q1 FY27 from ₹1,498.32 crore in Q1 FY26.
Net Profit Compression: Consolidated PAT dropped 14.23% YoY to ₹141.72 crore (vs ₹165.24 crore in Q1 FY26) and declined 15.81% sequentially.
Input Gas Cost Squeeze: Cost of natural gas and traded items surged 40.30% YoY to ₹1,302.51 crore (vs ₹928.37 crore in Q1 FY26), reducing gross spreads.
EBITDA Margin Squeeze: Consolidated Operating EBITDA margin contracted to 13.87% in Q1 FY27 (down 662 bps YoY from 20.49% in Q1 FY26).
Earnings Per Share (EPS): Basic and Diluted EPS stood at ₹1.29 per share (Face Value ₹1), compared to ₹1.50 in Q1 FY26 and ₹1.53 in Q4 FY26.
Excise Outlay Escalation: Excise duties increased by 27.99% YoY to ₹153.26 crore, matching higher CNG sales volume throughput.
Capital Outlay & Financing Costs: Finance costs climbed 41.67% YoY to ₹39.10 crore, driven by capital deployment across new Geographical Areas (GAs).
Joint Venture Strength: Share of net profit from JVs (including Indian Oil-Adani Gas Private Limited – IOAGPL) jumped 127.32% YoY to ₹9.57 crore (vs ₹4.21 crore in Q1 FY26).
E-Mobility & Biomass Diversification: Subsidiaries Adani TotalEnergies E-Mobility and Adani TotalEnergies Biomass continued building out EV charging hubs and CBG plants.
Market Capitalization: Following the earnings announcement, ATGL’s market cap stood at approximately ₹76,946 crore.
3. Company Overview
Adani Total Gas Limited is one of India’s largest private city gas distribution companies. The entity functions as an equal joint venture between India’s Adani Group (74.80% promoter holding split with TotalEnergies) and France’s global energy major TotalEnergies SE.
| Parameter | Detail |
| BSE Scrip Code / NSE Symbol | 542066 / ATGL |
| Industry Sector | Utilities — City Gas Distribution (CGD) |
| Current Stock Price (CMP) | ₹701.00 (NSE) |
| 52-Week High / Low | ₹859.85 / ₹462.80 |
| Market Capitalization | ~₹76,946 Crore |
| Face Value | ₹1.00 per share |
| Promoter Holding | 74.80% (Adani Family + TotalEnergies) |
| Institutional Holding | FII: 12.76% |
Core Revenue Streams:
Compressed Natural Gas (CNG): Supplied to passenger cars, auto-rickshaws, buses, and commercial light vehicles via network stations.
Piped Natural Gas (PNG – Domestic): Piped cooking gas delivered directly to residential households.
PNG (Industrial & Commercial): Natural gas fuel supplied to factories, processing plants, hotels, and commercial establishments.
New Energy Initiatives: Developing EV charging infrastructure and Compressed Bio-Gas (CBG) processing facilities.
4. Q1 FY27 Result Snapshot (Consolidated Comparison Table)
The table below presents the official consolidated financial figures reported in ATGL’s statutory exchange disclosures:
| Financial Metric (in ₹ Crore) | Q1 FY27 (Unaudited) | Q4 FY26 (Unaudited) | Q1 FY26 (Unaudited) | YoY Change (%) | QoQ Change (%) |
| Revenue from Operations | 1,906.79 | 1,694.61 | 1,498.32 | +27.26% | +12.52% |
| Other Income | 12.98 | 12.06 | 8.11 | +60.05% | +7.63% |
| Total Income | 1,919.77 | 1,706.67 | 1,506.43 | +27.44% | +12.49% |
| Cost of Natural Gas & Traded Items | 1,302.51 | 1,064.10 | 928.37 | +40.30% | +22.41% |
| Excise Duty | 153.26 | 137.39 | 119.74 | +27.99% | +11.55% |
| Employee Benefits Expense | 13.44 | 16.83 | 13.66 | -1.61% | -20.14% |
| Finance Costs | 39.10 | 34.91 | 27.60 | +41.67% | +12.00% |
| Depreciation & Amortization | 66.66 | 63.38 | 55.61 | +19.87% | +5.18% |
| Other Expenses | 166.37 | 175.95 | 139.84 | +18.97% | -5.44% |
| Total Expenses | 1,742.44 | 1,491.97 | 1,288.35 | +35.25% | +16.79% |
| Profit Before JV Share & Tax | 177.33 | 214.70 | 218.08 | -18.69% | -17.41% |
| Share of JV Profit (Net) | 9.57 | 12.22 | 4.21 | +127.32% | -21.69% |
| Profit Before Tax (PBT) | 186.90 | 226.92 | 222.29 | -15.92% | -17.64% |
| Total Tax Expense | 45.18 | 58.58 | 57.05 | -20.81% | -22.88% |
| Consolidated Net Profit (PAT) | 141.72 | 168.34 | 165.24 | -14.23% | -15.81% |
| Basic & Diluted EPS (₹) | 1.29 | 1.53 | 1.50 | -14.00% | -15.69% |
| Operating EBITDA | 264.44 | 301.12 | 306.84 | -13.82% | -12.18% |
| EBITDA Margin (%) | 13.87% | 17.77% | 20.49% | -662 bps | -389 bps |
5. Financial Performance Analysis
CONSOLIDATED REVENUE vs PAT TREND (₹ Crore)
==============================================
Q1 FY26  : Revenue 1,498.32 | PAT 165.24
Q4 FY26  : Revenue 1,694.61 | PAT 168.34
Q1 FY27  : Revenue 1,906.79 | PAT 141.72
==============================================
Topline Analysis
Operational revenue grew 27.26% YoY to ₹1,906.79 crore in Q1 FY27. This expansion was driven by:
Higher CNG sales volume across urban transport networks.
Expansion of industrial and commercial PNG supply contracts.
Tariff adjustments implemented to offset rising gas input costs.
Cost Driver & Profitability Squeeze
Gas Sourcing Cost Pressure: The primary factor impacting bottom-line profitability was a 40.30% increase in raw gas input costs to ₹1,302.51 crore. As domestic APM allocation quotas decreased, city gas operators relied more heavily on imported LNG term contracts and spot market purchases.
EBITDA Margin Compression: Consolidated EBITDA margin fell by 662 bps YoY to 13.87%.
Finance Costs: Expanded by 41.67% YoY to ₹39.10 crore, reflecting interest on borrowings used to fund steel/MDPE pipeline laying and CNG station development.
Depreciation: Increased 19.87% YoY to ₹66.66 crore due to capital expenditure capitalization across new geographical areas.
6. Business & Segment-Wise Performance
Per Note 4 of the financial disclosures, ATGL operates within a single operating segment: the sale and distribution of natural gas. However, performance varies across its core customer categories:
                  +-------------------------------------------------+
                  |       ATGL BUSINESS SEGMENT DRIVERS             |
                  +------------------------+------------------------+
                                           |
         +---------------------------------+---------------------------------+
         |                                                                   |
+--------v-------+                                                  +--------v-------+
|  CNG SEGMENT   |                                                  |   PNG SEGMENT  |
| Fleet Vehicles |                                                  | Domestic Piped |
| Public Transport|                                                  | Industrial/Comm|
+----------------+                                                  +----------------+
Customer Verticals:
CNG Segment: Represents the largest revenue contributor. Demand grew due to favorable economics compared to petrol and diesel, though higher gas costs compressed per-kg retail margins.
PNG Domestic: Provides stable, residential utility cash flows across urban license areas.
PNG Industrial & Commercial: Experienced volume growth, though margins were subject to competition from alternative fuels (such as propane and fuel oil) when international LNG prices fluctuated.
EV & CBG Subsidiaries: Adani TotalEnergies E-Mobility expanded its EV charging network, while Adani TotalEnergies Biomass worked on scaling its compressed biogas capacity.
7. Balance Sheet, Cash Flow & Financial Health
BALANCE SHEET METRICS SNAPSHOT (As of FY26 Audited Disclosures)
================================================================
Total Assets         : ₹9,549 Crore (vs ₹7,665 Cr in FY25)
Total Equity         : ₹4,865 Crore (Share Capital: ₹110 Cr)
Operating Cash Flow  : ₹1,149 Crore (Full Year FY26)
Network Expansion    : Capital Work in Progress (CWIP) at ₹2,001 Crore
================================================================
Capital Expenditure & Debt Structure:
Capital deployment remains focused on pipeline infrastructure, CNG station buildouts, and steel trunk pipeline connectivity.
Operating Cash Flows (reported at ₹1,149 crore for FY26) provide internal cash generation to support ongoing capital expenditure, keeping net debt metrics manageable.
8. Management Commentary & Legal Disclosures
Official Corporate Notes:
PNGRB Authorization Litigation: Notes 5, 6, and 7 detail ongoing legal proceedings with the Petroleum and Natural Gas Regulatory Board (PNGRB) regarding geographical authorizations for Jalandhar, Ludhiana, Kutch (East), and Noida. These matters remain before judicial bodies (Supreme Court, APTEL) without immediate adverse financial impact on Q1 results.
US Regulatory Update: Note 8 references US legal proceedings involving a non-executive director. The US SEC filed a request for entry of final judgment on May 15, 2026 (requiring civil penalties without admitting/denying allegations), and the US DOJ filed a motion to dismiss charges with prejudice on May 18, 2026. The company noted it was not named in these proceedings and suffered zero operational or financial impact.
9. Peer Comparison Table
The following matrix contextualizes ATGL’s performance relative to major listed city gas distribution peers in India:
| Company Name | Stock Price (₹) | Market Cap (₹ Cr) | P/E Ratio | TTM Revenue (₹ Cr) | OPM (%) | P/B Ratio |
| Adani Total Gas (ATGL) | 701.00 | 76,946 | 117.6x | 6,817 | 13.9% | 16.0x |
| Indraprastha Gas (IGL) | 154.66 | 21,650 | 14.8x | 15,200 | ~18.5% | 2.17x |
| Mahanagar Gas (MGL) | 1,090.90 | 10,775 | 11.2x | 4,200 | ~24.0% | 1.68x |
| Gujarat Gas Limited | 525.00 | 36,120 | 28.5x | 16,500 | ~14.2% | 4.80x |
Analytical Note: ATGL continues to trade at a premium valuation multiple (P/E ~117.6x) relative to peers like IGL and MGL, reflecting market expectations for long-term network growth across its geographic licenses.
10. Educational Technical Market View
Disclaimer: Technical chart commentary is provided for educational and monitoring purposes only, not as investment advice.
+-----------------------------------------------------------------------------------+
|                        ATGL TECHNICAL INDICATORS SNAPSHOT                         |
+-----------------------------------------------------------------------------------+
| Current Market Price    : ₹701.00                                                 |
| 50-Day Simple Moving Avg: ₹701.95 (Price testing 50-DMA level)                     |
| 200-Day Simple Moving Avg: ₹608.82 (Trading above long-term trendline)            |
| 14-Day RSI              : 49.86 (Neutral momentum indicator)                      |
| Key Support Levels      : ₹693.50 (1st Support) | ₹685.90 (2nd Support)             |
| Key Resistance Levels   : ₹714.20 (1st Resistance) | ₹728.35 (2nd Resistance)         |
+-----------------------------------------------------------------------------------+
Chart Pattern: Following the earnings announcement, ATGL tested its 50-day moving average (₹701.95).
Support Levels: Immediate technical support rests at ₹693.50, followed by ₹685.90.
Resistance Levels: Overhead technical resistance sits at ₹714.20 and ₹728.35. A sustained breakout above ₹730 would be needed to test the 52-week high region of ₹859.85.
11. Risk Factors & Strategic Opportunities
Key Risks:
Raw Gas Pricing Volatility: Reduced domestic APM gas allocations force higher reliance on imported spot LNG, exposing profit margins to global energy market fluctuations.
Alternative Energy Competition: Lower prices for alternative industrial fuels (e.g., propane) or faster EV adoption in commercial fleets could weigh on volume growth.
Execution & Regulatory Delays: Right-of-Way (RoW) approvals for pipeline network laying can extend project completion timelines.
Strategic Opportunities:
Geographical Area Expansion: Scaling infrastructure across newly authorized GAs provides a multi-year runway for volume additions.
CBG Integration: The government’s mandate for blending Compressed Bio-Gas (CBG) with CNG creates opportunities for ATGL’s biomass subsidiary.
EV Infrastructure Cross-Selling: Co-locating EV charging stations at existing CNG retail outlets lowers customer acquisition costs.
12. Scenario Analysis
12-MONTH ANALYTICAL PRICE SCENARIOS
======================================================
Bull Case  : ₹850 – ₹920 (APM gas policy relief, margin recovery)
Base Case  : ₹720 – ₹780 (15% volume growth, stable spreads)
Bear Case  : ₹580 – ₹630 (Elevated spot LNG costs, margin compression)
======================================================
Bull Case (Target: ₹850 – ₹920): Assumes policy interventions to increase domestic gas allocations to the CGD sector, lower international LNG prices, and EBITDA margins recovering toward 18-20%.
Base Case (Target: ₹720 – ₹780): Assumes 12-15% annual volume growth, stable retail selling prices, and steady EBITDA margins around 14-16%.
Bear Case (Target: ₹580 – ₹630): Driven by elevated global LNG spot prices, lower domestic gas availability, and margin compression below 12%.
13. What Investors Should Watch Next
Domestic APM Allocation Revisions: Government policy decisions regarding natural gas allocations for the CGD sector.
International LNG Price Movements: Trends in Asian spot LNG benchmark prices (JKM) affecting unhedged gas procurement costs.
CNG Station Addition Pace: Quarterly station rollout metrics across new license areas.
E-Mobility & CBG Operational Contribution: Progress updates from ATGL’s EV charging and biomass subsidiaries.
14. Conclusion & Editorial View
Adani Total Gas Limited’s Q1 FY27 results show strong operational topline expansion alongside profit margin pressure. A 27.26% YoY jump in operational revenue to ₹1,906.79 crore reflects steady demand across its CGD networks. However, a 40.30% increase in raw natural gas procurement costs compressed net margins, resulting in a 14.23% drop in PAT to ₹141.72 crore.
Looking ahead, ATGL’s long-term growth story depends on expanding its geographic network and managing gas sourcing costs effectively. While near-term profit margins remain sensitive to global gas price movements, the company’s expanding infrastructure footprint and co-promoter backing from TotalEnergies support its position in India’s energy transition.