📌 1. Introduction: A Watershed Quarter for TFCI
Tourism Finance Corporation of India Limited (NSE: TFCILTD | BSE: 526650) declared its unaudited standalone financial results for the first quarter ended June 30, 2026 (Q1 FY27) on July 20, 2026. The specialized non-banking financial company (NBFC)—which provides long-term financial assistance to India’s tourism, hospitality, and infrastructure sectors—delivered a milestone performance characterized by significant profit expansion, zero Net NPAs, and an exceptional one-time income tax refund windfall.
===================================================================================
                TOURISM FINANCE CORP OF INDIA (TFCI) Q1 FY27 AT A GLANCE
===================================================================================
[ Total Income ] -------------> ₹11,515.23 Lakh (▲ 74.95% YoY | ▲ 55.74% QoQ)
[ Net Profit (PAT) ] ---------> ₹6,120.93 Lakh  (▲ 100.30% YoY| ▲ 91.14% QoQ)
[ Revenue from Operations ] --> ₹8,102.26 Lakh  (▲ 27.17% YoY | ▲ 9.65% QoQ)
[ Net Interest Income ] ------> ₹5,486.75 Lakh  (▲ 14.52% YoY | ▲ 12.00% QoQ)
[ Tax Refund Interest ] ------> ₹3,400.03 Lakh  (One-time Other Income Boost)
[ Asset Quality (Gross NPA) ] -> 0.41%          (Net NPA: NIL | PCR: 100.00%)
[ Capital Adequacy (CRAR) ] --> 57.13%         (Strong Capital Foundation)
[ Basic & Diluted EPS ] ------> ₹1.32           (vs ₹0.66 in Q1 FY26)
===================================================================================
Why This Quarter Matters for Investors
The Q1 FY27 earnings report carries significance for retail and institutional shareholders alike:
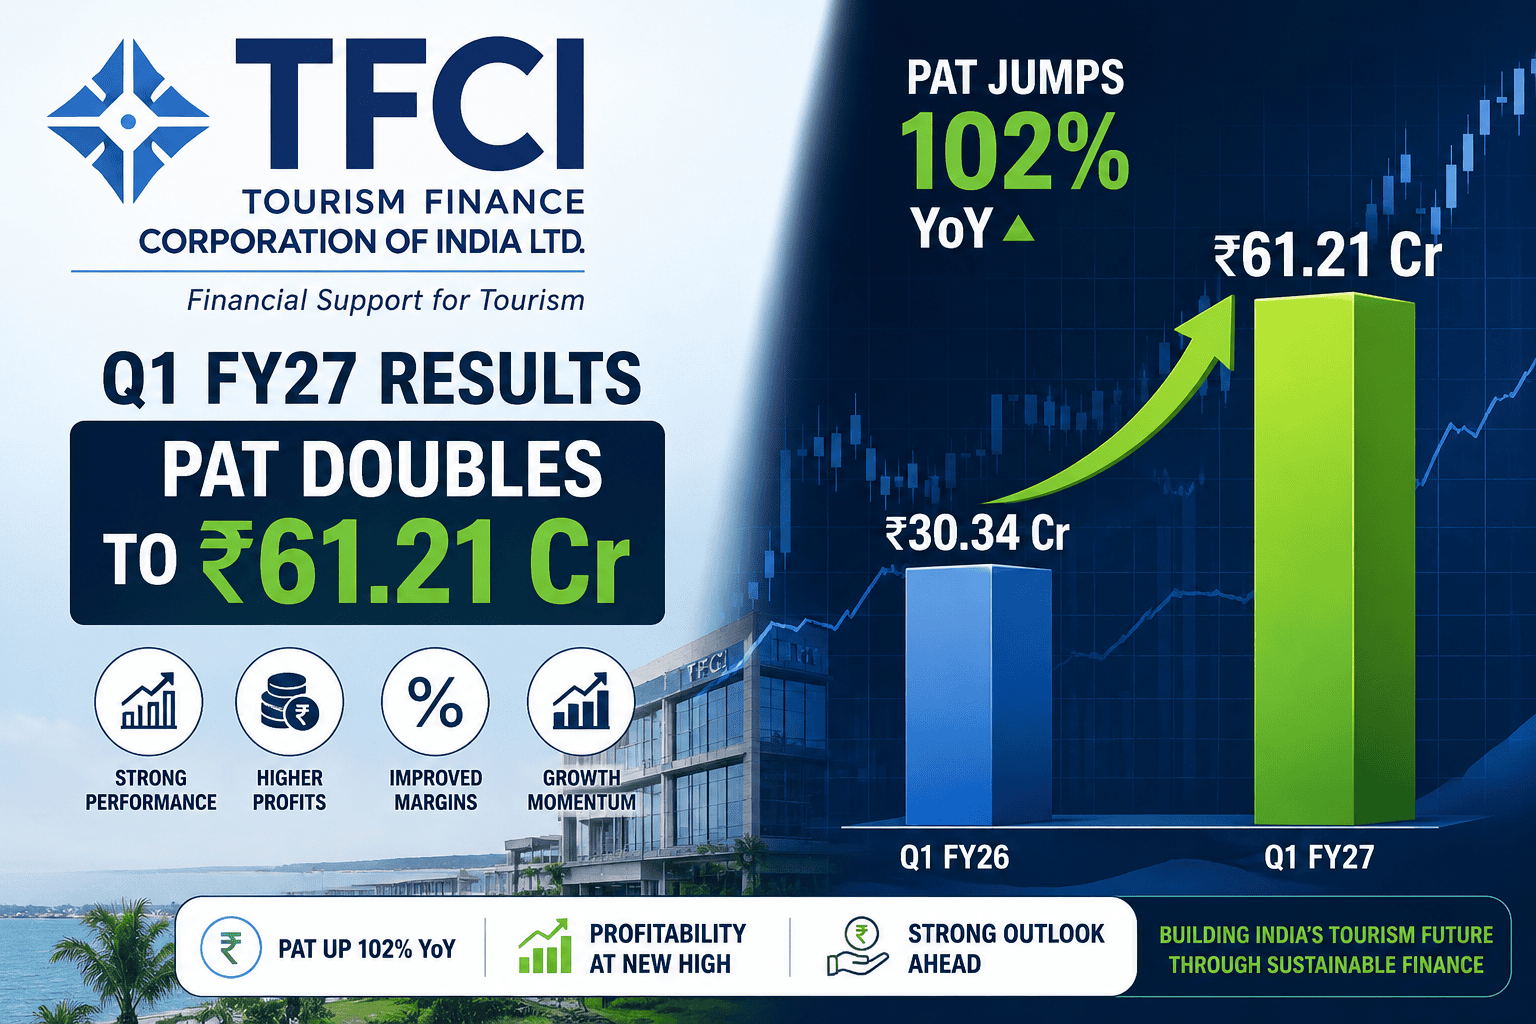
Doubling Bottom-Line Growth: Standalone Net Profit After Tax (PAT) doubled year-on-year to ₹6,120.93 lakh (₹61.21 crore), compared to ₹3,055.89 lakh in Q1 FY26 and ₹3,202.40 lakh in Q4 FY26.
One-Time IT Refund & Interest Inflow: TFCI received favorable appeal effect orders from the Income Tax Department for Assessment Years 1995-96 to 2002-03. This resulted in an interest recognition of ₹3,400.03 lakh as other income.
Core Operational Expansion: Even excluding the tax windfall, core operating revenue surged 27.17% YoY to ₹8,102.26 lakh, driven by a 29.13% YoY growth in core interest income to ₹7,211.75 lakh.
Spotless Balance Sheet & Asset Quality: TFCI maintained a Net NPA ratio of NIL (0.00%) with a Provision Coverage Ratio (PCR) of 100.00%, while Gross NPAs remained low at 0.41%.
📊 2. Quick Snapshot: Key Numbers at a Glance
The table below provides a comparative breakdown of TFCI’s audited and unaudited financial performance:
| Financial / Operating Metric | Q1 FY27 (Unaudited) | Q4 FY26 (Audited) | Q1 FY26 (Unaudited) | YoY Change (%) | QoQ Change (%) | FY26 Full Year |
Interest Income | ₹7,211.75 | ₹6,598.87 | ₹5,584.69 | ▲ 29.13% | ▲ 9.29% | ₹23,827.20 |
Fees & Commission Income | ₹362.34 | ₹181.46 | ₹515.32 | ▼ 29.69% | ▲ 99.68% | ₹1,599.60 |
Net Gain on Fair Value Change | ₹528.17 | ₹608.75 | ₹271.20 | ▲ 94.75% | ▼ 13.24% | ₹1,827.93 |
Revenue from Operations | ₹8,102.26 | ₹7,389.08 | ₹6,371.21 | ▲ 27.17% | ▲ 9.65% | ₹27,368.97 |
Other Income (incl. IT Refund) | ₹3,412.97 | ₹4.93 | ₹210.74 | ▲ 1519.52% | ▲ 69128.60% | ₹314.52 |
Total Income | ₹11,515.23 | ₹7,394.01 | ₹6,581.95 | ▲ 74.95% | ▲ 55.74% | ₹27,683.49 |
Finance Costs | ₹2,615.71 | ₹2,442.85 | ₹2,155.16 | ▲ 21.37% | ▲ 7.08% | ₹9,311.06 |
Employee Benefits Expense | ₹417.76 | ₹457.07 | ₹388.76 | ▲ 7.46% | ▼ 8.60% | ₹1,578.22 |
Other Operating Expenses | ₹515.62 | ₹408.11 | ₹208.33 | ▲ 147.50% | ▲ 26.34% | ₹1,160.23 |
Total Expenses | ₹3,563.21 | ₹3,321.98 | ₹2,766.06 | ▲ 28.82% | ▲ 7.26% | ₹12,105.38 |
Pre-Provision Operating Profit | ₹7,952.02 | ₹4,072.03 | ₹3,815.89 | ▲ 108.39% | ▲ 95.28% | ₹15,578.11 |
Impairment / ECL Provisions | ₹120.00 | ₹0.00 | ₹0.00 | N/A | N/A | ₹0.00 |
Profit Before Tax (PBT) | ₹7,832.02 | ₹4,072.03 | ₹3,815.89 | ▲ 105.25% | ▲ 92.34% | ₹15,578.11 |
Tax Expenses (Current + Deferred) | ₹1,711.09 | ₹869.63 | ₹760.00 | ▲ 125.14% | ▲ 96.76% | ₹3,231.78 |
Profit After Tax (PAT) | ₹6,120.93 | ₹3,202.40 | ₹3,055.89 | ▲ 100.30% | ▲ 91.14% | ₹12,346.33 |
Net Profit Margin (%) | 53.16% | 43.31% | 46.43% | +673 bps | +985 bps | 44.60% |
Basic & Diluted EPS (₹) | ₹1.32 | ₹0.69 | ₹0.66 | ▲ 100.00% | ▲ 91.30% | ₹2.67 |
Gross NPA Ratio (%) | 0.41% | 0.37% | 0.24% | +17 bps | +4 bps | 0.37% |
Net NPA Ratio (%) | NIL | NIL | NIL | Stable | Stable | NIL |
Capital Adequacy Ratio (CRAR) | 57.13% | 55.53% | 62.68% | -555 bps | +160 bps | 55.53% |
(Note: All monetary figures except EPS and percentages are in ₹ Lakhs. Share face value is ₹2 per share following the 1:5 stock split in Sept 2025).
📝 3. Executive Summary
Net Profit Doubling: Standalone PAT reached ₹6,120.93 lakh (₹61.21 crore), representing a 100.30% YoY growth over Q1 FY26 (₹3,055.89 lakh).
Income Tax Refund Recognition: Total income was boosted by ₹3,400.03 lakh in interest received on income tax refunds covering AY 1995-96 through AY 2002-03.
Core Revenue Trajectory: Revenue from operations grew 27.17% YoY to ₹8,102.26 lakh, anchored by an expansion in interest income from term loans.
Net Interest Income (NII) Expansion: NII expanded 14.52% YoY to ₹5,486.75 lakh, driven by sustained lending yields.
Strong Asset Quality Metrics: Net NPA ratio remained at 0.00% with a Provision Coverage Ratio (PCR) of 100.00%. Gross NPAs settled at 0.41%.
Enhanced ECL Provisions: Management created a preventive Expected Credit Loss (ECL) provision of ₹120.00 lakh to build a buffer against broader macroeconomic uncertainties.
Capital Adequacy Cushion: Capital Risk Adequacy Ratio (CRAR) strengthened sequentially to 57.13% (vs. regulatory requirement of 15%), providing substantial headroom for portfolio expansion.
Corporate Governance Update: The Board approved an amendment to the Articles of Association (AoA) to delete clauses related to the Common Seal, aligning operations with modernized corporate law.
🏢 4. Company Profile & Business Model
Tourism Finance Corporation of India Limited (TFCI) was established in 1989 on the recommendations of the National Committee on Tourism set up by the Planning Commission. It operates as a specialized Systemically Important Non-Deposit Taking Non-Banking Financial Company (NBFC-ND-SI) listed on both the NSE and BSE.
===================================================================================
                         TFCI CORE BUSINESS PROFILE
===================================================================================
[ Primary Sector Focus ] ------> Tourism, Hospitality, Resorts & Infrastructure
[ Product Portfolio ] ---------> Term Loans, Corporate Loans, Structured Finance
[ Key Geographical Reach ] ----> Pan-India Hotel Projects, Heritage Properties
[ Book Value per Share ] ------> ₹28.41 (Face Value ₹2.00)
[ Promoter Group Holding ] ----> 3.85%
[ FII Holding ] ---------------> 5.46% (Up from 2.76% in March 2026)
[ Public & Retail Holding ] ---> 90.69%
===================================================================================
Core Business Pillars
Hospitality & Tourism Financing: Direct long-term debt financing for star-category hotels, eco-resorts, wellness centers, amusement parks, ropeways, and heritage tourism properties.
Infrastructure & Healthcare Diversification: Select exposure to educational institutions, healthcare facilities, and commercial real estate projects to balance sector concentration risks.
Fee-Based Advisory Services: Project appraisal, financial structuring, and loan syndication advisory services for tourism infrastructure development.
📈 5. Detailed Q1 FY27 Result Analysis
Revenue & Top-Line Performance
Total income for Q1 FY27 stood at ₹11,515.23 lakh, up 74.95% YoY from ₹6,581.95 lakh in Q1 FY26. Operating revenue reached ₹8,102.26 lakh, representing a 27.17% YoY increase.
REVENUE & PROFIT TRAJECTORY (₹ IN LAKHS)
  12,000 ─────────────────────────────────────────────── Total Income: ₹11,515
  10,000
   8,000 ────────────────── Operating Revenue: ₹8,102
   6,000 ────────────────── PAT: ₹6,121
   4,000
   2,000
       0
          Q1 FY26              Q4 FY26              Q1 FY27
Net Interest Income (NII) & Margin Analysis
NII (Interest Income minus Finance Costs) grew to ₹5,486.75 lakh in Q1 FY27, up from ₹4,792.20 lakh in Q1 FY26.
Interest Earned: ₹7,211.75 lakh (▲ 29.13% YoY)
Finance Costs: ₹2,615.71 lakh (▲ 21.37% YoY)
Cost of Funds vs Yield: Finance costs grew at a slower rate than interest income, reflecting stable interest rate spreads on the loan book.
Operating Expenses & Cost-to-Income Dynamics
Operating expenses expanded during the quarter:
Employee Benefit Expense: ₹417.76 lakh (Up 7.46% YoY)
Other Operating Expenses: ₹515.62 lakh (Up 147.50% YoY)
Total Operating Expenses: ₹947.50 lakh (vs ₹610.90 lakh in Q1 FY26)
Despite the increase in administrative costs, TFCI’s net profit margin reached 53.16%, supported by non-operating interest income from the tax refund.
🔍 6. Forensic & Balance Sheet Analysis: The IT Refund Context
A critical driver of TFCI’s Q1 FY27 performance was the resolution of long-standing tax appeals.
===================================================================================
                   INCOME TAX REFUND DISCLOSURE (NOTE 6)
===================================================================================
• Assessment Years Covered: AY 1995-96 to AY 2002-03
• Net Current Tax Asset Adjustment: ₹808.35 Lakh
• Net Interest on IT Refund (Recognized as Other Income): ₹3,400.03 Lakh
• Impact on Total Profit Before Tax: Contributed ~43.41% of Q1 FY27 PBT
===================================================================================
Adjusting for One-Off Inflows (Core Operational Run-Rate)
To evaluate TFCI’s underlying earnings quality, investors can analyze performance with and without the tax refund:
[ Reported Profit Before Tax (PBT) ] ------------> ₹7,832.02 Lakh
[-] Interest on Income Tax Refund ───────────────> ₹3,400.03 Lakh
[ Operational PBT (Excl. Tax Refund) ] ---------> ₹4,431.99 Lakh
                                                  (▲ 16.15% YoY vs ₹3,815.89 Lakh)
Key Takeaway: Even after removing the one-time ₹3,400.03 lakh interest inflow, TFCI’s core PBT expanded 16.15% YoY, demonstrating steady operational momentum.
⚙️ 7. Asset Quality & Sector-Specific Ratios
TFCI’s balance sheet metrics remain conservative compared to industry averages:
===================================================================================
                  TFCI SECTOR-SPECIFIC RATIO DASHBOARD
===================================================================================
[ Gross NPA Ratio ] -------------> 0.41%   (vs 0.37% in Q4 FY26 | 0.24% in Q1 FY26)
[ Net NPA Ratio ] ---------------> NIL     (100% Fully Provisioned)
[ Provision Coverage Ratio ] ----> 100.00% (Industry-Leading Credit Shield)
[ Capital Adequacy (CRAR) ] -----> 57.13%  (vs 55.53% in Q4 FY26)
[ Total Debt-to-Equity Ratio ] --> 0.75x   (vs 0.83x in Q4 FY26)
[ Total Debt-to-Total Assets ] --> 42.28%  (vs 44.92% in Q4 FY26)
[ Tangible Net Worth ] ----------> ₹1,36,680.49 Lakh (~₹1,366.80 Cr)
===================================================================================
Expected Credit Loss (ECL) Provisioning
In Note 5 of the financial statements, management highlighted that ECL provisions were calculated under Ind AS 109. Enhanced provisions of ₹120.00 lakh were recognized to account for macroeconomic variables. Because total provisions exceed standard RBI IRACP requirements, no additional Impairment Reserve was required under RBI guidelines.
🥊 8. Peer Group Comparison
The table below contrasts TFCI’s key performance metrics with listed public-sector and specialized finance peers:
| Parameter | Tourism Finance Corp (TFCI) PDF | REC Limited | HUDCO | IREDA | IFCI Limited |
NSE Ticker | TFCILTD | RECLTD | HUDCO | IREDA | IFCI |
| Market Cap (₹ Cr) | ~₹3,856 | ~₹93,505 | ~₹40,624 | ~₹34,171 | ~₹19,444 |
| Current Market Price (₹) | ~₹83.48 | ~₹355.10 | ~₹202.93 | ~₹121.64 | ~₹72.17 |
| P/E Ratio (TTM) | ~31.3x | ~5.7x | ~10.1x | ~18.2x | ~105.3x |
| Price-to-Book (P/B) | ~2.9x | ~1.1x | ~1.8x | ~2.5x | ~1.3x |
Gross NPA Ratio (%) | 0.41% | ~2.1% | ~2.7% | ~2.2% | ~1.2% |
Net NPA Ratio (%) | NIL (0.00%) | ~0.8% | ~0.4% | ~0.9% | ~0.0% |
CRAR (%) | 57.13% | ~18.2% | ~20.5% | ~20.1% | ~16.5% |
📊 9. Stock Market Reaction & Technical Overview
Following the earnings release on July 20, 2026, TFCI’s stock price experienced active trading:
===================================================================================
                 TFCI STOCK PRICE & MARKET DATA SUMMARY
===================================================================================
[ Current Price (21-Jul-2026) ] -> ₹83.48 per Share (NSE)
[ Intraday High / Low ] ---------> ₹85.60 / ₹82.25
[ 52-Week High / Low ] ----------> ₹86.50 / ₹51.00
[ 1-Year Stock Return ] ---------> ▲ 43.67%
[ 6-Month Stock Return ] --------> ▲ 23.47%
[ Traded Volume ] ---------------> ~2.48 Million Shares
[ 50-Day Moving Average ] -------> ₹76.80
[ 200-Day Moving Average ] ------> ₹69.20
===================================================================================
Key Technical Levels
Primary Resistance: ₹86.50 (52-Week High)
Secondary Resistance: ₹88.20
Immediate Support: ₹81.60
Strong Support Level: ₹76.80 (50-DMA)
🛡️ 10. Risk Factors & Growth Opportunities
Business & Sector Risks
Sector Concentration Risk: TFCI’s loan portfolio remains heavily weighted toward hospitality and tourism assets, making its asset quality sensitive to broader travel demand trends.
Promoter Shareholding Structure: Promoter holding stands at 3.85%, with public/retail holding at 90.69%. This fragmented ownership structure increases sensitivity to retail trading flows.
Interest Rate Sensitivity: Changes in benchmark interest rates can impact net interest margins if borrowing costs adjust faster than lending rates.
Growth Opportunities
Expansion in Hospitality Investments: Increased domestic travel and hotel demand across Tier-2, Tier-3, and spiritual tourism destinations support loan growth opportunities.
Strong Capital Cushion: With a CRAR of 57.13%, TFCI can expand its loan book without requiring near-term equity capital dilution.
Institutional Interest: FII shareholding increased from 2.76% in March 2026 to 5.46% in June 2026, indicating growing international investor interest.