Executive Summary & Key Takeaways
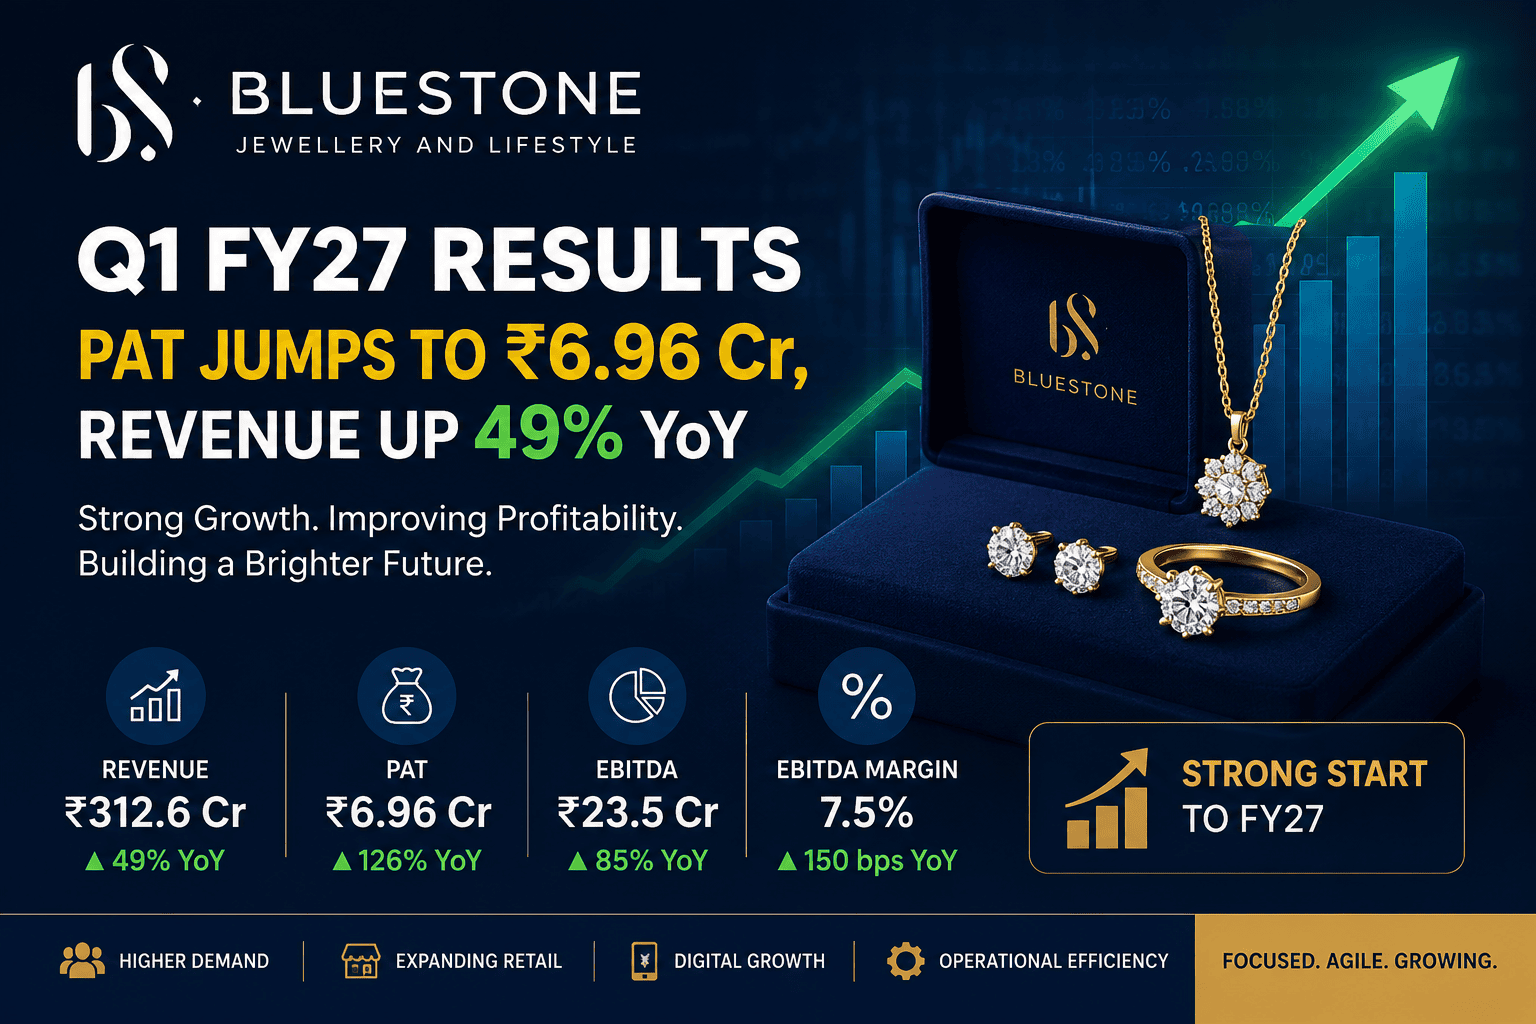
BlueStone Jewellery and Lifestyle Limited published its unaudited standalone and consolidated financial performance for the first quarter ended June 30, 2026 (Q1 FY27). Building upon its operational inflection point in FY26, the omnichannel digital-first jewellery retailer reported a sharp acceleration in top-line expansion alongside expanding operational leverage.
===================================================================================
                   BLUESTONE JEWELLERY (Q1 FY27) AT A GLANCE
===================================================================================
[ Consolidated Revenue    ] ---> ₹736.85 Cr (▲ 49.56% YoY | ▲ 8.13% QoQ)
[ Consolidated Net PAT    ] ---> ₹59.61 Cr  (Turnaround from -₹347.45 Cr YoY)
[ Standalone Revenue      ] ---> ₹733.19 Cr (▲ 48.85% YoY | ▲ 6.62% QoQ)
[ Pre-Ind AS EBITDA (SA)  ] ---> ₹54.80 Cr  (▲ 134.61% YoY | Margin 7.5%)
[ Same-Store Sales Growth ] ---> 39.00% YoY (Strong store-level productivity)
[ Store Count / Footprint ] ---> 352 Stores across 139 Cities (+12 New Stores)
===================================================================================
Key Takeaways
Top-Line Momentum: Consolidated revenue from operations reached ₹736.85 crore in Q1 FY27, up 49.56% YoY from ₹492.68 crore in Q1 FY26.
Operational Turning Point: Pre-Ind AS EBITDA for the standalone entity soared by 134.61% YoY to ₹54.80 crore, outstripping revenue growth by nearly 3x and expanding operating margins by 273 bps to 7.5%.
Resilient Consumer Demand: Same-Store Sales Growth (SSSG) accelerated to 39.0% YoY, supported by older store cohorts and an increasing Average Order Value (AOV) of ₹78,081.
Network Scaling: Added 12 net new stores during the quarter, extending total retail presence to 352 stores across 139 cities. All 5 new cities entered were Tier-2 and Tier-3 markets.
Custom Duty Impact Absorbed: Despite the upward revision of gold customs duty from 6% to 15% during the period, transient demand pauses in May normalized rapidly through June, underscoring the brand’s pricing power and design-led differentiation.
Business Overview & Market Positioning
Founded in 2011, BlueStone Jewellery and Lifestyle Limited has transformed from a direct-to-consumer (D2C) e-commerce platform into an omnichannel retail brand in India’s organized jewellery market.
+-----------------------------------------------------------------------------------+
|                           BLUESTONE OMNICHANNEL MODEL                             |
+-----------------------------------------------------------------------------------+
|     ONLINE PLATFORM       <--->     352 PHYSICAL STORES    <--->   MANUFACTURING  |
| (Website & Mobile App)            (139 Cities - Tier 1,2,3)        (In-House Cap) |
+-----------------------------------------------------------------------------------+
1. Business Model & Omnichannel Synergy
BlueStone operates an integrated “Click-and-Mortar” model. The brand leverages its digital storefront (website and mobile app) for customer acquisition, catalog browsing, and localized engagement, driving traffic into its physical retail footprint.
2. Product Portfolio & Revenue Mix
BlueStone focuses on daily-wear, lifestyle, and occasion-led studded jewellery. The product catalog spans rings, earrings, pendants, bangles, and solitaires crafted in gold, platinum, and diamonds.
Studded Revenue Share: Studded jewellery contributed 57.3% of standalone revenues in Q1 FY27 (compared to 55.3% in Q4 FY26). High-margin studded items offer higher gross realization per product relative to plain gold jewellery.
3. Manufacturing Capability
The company operates captive manufacturing facilities that utilize 3D printing and CAD-CAM technology. This design-to-deployment pipeline enables rapid inventory turnover and reduced working capital blockages.
Detailed Q1 FY27 Financial Performance
1. Consolidated Financial Statement Breakdown
Below is the verified comparative quarterly performance for BlueStone Jewellery and Lifestyle Limited on a consolidated basis:
| Metric (₹ in Millions) | Q1 FY27 (Unaudited) | Q4 FY26 (Audited) | Q1 FY26 (Unaudited) | YoY Change (%) | QoQ Change (%) | FY26 Full Year |
| Revenue from Operations | 7,368.46 | 6,814.72 | 4,926.78 | ▲ 49.56% | ▲ 8.13% | 24,364.24 |
| Other Income | 149.66 | 150.88 | 120.62 | ▲ 24.08% | ▼ 0.81% | 495.76 |
| Total Revenue | 7,518.12 | 6,965.60 | 5,047.40 | ▲ 48.95% | ▲ 7.93% | 24,860.00 |
| Cost of Materials Consumed | 7,120.01 | 7,196.99 | 4,175.74 | ▲ 70.50% | ▼ 1.07% | 22,043.45 |
| Stock-in-Trade Purchases | 47.58 | 47.43 | 36.50 | ▲ 30.36% | ▲ 0.32% | 127.52 |
| Change in Inventories | (2,803.47) | (3,413.28) | (1,308.11) | NM | NM | (8,241.16) |
| Employee Benefits Expense | 758.86 | 740.74 | 629.21 | ▲ 20.61% | ▲ 2.45% | 2,824.43 |
| Finance Costs | 553.65 | 525.34 | 528.68 | ▲ 4.72% | ▲ 5.39% | 2,104.11 |
| Depreciation & Amortization | 604.46 | 557.50 | 486.84 | ▲ 24.16% | ▲ 8.42% | 2,099.27 |
| Other Expenses | 1,167.12 | 985.49 | 835.64 | ▲ 39.67% | ▲ 18.43% | 3,715.07 |
| Total Expenses | 7,448.21 | 6,640.21 | 5,384.50 | ▲ 38.33% | ▲ 12.17% | 24,672.69 |
| Profit Before Share of Associate & Tax | 69.91 | 325.39 | (337.10) | Turnaround | ▼ 78.51% | 187.31 |
| Share of Loss from Associate | (10.30) | (13.58) | (10.35) | ▼ 0.48% | ▼ 24.15% | (55.52) |
| Consolidated Profit Before Tax (PBT) | 59.61 | 311.81 | (347.45) | Turnaround | ▼ 80.88% | 131.79 |
| Consolidated PAT (Reported) | 59.61 | 311.81 | (347.45) | Turnaround | ▼ 80.88% | 131.79 |
| Basic EPS (₹) | 0.46 | 2.05 | (9.86) | Turnaround | ▼ 77.56% | 1.10 |
2. Standalone vs. Pre-Ind AS Performance
The impact of Ind AS 116 accounting rules (lease capitalization) creates variances between statutory reported numbers and operational cash profiles. Management evaluates operating leverage using Pre-Ind AS EBITDA and Adjusted PAT metrics:
+-----------------------------------------------------------------------------------+
|               STANDALONE PRE-IND AS OPERATING MARGIN TRAJECTORY                   |
+-----------------------------------------------------------------------------------+
| Q1 FY26 Pre-Ind AS EBITDA Margin:  ████ 4.7%                                      |
| Q4 FY26 Pre-Ind AS EBITDA Margin:  ███████ 7.4%                                   |
| Q1 FY27 Pre-Ind AS EBITDA Margin:  ███████▌ 7.5% (+273 bps YoY)                   |
+-----------------------------------------------------------------------------------+
Standalone Key Metrics Comparison (DataBook)
Standalone Revenue: ₹7,331.94 million (up 48.8% YoY from ₹4,925.77 million).
Gross Profit & Margin: Gross Profit reached ₹2,981 million with a Gross Margin of 40.7% (compared to 41.1% in Q1 FY26 and 43.3% in Q4 FY26).
Pre-Ind AS EBITDA: Rose 134.61% YoY to ₹548 million (₹54.80 crore), with margins expanding by 273 bps YoY to 7.5%.
Adjusted PAT: Stood at ₹138 million (₹13.80 crore), reflecting a turnaround from an Adjusted PAT loss of ₹213 million in Q1 FY26.
Cash PAT: Reached ₹567 million for the quarter.
Operating Drivers & Segmental Insights
===================================================================================
                       KEY OPERATIONAL METRICS SUMMARY
===================================================================================
• Same Store Sales Growth (SSSG)     : 39.0% (vs. 18.4% in Q1 FY26)
• Life-to-Date Customer Count       : 9,84,766 (+21% YoY expansion)
• Average Order Value (AOV)          : ₹78,081 (vs. ₹55,499 in Q1 FY26)
• Repeat Customer Revenue Share      : 59.7% of total quarterly sales
• Total Operational Store Footprint  : 352 Stores across 139 Cities
===================================================================================
1. Same-Store Sales Growth (SSSG) Traction
BlueStone achieved an SSSG of 39.0% in Q1 FY27. The company defines SSSG as the sales performance of stores that have completed at least 12 full operating months (entering the calculation base from their 13th month). Management highlighted that older store cohorts performed in line with or ahead of newer stores, confirming that growth is supported by store productivity rather than solely new store additions.
2. Store Network Expansion Analysis
During Q1 FY27, BlueStone expanded its network footprint by opening 12 stores:
               STORE NETWORK EXPANSION (Q1 FY26 - Q1 FY27)

  360 +------------------------------------------------------- 352 ---+
      |                                                        |     |
  330 |                                            340         |     |
      |                                             |          |     |
  300 |                 292                         |          |     |
      |                  |                          |          |     |
  270 +------------------+--------------------------+----------+-----+
                      Q1 FY26                    Q4 FY26    Q1 FY27
Total Stores: 352 stores as of June 30, 2026.
City Coverage: Expanded from 134 cities in March 2026 to 139 cities in June 2026.
Tier-2 & Tier-3 Focus: All 5 newly entered cities during the quarter were Tier-2 and Tier-3 markets. Management noted that store unit economics and revenue productivity in non-metro locations continue to match Tier-1 benchmarks due to lower operating overheads.
Store Closures: Zero store closures occurred during the quarter.
3. Advertising & Marketing Efficiency
Advertising and promotional (A&P) expenditures for Q1 FY27 totaled ₹508 million (6.9% of revenue), unchanged as a percentage of top-line revenue compared to Q1 FY26 (6.9%). The sequential uptick from 6.1% in Q4 FY26 was attributed to seasonal marketing investments and campaigns surrounding the Indian Premier League (IPL).
Management Commentary & Strategic Guidance
Commenting on the Q1 FY27 results, Gaurav Singh Kushwaha, Founder, Chairman, and Managing Director of BlueStone Jewellery and Lifestyle Limited, stated:
“We have opened FY27 on a strong footing, with 49% YoY revenue growth and SSSG of 39% for the quarter, with older cohorts demonstrating similar to better SSSG trends. This performance is particularly satisfying as it came despite the rise in custom duty on gold from 6% to 15%, reflecting the structural drivers we have consistently spoken about—a portfolio that stays relevant across price points through design and technique innovation.
The quarter’s operating performance continues to reflect the embedded leverage in the business. Pre-Ind AS EBITDA of INR 55 crores grew at close to three times the rate of revenue, taking our margin up 273bps year-on-year. Our cash flow generation remains strong—we delivered a standalone cash profit of INR 57 crores for the quarter, reinforcing the self-funding nature of our growth.”
===================================================================================
                  MANAGEMENT Q&A HIGHLIGHTS & STRATEGIC FOCUS
===================================================================================
1. ON CUSTOMS DUTY IMPACT:
   • Brief demand pauses observed in May following the gold customs duty increase
     from 6% to 15% normalized fully through June.

2. ON CAPITAL ALLOCATION & SUBSIDIARIES:
   • Invested ₹30.00 million during Q1 FY27 in Seed 5 Compulsorily Convertible
     Preference Shares (CCPS) of associate entity Redefine Fashion Private Limited.

3. ON IPO PROCEEDS UTILIZATION:
   • Total IPO Issue Size (August 2025): ₹8,200 million (Fresh Issue).
   • Amount Utilized till June 30, 2026: ₹7,934.30 million.
   • Unutilized Funds: ₹265.70 million (₹200 million in fixed deposits,
     ₹65.70 million in public bank accounts).
===================================================================================
Financial Ratios & Balance Sheet Health
| Ratio / Metric | Q1 FY27 | Q4 FY26 | Q1 FY26 | Commentary / Analysis |
| Gross Margin (%) | 40.7% | 43.3% | 41.1% | Moderated slightly YoY due to raw material input price surges. |
| Pre-Ind AS EBITDA Margin (%) | 7.5% | 7.4% | 4.7% | +273 bps YoY expansion driven by fixed cost absorption. |
| Adjusted PAT Margin (%) | 1.9% | 1.7% | -4.3% | Positive territory reflecting net margin turnaround. |
| Average Order Value (AOV) | ₹78,081 | ₹74,816 | ₹55,499 | +40.69% YoY surge driven by customer premiumization. |
| Gross Debt (₹ in Cr) | ₹699.50 | ₹744.30 | ₹734.50 | Sequentially lower debt profile. |
| Net Debt (₹ in Cr) | ₹453.60 | ₹346.90 | ₹641.90 | De-leveraged YoY with lower interest burden. |
Industry Context & Competitor Landscape
The Indian organized jewellery sector is undergoing a structural shift from unorganized regional standalone jewellers to national omnichannel brands. Drivers including mandatory BIS hallmarking, evolving consumer design preferences, and omnichannel accessibility continue to accelerate market share consolidation.
+-----------------------------------------------------------------------------------+
|               INDIAN JEWELLERY SECTOR COMPETITOR COMPARISON TABLE                 |
+-----------------------------------------------------------------------------------+
| Metric / Feature    | BlueStone            | Titan (Mia/CaratLane)| Kalyan Jewellers |
+---------------------+----------------------+----------------------+------------------+
| Business Model      | D2C Omnichannel      | Omnichannel Leader   | High-Street Scale|
| Store Network       | 352 Stores           | 3,000+ Total Group   | 270+ Stores      |
| Core Segment Focus  | Lightweight / Studded| Diversified / Studded| Heavy Wedding    |
| Q1 FY27 Top-Line YoY| +48.8% Standalone    | ~9-12% (Estimated)   | ~20-25% (Est.)   |
| Pre-Ind AS Margin   | 7.5%                 | ~11-12%              | ~6.5-7.5%        |
+-----------------------------------------------------------------------------------+
Industry Tailwinds & Challenges
Gold Price Volatility & Duty Structure: The increase in import duty on gold to 15% presented short-term gross margin friction across the industry. However, lightweight studded jewellery retailers like BlueStone possess relative design protection, as labor/making charges and gemstone valuations dilute the absolute impact of gold content prices.
Expansion Beyond Metros: Consumer preference for lightweight, everyday jewellery in Tier-2 and Tier-3 markets provides expanding distribution opportunities.
Shareholding Pattern Analysis
As per capital market data for the period ended June 2026, the equity distribution of BlueStone Jewellery and Lifestyle Limited stands as follows:
               BLUESTONE SHAREHOLDING DISTRIBUTION (JUNE 2026)

  [ Promoters: 16.27% ] ==================> [ Founders / Key Management ]
  [ FII / FPI: 34.19% ] ==================================> [ Foreign Institutional ]
  [ DII / MF : 33.91% ] ==================================> [ Domestic Institutional ]
  [ Public   : 15.63% ] ==================> [ Retail & Non-Institutional ]
Key Institutional Holdings
Promoter Group: Holds 16.27% of equity shares, led by Founder & Managing Director Gaurav Singh Kushwaha.
Foreign Institutional Investors (FPIs): Maintain a aggregate stake of 34.19%, including global funds like Amansa Holdings, Accel India, and Peak XV Partners.
Domestic Institutional Investors (DIIs): Domestic funds hold 33.91%, with mutual funds (Nippon India, Aditya Birla Sun Life) and insurance companies (SBI Life) expanding position sizes over consecutive quarters.
Valuation & Market Outlook
Stock Valuation Overview
BSE Scrip Code: 544484 | NSE Symbol: BLUESTONE
Market Capitalization: ~₹9,130 Crore
52-Week Range: ₹399.80 – ₹793.00
Trailing P/E Ratio: ~620x (Reflects recent accounting turnaround from historical statutory GAAP losses; normalizing rapidly on forward Cash PAT base).
Price-to-Book (P/B) Ratio: ~5.07x
+-----------------------------------------------------------------------------------+
|                               SWOT ANALYSIS MATRIX                                |
+-----------------------------------------------------------------------------------+
| STRENGTHS                                 | WEAKNESSES                            |
| • Scalable omnichannel model.         | • Substantial lease liabilities.  |
| • Expanding Pre-Ind AS EBITDA (7.5%). | • Promoter holding at 16.27%.   |
| • High AOV (₹78,081) & repeat sales.  | • Sensitivities to gold costs.   |
+-------------------------------------------+---------------------------------------+
| OPPORTUNITIES                             | THREATS                               |
| • Deep Tier-2/3 market penetration.   | • Aggressive peer store rollouts.     |
| • Margin expansion via studded mix.   | • Import duty or regulatory changes. |
+-----------------------------------------------------------------------------------+
Comprehensive Risk Analysis
1. Short-Term Risks
Raw Material Volatility: Fluctuations in international gold bullion and polished diamond prices can impact gross margin realization if cost increases cannot be passed on immediately.
Custom Duty Fluctuations: Any future changes in precious metal import tariffs by the Ministry of Finance could impact retail demand cycles.
2. Medium-Term Risks
Store Lease Overheads: Rapid store expansion increases long-term real estate rental obligations under Ind AS 116 accounting, requiring store-level productivity to remain elevated.
3. Long-Term Risks
Execution Risk in Tier-2/3 Markets: Scaling operations across fragmented regional geography requires localized marketing and inventory management.