1. Executive Summary & Core Earnings Highlights
On July 18, 2026, Punjab National Bank (PNB) announced its unaudited reviewed financial results for the first quarter of the financial year 2026-27 (Q1 FY27). The numbers indicate structural improvements in the public sector banking major’s operational performance, characterized by strong bottom-line growth, steady credit metrics, and well-managed provisioning requirements.
Under the management of Managing Director and CEO Ashok Chandra, the bank’s core balance sheet showed clear signs of improvement. Declining credit costs and stable non-performing asset matrices helped drive the bank’s performance. Standalone net profit for the quarter increased significantly YoY, supported by steady retail credit expansion and structural gains in asset quality recovery channels.
Key Performance Ratios at a Glance (Standalone)
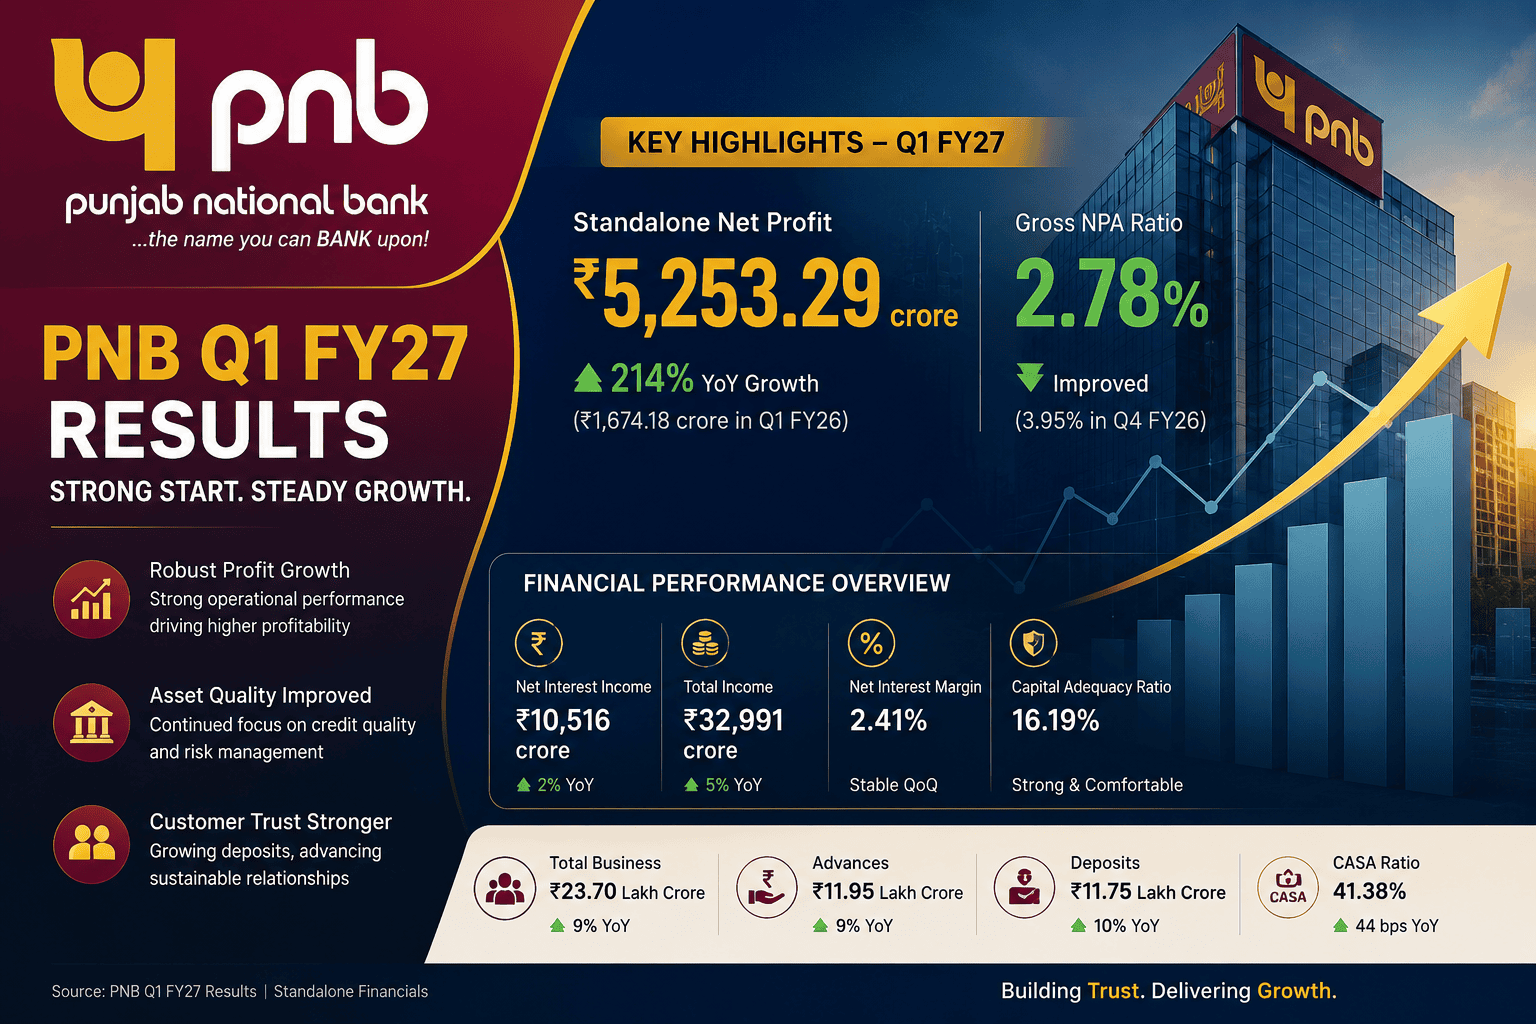
Net Profit (PAT): ₹5,253.29 crore (A substantial step up from ₹1,675.00 crore in Q1 FY25).
Gross NPA Ratio: 2.78% (Improving sequentially from 2.95% in Q4 FY26).
Net NPA Ratio: 0.28% (Remaining controlled below the bank’s long-term threshold targets).
Capital Adequacy Ratio (CAR): 18.13% under Basel III regulations.
Annualized Return on Assets (RoA): Increased to 1.04% compared to 0.37% in the year-ago period.
2. Company Profile & Strategic Footprint
Punjab National Bank is one of India’s largest public sector banking institutions, serving retail, micro, small, and medium enterprises (MSME), corporate clients, and agricultural sectors across the country.
Corporate Identity: Punjab National Bank (Head Office: Plot No. 4, Sector 10, Dwarka, New Delhi 110075).
Exchange Identifiers: BSE Scrip Code: 532461; NSE Symbol: PNB.
Promoter Structure: Dominated by the Government of India, which holds a stable 70.08% equity stake.
Core Subsidiary Network: Includes PNB Gilts Limited (74.07% ownership), PNB Cards and Services Limited (100%), and international divisions like Punjab National Bank (International) Limited UK (100%).
3. Financial Highlights & Comprehensive Data Tables
Standalone Balance Sheet and Revenue Matrix
The table below displays the key line items for PNB’s standalone banking performance across comparative fiscal horizons:
| Financial Metric (Standalone) | Q1 FY27 (Reviewed) | Q4 FY26 (Audited) | Q1 FY25 (Reviewed) | Full Year FY26 (Audited) |
| Interest Earned | ₹32,897.26 cr | ₹32,156.72 cr | ₹31,963.94 cr | ₹128,223.19 cr |
| — Advances/Bills Income | ₹23,061.14 cr | ₹22,488.30 cr | ₹21,664.46 cr | ₹88,761.59 cr |
| — Investment Income | ₹8,076.58 cr | ₹8,044.77 cr | ₹8,438.01 cr | ₹33,125.77 cr |
| Other Income | ₹4,333.47 cr | ₹4,161.98 cr | ₹5,267.82 cr | ₹18,793.97 cr |
| Total Income | ₹37,230.73 cr | ₹36,318.70 cr | ₹37,231.76 cr | ₹147,017.16 cr |
| Interest Expended | ₹22,098.90 cr | ₹21,776.42 cr | ₹21,385.58 cr | ₹86,263.42 cr |
| Operating Expenses | ₹7,612.63 cr | ₹7,041.93 cr | ₹8,764.56 cr | ₹31,464.11 cr |
| — Employee Costs | ₹4,535.38 cr | ₹3,747.16 cr | ₹5,164.37 cr | ₹18,747.03 cr |
| Operating Profit (PPOP) | ₹7,519.20 cr | ₹7,500.35 cr | ₹7,081.35 cr | ₹29,289.63 cr |
| Provisions (excl. Tax) | ₹541.19 cr | ₹423.71 cr | ₹323.10 cr | ₹2,539.93 cr |
| Net Profit (PAT) | ₹5,253.29 cr | ₹5,225.11 cr | ₹1,675.00 cr | ₹16,903.99 cr |
All raw metrics are processed from verified corporate exchange filings.
Consolidated Group Financial Performance Overview
PNB’s consolidated results reflect stable business contributions from its non-banking and insurance associates, including PNB Housing Finance and PNB MetLife:
| Consolidated Parameter | Q1 FY27 (Reviewed) | Q4 FY26 (Audited) | Q1 FY25 (Reviewed) | Full Year FY26 (Audited) |
| Total Group Revenue | ₹37,953.75 cr | ₹36,878.02 cr | ₹37,998.84 cr | ₹149,463.30 cr |
| Operating Profit | ₹7,662.76 cr | ₹7,521.21 cr | ₹7,318.53 cr | ₹29,564.94 cr |
| Group PAT (after Minority) | ₹5,814.72 cr | ₹5,591.64 cr | ₹2,119.88 cr | ₹18,392.69 cr |
| Group Basic EPS (₹) | 5.06 | 4.83 | 1.84 | 16.00 |
All raw metrics are processed from verified corporate exchange filings.
4. Quarter-on-Quarter (QoQ) & Year-on-Year (YoY) Performance Dynamics
Standalone Income and Expense Movements
On a Year-on-Year basis, PNB’s standalone Net Profit increased significantly to ₹5,253.29 crore from ₹1,675.00 crore in Q1 FY25. This improvement was driven by a reduction in total operating expenses, which fell from ₹8,764.56 crore in Q1 FY25 to ₹7,612.63 crore in Q1 FY27, helped by lower employee costs.
Sequentially, the bank maintained steady performance, with standalone net profit rising slightly from ₹5,225.11 crore in Q4 FY26 to ₹5,253.29 crore in Q1 FY27. Total interest earned grew sequentially by 2.30%, driven by expansion in income from advances, which rose from ₹22,488.30 crore to ₹23,061.14 crore.
5. Comprehensive Segment-wise Performance Breakdown
The table below outlines segment revenues and operational profit contributions across the group’s business segments:
| Operating Segment | Segment Revenue (Q1 FY27) | Segment Profits (Q1 FY27) | Total Segment Assets (Q1 FY27) |
| Treasury Operations | ₹1,049,859 lakh | ₹218,252 lakh | ₹51,651,018 lakh |
| Corporate / Wholesale Banking | ₹1,434,715 lakh | ₹347,275 lakh | ₹86,287,678 lakh |
| Retail Banking (Total) | ₹1,160,545 lakh | ₹298,180 lakh | ₹51,469,003 lakh |
| — (i) Digital Banking Unit | ₹31 lakh | (₹195 lakh) | ₹1,197 lakh |
| — (ii) Other Retail Banking | ₹1,160,514 lakh | ₹298,375 lakh | ₹51,467,806 lakh |
| Other Banking Operations | ₹77,954 lakh | ₹21,624 lakh | ₹6,361,949 lakh |
All details are drawn from official segment disclosures.
Insights from Segment Analysis
Corporate and Wholesale Banking continues to be the largest business line, contributing ₹347,275 lakh in segment results from an asset base of ₹86,287,678 lakh.
Retail Banking Operations showed positive progress, delivering a segment profit of ₹298,180 lakh. The digital banking sub-segment, which includes 8 active Digital Banking Units (DBUs), recorded an operating loss of ₹195 lakh, reflecting continued technology implementation costs.
Treasury Operations generated revenue of ₹1,049,859 lakh, supported by domestic investment yields, leading to a segment profit of ₹218,252 lakh.
6. Banking Asset Quality Analysis & Balance Sheet Strength
Credit Quality Parameters
The bank’s asset quality metrics reflect a well-insulated balance sheet:
Gross NPA Metrics: Total Gross NPAs dropped sequentially to ₹35,380.80 crore (2.78% of gross advances) from ₹37,124.12 crore (2.95%) at the end of FY26.
Net NPA Metrics: Net unprovisioned non-performing loans fell to ₹3,433.20 crore, representing a Net NPA ratio of 0.28%.
Provision Coverage Ratio (PCR): The overall Provision Coverage Ratio improved to 97.23%, up from 96.88% in the prior year period, providing a strong safety margin.
Capital Strength: The Capital Adequacy Ratio rose to 18.13%, driven by growth in the core CET-1 ratio to 14.52%, indicating a solid capital cushion.
7. Policy Directives & Special Accounting Disclosures
Discontinuation of the Investment Fluctuation Reserve (IFR)
Following updated Reserve Bank of India directives regarding the valuation and operation of commercial bank portfolios, the requirement to maintain a separate Investment Fluctuation Reserve was discontinued. As a result, PNB transferred its entire outstanding IFR balance of ₹4,143.55 crore to General Reserves during the quarter. This adjustment strengthens the bank’s core capital reserves while simplifying the tier-1 capital structure.
Insolvency and Bankruptcy Code (IBC) Provisions
As of June 30, 2026, PNB maintained an aggregate provision of ₹6,762.63 crore for accounts under active IBC resolution processes. This allocation represents a 100% provision coverage ratio for all stressed exposures listed under RBI List-1 and List-2 mandates, reducing the risk of unexpected credit shocks from these legacy cases.
                  PNB PORTFOLIO PROVISIONAL FRAMEWORK

   ┌───────────────────────────────────┐       ┌───────────────────────────────────┐
   │          IBC TOTAL COVER          │       │       ADDITIONAL LOAN BUFFER      │
   ├───────────────────────────────────┤       ├───────────────────────────────────┤
   │ • Coverage Target: 100%           │       │ • Stressed Assets Provision       │
   │ • Mandates: RBI List 1 & List 2   │       │ • Impacted Accounts: 15 Core A/cs │
   │ • Allocated Funds: ₹6,762.63 Cr   │       │ • Invested Balance: ₹2,377.53 Cr  │
   └───────────────────────────────────┘       └───────────────────────────────────┘
                    │                                            │
                    └─────────────────────┬──────────────────────┘
                                          ▼
                      ┌───────────────────────────────────────┐
                      │    TOTAL OVERALL SYSTEM PROVISION     │
                      │      COVERAGE RATIO: 97.23%           │
                      └───────────────────────────────────────┘
8. Business Risks & Growth Drivers
Headwinds & Risk Factors
Project Financing Exposures: PNB’s outstanding portfolio of projects under active implementation monitoring stood at ₹26,132.89 crore across 1,733 separate accounts at the end of the quarter. Out of these monitoring fields, 124 accounts representing ₹1,499.12 crore required adjustments or extensions in their scheduled Commercial Operations Date (DCCO), indicating potential execution delays in large infrastructure projects.
Rise in Cost of Deposits: Sequential expansion in interest expenditure from ₹21,776.42 crore to ₹22,098.90 crore highlights the pressure on margins from higher funding costs across the domestic banking system.
MSME Restructuring Lists: The bank holds ₹1,126.65 crore in outstanding restructured assets across 8,557 accounts under Covid Resolution Framework 2.0, requiring continuous asset quality monitoring.
Opportunities & Growth Triggers
Co-Lending Models: Active co-lending partnerships reached ₹795.21 crore in outstandings, focusing on the high-yield MSME and retail loan spaces.
Asset Recovery Momentum: The bank realized an additional consideration of ₹34.42 crore from stressed loans transferred to ARCs in earlier periods, alongside reversing ₹147.40 crore in excess provisions to the P&L account following the transfer of a non-performing asset during the quarter.
9. Editorial Perspective & Analyst Interpretation
Editorial Label: Professional Market Commentary
PNB’s Q1 FY27 results indicate a clearer balance sheet path, moving past the asset quality challenges that impacted its performance over the last decade. The reduction in Gross NPAs to 2.78% and the achievement of a 97.23% Provision Coverage Ratio show disciplined underwriting and risk management.
Additionally, the core capital adequacy ratio of 18.13% gives the bank the flexibility to pursue growth without needing immediate equity dilution. While the infrastructure implementation book and rising funding costs across the industry warrant close attention, PNB’s improved operational efficiency and strong core reserves support its competitive position in the private and public sector banking landscape.
10. Conclusion & Forward Outlook
Punjab National Bank’s performance in Q1 FY27 indicates steady execution of its core turnaround strategies. Supported by a standalone net profit of ₹5,253.29 crore, lower non-performing asset counts, and capital reserves, the bank is well-positioned for sustainable growth. Over the next few quarters, investors should monitor the stabilization of net interest margins, the trend of infrastructure credit repayments, and progress in retail loan growth.