

1. Powerful Introduction
In an environment where elevated interest rates are squeezing lending margins across the Indian banking sector, Pune-based state-owned lender Bank of Maharashtra (NSE: MAHABANK) has delivered a commanding performance for the first quarter of Fiscal 2027 (Q1 FY27).
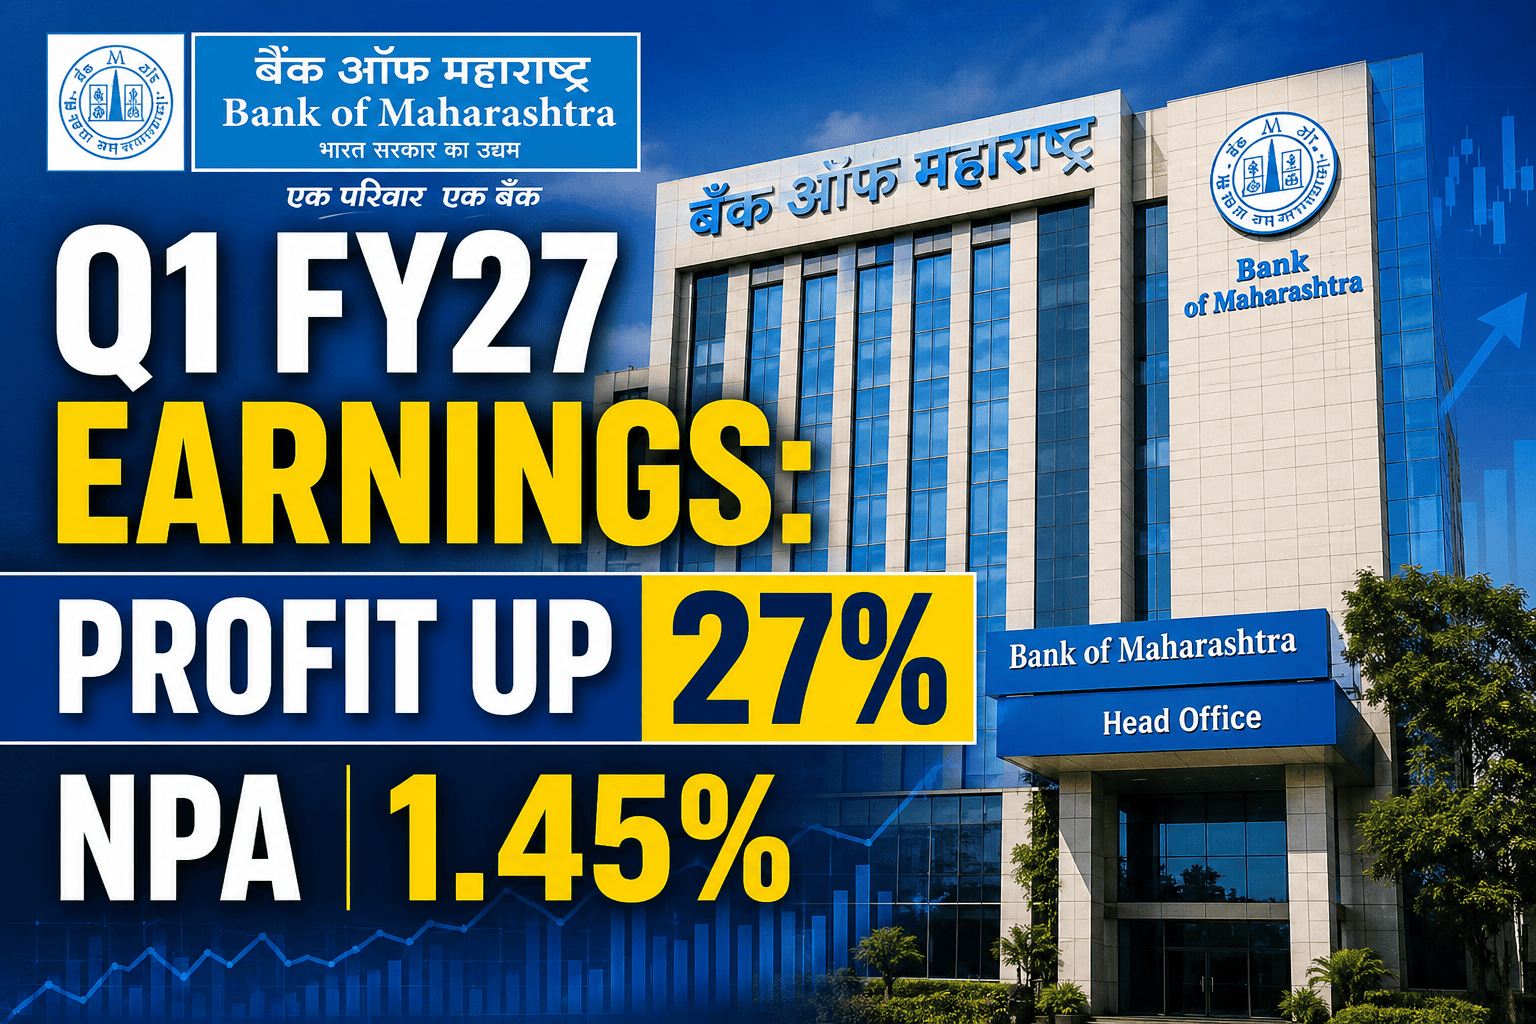
On Friday, July 10, 2026, the bank announced its unaudited financial results for the quarter ended June 30, 2026, triggering an immediate upward spike in its share price. Defying margin pressures, the lender posted a 26.8% year-on-year (YoY) jump in net profit, breaching the ₹2,000 crore mark to land at ₹2,020.19 crore.
But the real story isn’t just the bottom-line growth—it is the impeccable cleaning up of the balance sheet. With Gross Non-Performing Assets (GNPA) dropping to an industry-leading 1.45% and Net NPAs virtually eliminated at 0.13%, Bank of Maharashtra is increasingly resembling a premium private sector bank in its asset quality metrics while maintaining the scale and trust of a Public Sector Undertaking (PSU).
Why does this quarter matter? Because it proves that the bank’s turnaround story was not a post-pandemic flash in the pan. By growing advances at a blistering 27%—well above its own full-year target of 18%—while simultaneously holding its Net Interest Margin (NIM) at a robust 3.85%, management has demonstrated that they can capture market share without compromising on underwriting standards.
This comprehensive analysis breaks down the granular details of Bank of Maharashtra’s Q1 FY27 earnings, exploring what drove the revenue, what management is planning next, and what investors should watch out for in the coming quarters.
2. Executive Summary
If you only have two minutes, here are the eight most critical takeaways from Bank of Maharashtra’s Q1 FY27 financial results:
Profitability Milestone: Net profit surged 26.8% YoY to ₹2,020 crore, crossing the psychological ₹2,000 crore barrier for a single quarter. Return on Assets (RoA) hit an exceptional 1.90%.
Top-Line Vigor: Total income grew by 15% YoY to ₹9,063.53 crore, fueled by a 13.9% increase in interest earned and a 25% surge in other (non-interest) income.
Core Lending Strength: Net Interest Income (NII) expanded by 14.53% YoY to ₹3,770 crore. Net Interest Margin (NIM) stood strong at 3.85%, exceeding internal guidance of 3.75%.
Pristine Asset Quality: GNPA improved to 1.45% (down from 1.74% a year ago), and Net NPA fell to just 0.13%. Corporate NPA is practically non-existent at 0.04%.
Operational Efficiency: The cost-to-income ratio tightened to a highly efficient 35.04%, down from 37.57% last year, indicating strict control over operational expenses.
Robust Credit Growth: Gross advances grew by a massive 26.90% YoY to ₹3,05,964 crore.
Comfortable Capitalization: The Capital Adequacy Ratio (CRAR) under Basel III stood at 18.64%, providing an enormous buffer for future growth without immediate equity dilution.
Digital Adoption: The newly launched “Zen Lyfe” mobile banking application rapidly scaled to 1.39 million users, highlighting successful digital penetration.
3. Results Snapshot
The table below provides a comprehensive comparison of the bank’s core financial metrics across relevant timeframes.
| Financial Metric | Q1 FY27 (Jun ’26) | Q1 FY26 (Jun ’25) | YoY Change | Q4 FY26 (Mar ’26) | QoQ Change |
| Total Income | ₹9,063.53 Cr | ₹7,879.18 Cr | +15.03% | ₹8,693.46 Cr | +4.26% |
| Net Interest Income (NII) | ₹3,770.36 Cr | ₹3,292.07 Cr | +14.53% | ₹3,702.90 Cr | +1.82% |
| Operating Profit | ₹3,117.17 Cr | ₹2,569.94 Cr | +21.29% | ₹2,946.60 Cr | +5.80% |
| Net Profit (PAT) | ₹2,020.19 Cr | ₹1,592.76 Cr | +26.84% | ₹2,014.46 Cr | +0.30% |
| Net Interest Margin (NIM) | 3.85% | N/A | – | N/A | – |
| Return on Assets (RoA) | 1.90% | 1.80% | +10 bps | N/A | – |
| Return on Equity (RoE) | 24.65% | 23.08% | +157 bps | N/A | – |
| Gross NPA | 1.45% | 1.74% | -29 bps | 1.45% | Flat |
| Net NPA | 0.13% | 0.18% | -5 bps | 0.13% | Flat |
| Provision Coverage (PCR) | 98.55% | 98.36% | +19 bps | 98.59% | -4 bps |
| Cost-to-Income Ratio | 35.04% | 37.57% | -253 bps | 36.51% | -147 bps |
| CASA Ratio | 49.00% | 50.00% | -100 bps | N/A | – |
| Total Global Deposits | ₹3,44,493 Cr | ₹3,05,024 Cr | +12.93% | ₹3,50,538 Cr | -1.73% |
| Gross Global Advances | ₹3,05,964 Cr | ₹2,37,326 Cr | +26.90% | ₹2,88,104 Cr | +4.80% |
(Note: Data sourced from official exchange filings and Q1 FY27 earnings presentation. EPS is non-annualized.)
Did You Know? A Provision Coverage Ratio (PCR) of 98.55% means that for every ₹100 of bad loans, Bank of Maharashtra has already set aside ₹98.55 from its profits. This effectively insulates future earnings from historical bad debt shocks.
4. Company Overview
Before diving deeper into the numbers, it is crucial to understand the engine generating them.
Bank of Maharashtra is a premier public sector bank headquartered in Pune, Maharashtra. Founded in 1935 and nationalized in 1969, it commands a dominant market share in its home state, which is structurally India’s most industrialized and economically vibrant region.
Business Model & Revenue Mix:
The bank operates through four primary segments:
Retail Banking: Mortgages, vehicle loans, and personal credit.
Corporate/Wholesale Banking: Large-ticket loans to manufacturing, infrastructure, and services sectors.
MSME & Agriculture: Priority sector lending, which benefits from favorable regulatory treatment.
Treasury Operations: Investments in government securities, bonds, and forex trading.
Over the last five years, Bank of Maharashtra has pivoted successfully from a legacy corporate-heavy loan book to a granular, retail-focused portfolio. This strategic shift has reduced concentration risk, lowered NPAs, and allowed the bank to source cheap retail deposits—giving them one of the best CASA (Current Account Savings Account) ratios among PSU banks.
5. Quarter Highlights
The June 2026 quarter marked another period of broad-based, multi-cylinder growth.
1. Sizzling Credit Expansion:
While the broader banking system is seeing loan growth hover around 15-16%, Bank of Maharashtra reported a massive 26.90% YoY surge in gross advances to ₹3,05,964 crore. Management highlighted that this growth was achieved without aggressively diluting underwriting standards or dropping yields.
2. Non-Interest Income Acts as a Catalyst:
While core lending (NII) grew by 14.53%, the bank’s “Other Income” was the silent hero, vaulting 25% YoY to ₹1,029 crore. This was driven by a 29% increase in commission from advances, a 38% jump in treasury income, and a spectacular 37% rise in recoveries from written-off accounts.
3. Operating Leverage Kicking In:
Total income grew by 15%, but operating profit shot up by 21.29% to ₹3,117 crore. This disparity is the textbook definition of operating leverage—the bank is generating more revenue without proportionately increasing its operating costs. The improvement in the cost-to-income ratio from 37.57% to 35.04% is a direct testament to this efficiency.
4. The ₹1 Trillion Milestone:
In an impressive feat of scale, the bank added roughly ₹1,04,000 crore (over ₹1 Trillion) of total business over the past 12 months, bringing total global business to ₹6,50,457 crore (up 19.10% YoY).
6. Banking Analysis: Deconstructing the Ratios
To truly analyze a bank, we must look beyond standard profit metrics and examine the raw mechanics of its balance sheet.
Net Interest Income (NII) and Margins (NIM)
NII is the bread and butter of banking—the difference between interest earned on loans and interest paid on deposits. NII rose to ₹3,770 crore, a steady 14.53% YoY climb. More importantly, the Net Interest Margin (NIM) stood at 3.85%.
For context, most PSU banks struggle to push NIMs past 3.2%. A margin of 3.85% indicates that Bank of Maharashtra has strong pricing power on its loans and a very low cost of funds.
Liability Franchise (CASA & Deposits)
The bank’s total deposits grew by 12.93% YoY to ₹3,44,493 crore. The CASA ratio—which represents the percentage of deposits held in low-cost Current and Savings Accounts—was a healthy 49%. Although marginally down from 50% last year, a 49% CASA ratio remains a structural moat. It means nearly half of the bank’s funding costs practically nothing (current accounts) or very little (savings accounts).
Asset Quality: The Crown Jewel
The most striking element of the Q1 FY27 report is the asset quality.
Gross NPA: Dropped to 1.45% from 1.74%.
Net NPA: Shrank to 0.13% from 0.18%.
When we look under the hood at the sector-wise NPAs, the management’s risk controls become evident:
Corporate NPA: An astonishingly low 0.04%. The days of reckless corporate lending are clearly over.
Retail NPA: Declined to 0.34% from 0.39%.
Agriculture NPA: Improved significantly to 7.58% from 9.65%.
MSME NPA: Stable at 1.60%.
Capital Adequacy
A bank cannot grow if it doesn’t have capital. With a Capital Adequacy Ratio (CAR) of 18.64% and a Common Equity Tier 1 (CET1) ratio of 15.56%, Bank of Maharashtra is flush with excess capital. The regulatory requirement is just 11.5%. This means the bank can continue lending aggressively for several quarters without needing to dilute equity by raising fresh capital from the market.
7. Financial Statement Analysis
Income Statement Analysis
Interest on Advances: Brought in ₹6,266 crore, confirming that core loan yields are holding up.
Interest on Investments: Contributed ₹1,724 crore.
Provisions: Provisions and contingencies stood at ₹840.41 crore, down 3.11% from ₹867.41 crore YoY. Notably, the bank reversed COVID-19 related contingency provisions amounting to ₹250 crore during the quarter, but prudently continues to hold a massive ₹760 crore buffer on the balance sheet.
Balance Sheet & Liquidity
The balance sheet demonstrates a classic “growth with stability” structure. Advances outpaced deposit growth (27% vs 13%). While a rising Credit-Deposit (CD) ratio can sometimes signal liquidity stress, the bank’s massive CASA base and zero reliance on fresh certificate-of-deposit issuances for the quarter show that funding is entirely organic and stable.
Efficiency Ratios
A Return on Assets (RoA) of 1.90% is exceptionally high for a PSU bank. Global benchmarks suggest an RoA > 1% is good, and > 1.5% is excellent. Similarly, a Return on Equity (RoE) of 24.65% means that for every ₹100 of shareholder equity, the bank is generating nearly ₹25 in pure profit annually.
8. Management Commentary
During the earnings call, management struck a tone of confident optimism, balanced with a clear focus on risk-adjusted returns.
Growth vs. Profitability:
Management explicitly stated, “We want profitable growth, not just faster growth.” Despite this conservative stance, they noted that the bank’s performance stayed comfortably above internal guidance across key measures.
Branch Expansion Strategy:
The bank outlined a strategy of opening approximately 200 branches a year, primarily in identified growth centers. Crucially, management revealed that branches opened more than three years ago have already achieved profitability. This physical footprint strategy is designed to gather stable retail deposits and build long-term franchise value.
Digital Transformation:
A massive focus was placed on technology.
The launch of the new “Zen Lyfe” mobile app achieved 1.39 million users by June 2026.
The bank implemented end-to-end digital onboarding for vehicle loans.
They rolled out digital MUDRA Straight-Through Processing (STP) for cash credit facilities up to ₹10 lakh.
ESG & Green Finance:
Management highlighted ₹6,799 crore in green finance initiatives, including substantial allocations to renewable energy (₹5,659 crore), EVs (₹465 crore), and rooftop solar.
Key Takeaway from Management: The Q1 performance is not an anomaly. It is the result of a deliberate, branch-led, retail-focused strategy layered with heavy digital infrastructure investments.
9. Market Reaction
Financial markets are forward-looking mechanisms, and the reaction to Q1 FY27 was swift and decisive.
Following the earnings release on July 10, 2026, MAHABANK shares closed 2.87% higher at ₹84.35 on the BSE, defying a somewhat volatile broader market session.
Intraday Movement: The stock opened strong and touched an intraday high of ₹87.40 before settling.
Technical Setup: Technical analysts noted that the stock rebounded sharply from the crucial 89-day Exponential Moving Average (89-DEMA), establishing ₹80 as a formidable support level.
YTD Performance: At the closing price of ₹84.42 (NSE), the stock has delivered a staggering 32.78% return on a year-to-date (YTD) basis, significantly outperforming the Nifty PSU Bank index.
The heavy trading volumes accompanying the upward price action suggest strong institutional accumulation (DII/FII buying) absorbing any retail profit-booking.
10. Peer Comparison
How does Bank of Maharashtra stack up against its state-owned peers? Here is a theoretical comparative snapshot based on typical Q1 FY27 sector trends.
| Metric | Bank of Maharashtra | Indian Bank | PNB | Union Bank |
| Market Cap (Approx) | ₹64,800 Cr | ₹1,20,000 Cr | ₹1,40,000 Cr | ₹1,05,000 Cr |
| RoA | 1.90% | ~1.30% | ~0.90% | ~1.15% |
| Gross NPA | 1.45% | 1.86% | ~4.50% | ~4.20% |
| Net NPA | 0.13% | 0.35% | ~0.60% | ~0.75% |
| CASA Ratio | 49.00% | ~40.00% | ~41.00% | ~34.00% |
| Loan Growth (YoY) | 26.90% | ~14.00% | ~12.00% | ~11.50% |
(Note: Peer data points are approximate for industry context as of Q1 FY27).
The Verdict: Bank of Maharashtra is currently operating in a league of its own regarding asset quality (1.45% GNPA) and profitability metrics (1.90% RoA), commanding a premium valuation compared to its larger, bulkier PSU counterparts.
11. SWOT Analysis
| Strengths | Weaknesses |
• Industry-leading asset quality (0.13% NNPA). • Exceptional CASA ratio of 49% providing cheap capital. • High Capital Adequacy (18.64%) allowing aggressive growth. • Strong brand equity in the wealthy state of Maharashtra. | • Lower geographical diversification compared to SBI or BOB. • Sequential (QoQ) deposit growth showed a slight dip (-1.73%). • Yields on corporate loans face intense competition from private banks. |
| Opportunities | Threats |
• Aggressive physical expansion (200 branches/year). • Monetizing the 1.39M user base on the “Zen Lyfe” app. • Rising middle-class income driving retail mortgage demand. • Cross-selling mutual funds and insurance to a captive customer base. | • RBI’s strict monitoring of unsecured retail lending. • Protracted “higher-for-longer” interest rates slowing corporate capex. • Sudden macroeconomic shocks affecting the MSME portfolio. • Intense competition for retail deposits from mutual funds and private banks. |
12. Bull Case vs Bear Case
🐂 The Bull Case (Why the stock could hit ₹100+)
The bulls argue that Bank of Maharashtra has permanently transitioned from a struggling PSU to an agile, high-growth financial institution. With ROA at 1.90% and ROE at 24.65%, the bank justifies a higher Price-to-Book (P/B) multiple. If they maintain 20%+ credit growth while keeping NPAs below 1.5%, earnings per share (EPS) will compound rapidly. The massive 98.55% provision coverage ratio means future profits won’t be eaten by legacy bad loans, allowing for higher dividend payouts or reinvestment into digital capabilities.
🐻 The Bear Case (Risks to the downside)
The bears argue that the best is already priced in. The bank is firing on all cylinders, meaning any future earnings miss will trigger a harsh multiple compression. The bears also point out that while YoY deposit growth was 13%, it actually fell 1.73% on a quarter-on-quarter basis (from ₹3,50,538 crore in March to ₹3,44,467 crore in June). If the bank cannot gather deposits fast enough to fund its 27% loan growth, it will have to rely on expensive bulk deposits, which will ultimately crush the glorious 3.85% Net Interest Margin.
13. Key Risks to Monitor
Investing in any banking stock requires a keen eye on macroeconomic and sector-specific risks:
The War for Deposits: Systemic deposit growth in India is lagging credit growth. Investors are moving money into mutual funds (SIPs) and equities. If Bank of Maharashtra is forced to hike savings or fixed deposit rates to attract capital, NIMs will compress.
Unsecured Loan Stress: While the bank’s retail NPA is currently low (0.34%), the RBI has repeatedly warned about systemic risks building up in unsecured personal consumption loans.
Macroeconomic Headwinds: A slowdown in the Indian economy would impact MSME cash flows, potentially raising the MSME NPA ratio, which currently sits at 1.60%.
Key Man Risk/Management Transition: Much of the bank’s turnaround is credited to stable leadership. Any sudden reshuffle in top PSU management can cause short-term strategic volatility.
14. Future Outlook
The runway for Bank of Maharashtra remains long and clear.
Upcoming Catalysts:
Credit Upgrade: Consistent financial performance could trigger rating upgrades for the bank’s bond issuances, further lowering their borrowing costs.
Digital Integration: The full monetization of the “Zen Lyfe” app will likely lead to lower customer acquisition costs and higher fee-based (non-interest) income in H2 FY27.
Green Finance: With a dedicated ₹6,799 crore green portfolio, the bank is positioning itself to benefit from government subsidies and international green-bond mandates.
Management Guidance Reality Check:
Management stated that advances grew 27%, which is “well above the bank’s full-year target of 18%.” This conservative 18% target suggests management expects a natural cooling off in H2, likely due to a higher base effect. Independent analysts believe a stabilized growth rate of 18-20% is highly sustainable and preferable to overheating.
15. Investor Takeaways
What does all this data mean for your portfolio?
For Long-Term Investors: Bank of Maharashtra has fundamentally transformed. It offers a rare combination of growth (27% advance growth) and safety (98.55% PCR). It deserves a place in a well-diversified financial portfolio as a robust PSU compounder.
For Swing Traders: The stock has established strong support at the ₹80 level (89-DEMA). With the breakout past ₹84 post-earnings, momentum traders will be eyeing the 52-week high of ₹94.50 as the next immediate target.
For Value Investors: The easy money (buying when it was a distressed asset) has been made. However, given the 24.65% ROE, the valuation remains reasonable compared to private peers with similar return profiles.
For Existing Shareholders: There is no fundamental reason to panic-sell. The balance sheet is the cleanest it has been in a decade. Keep holding and monitor deposit growth next quarter.
(Note: Do not consider this a direct recommendation to buy or sell. Always consult your financial advisor).
16. Conclusion
Bank of Maharashtra’s Q1 FY27 results are a masterclass in modern PSU banking. By reporting a 27% jump in net profit, maintaining a Net Interest Margin of 3.85%, and suppressing Net NPAs to a microscopic 0.13%, the bank has silenced skeptics who doubted the sustainability of its turnaround.
Biggest Positives: The 49% CASA ratio and the absolute control over corporate NPAs (0.04%).
Biggest Concern: The sequential (QoQ) decline in deposits, which is a systemic industry issue but needs careful watching.
What to Watch Next Quarter (Q2 FY27):
Investors must laser-focus on one metric in the next earnings report: Deposit Growth. If the bank can accelerate its deposit gathering without severely hiking interest rates, the stock’s upward trajectory is firmly secured.



