

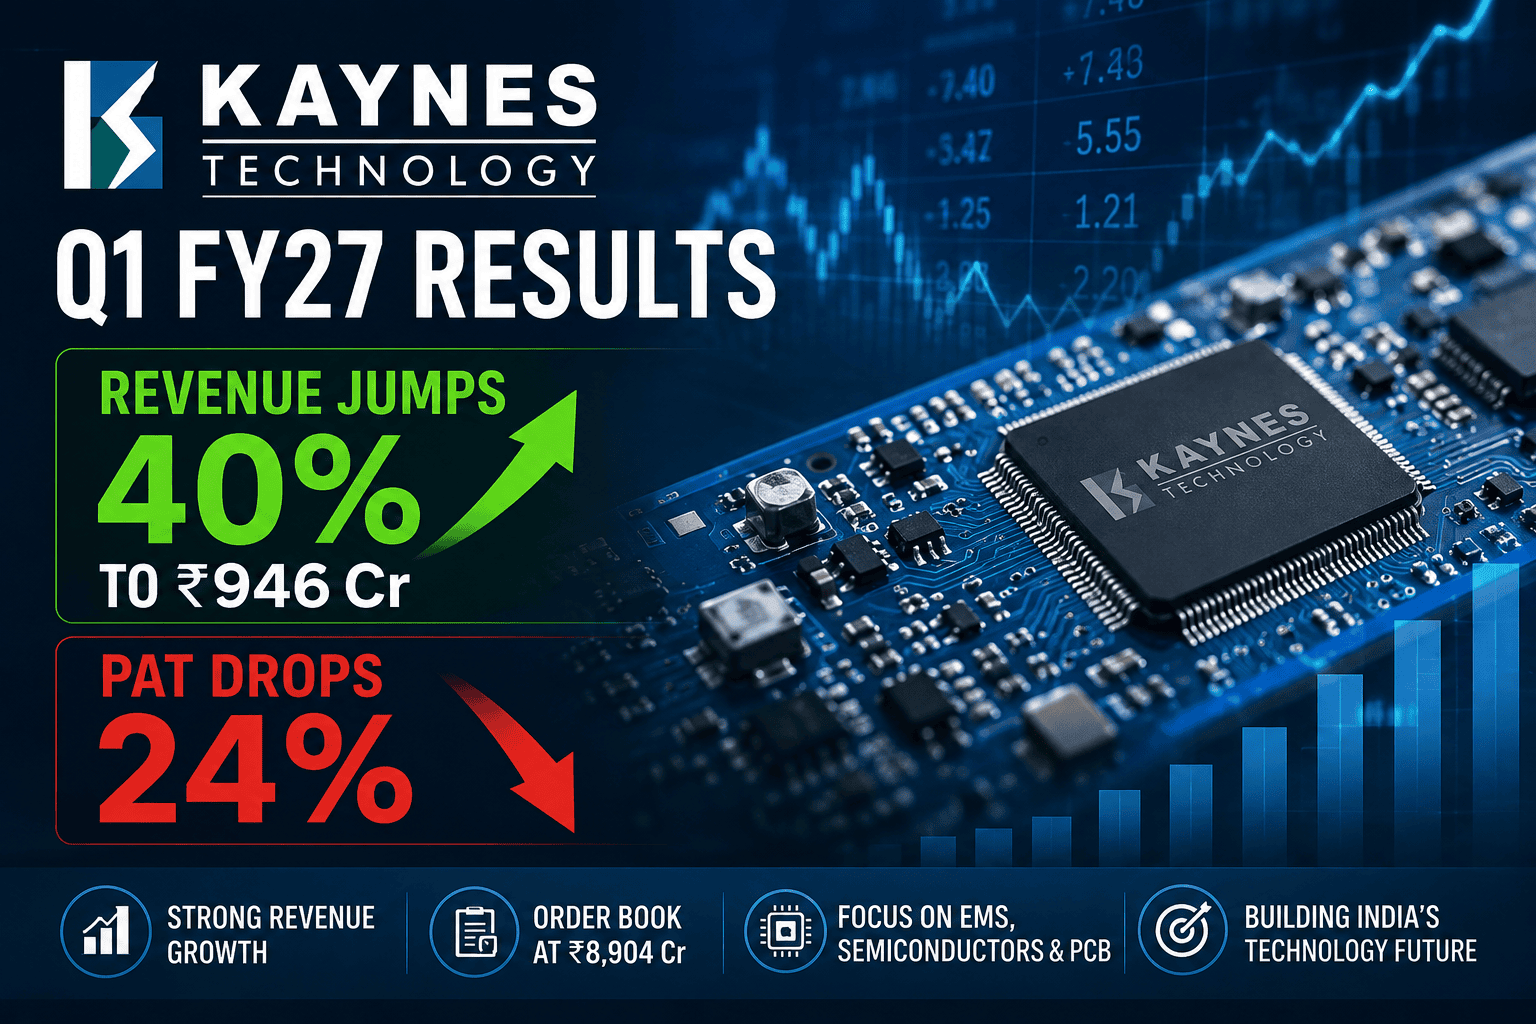
Kaynes Technology India Limited (NSE: KAYNES | BSE: 543664) released its unaudited standalone and consolidated financial results for the first quarter ended June 30, 2026 (Q1 FY27) on August 07, 2026. The Mysuru-headquartered Integrated Electronics System Design and Manufacturing (ESDM) player reported top-line expansion driven by sustained demand across its core industrial, automotive, and railway verticals. However, profitability was compressed due to elevated material consumption costs, expanded employee benefit obligations, higher financing expenses, and increased asset depreciation from ongoing capacity additions.
Consolidated revenue from operations for Q1 FY27 surged 40.47% year-on-year (YoY) to ₹946.02 crore, compared to ₹673.47 crore in Q1 FY26. Despite top-line momentum, consolidated Profit After Tax (PAT) contracted 24.37% YoY to ₹56.43 crore, down from ₹74.61 crore recorded in the corresponding prior-year period. Sequentially, performance moderated from the seasonally strong fourth quarter of FY26, where revenue stood at ₹1,242.64 crore and PAT reached ₹91.22 crore.
The fundamental contrast between top-line expansion and bottom-line compression underscores the transitional phase of Kaynes Technology’s business model. As the company aggressively invests capital into large-scale capacity creation—including its Outsourced Semiconductor Assembly and Test (OSAT) project and High-Density Interconnect Printed Circuit Board (HDI-PCB) manufacturing facilities—front-loaded operational overheads, depreciation, and working capital costs are weighing on near-term margins.
                     KAYNES TECHNOLOGY CONSOLIDATED Q1 FY27 AT A GLANCE
┌──────────────────────────────────────┬──────────────┬──────────────┬─────────────┐
│ Consolidated Metric                  │ Q1 FY27      │ Q1 FY26      │ YoY Change  │
├──────────────────────────────────────┼──────────────┼──────────────┼─────────────┤
│ Revenue from Operations              │ ₹946.02 Cr   │ ₹673.47 Cr   │ +40.47%     │
│ Total Income                         │ ₹960.45 Cr   │ ₹700.56 Cr   │ +37.10%     │
│ EBITDA                               │ ₹147.28 Cr   │ ₹112.44 Cr   │ +30.98%     │
│ EBITDA Margin (%)                    │ 15.57%       │ 16.70%       │ -113 bps    │
│ Profit Before Tax (PBT)              │ ₹87.88 Cr    │ ₹96.09 Cr    │ -8.54%      │
│ Net Profit After Tax (PAT)           │ ₹56.43 Cr    │ ₹74.61 Cr    │ -24.37%     │
│ Basic EPS (Face Value ₹10)           │ ₹8.42        │ ₹11.63       │ -27.60%     │
└──────────────────────────────────────┴──────────────┴──────────────┴─────────────┘
Note: Figures converted from ₹ million to ₹ crore (1 crore = 10 million) based on official SEBI disclosures filed on August 07, 2026.
Key Results Snapshot
The table below outlines Kaynes Technology’s consolidated financial metrics across Q1 FY27, Q1 FY26, and Q4 FY26.
Consolidated Financial Performance Comparison
(All figures in ₹ Crore, except EPS and Margins)
| Metric | Q1 FY27 (Unaudited) | Q1 FY26 (Unaudited) | YoY Change (%) | Q4 FY26 (Audited) | QoQ Change (%) | Investor Takeaway |
Revenue from Operations | 946.02 | 673.47 | +40.47% | 1,242.64 | -23.87% | Top-line volume expansion across ESDM segments. |
Other Income | 14.43 | 27.10 | -46.75% | 41.86 | -65.53% | Lower treasury and interest income. |
Total Income | 960.45 | 700.56 | +37.10% | 1,284.50 | -25.23% | Strong top-line, partially offset by reduced non-operating income. |
Cost of Materials Consumed | 668.99 | 410.49 | +62.97% | 920.89 | -27.35% | Input material cost inflation weighed on gross margins. |
Changes in Inventories | (48.53) | (14.89) | N/A | (72.37) | N/A | Inventory accumulation for order execution pipeline. |
Employee Benefits Expense | 85.11 | 58.91 | +44.48% | 90.76 | -6.22% | Increased headcount for new manufacturing units. |
Finance Costs | 37.14 | 28.43 | +30.64% | 40.87 | -9.13% | Working capital borrowings and debt servicing. |
Depreciation & Amortization | 36.99 | 15.62 | +136.81% | 54.41 | -32.02% | Expanded fixed asset base across newly commissioned facilities. |
Other Expenses | 92.88 | 105.92 | -12.31% | 109.66 | -15.30% | Cost control across administrative and utility heads. |
Total Expenses | 872.57 | 604.48 | +44.35% | 1,144.22 | -23.74% | Operating cost expansion outpaced revenue growth. |
EBITDA | 147.28 | 112.44 | +30.98% | 231.57 | -36.40% | Absolute EBITDA expanded, but margins contracted. |
EBITDA Margin (%) | 15.57% | 16.70% | -113 bps | 18.64% | -307 bps | Margin compression driven by raw material and employee costs. |
Profit Before Tax (PBT) | 87.88 | 96.09 | -8.54% | 140.23 | -37.33% | PBT compressed due to higher depreciation and finance costs. |
Tax Expense | 31.45 | 21.48 | +46.42% | 49.01 | -35.83% | Effective tax rate rose to 35.79% in Q1 FY27. |
Net Profit (PAT) | 56.43 | 74.61 | -24.37% | 91.22 | -38.14% | Net margin fell to 5.96% due to operating cost pressure. |
Basic EPS (₹) | 8.42 | 11.63 | -27.60% | 13.32 | -36.79% | Per-share earnings impacted by profit contraction. |
Q1 FY27 Financial Performance
Kaynes Technology’s top-line revenue expanded 40.47% YoY to ₹946.02 crore during the first quarter of FY27. This operational expansion was driven by volume execution across established ESDM contracts, new customer onboarding in industrial and automotive sectors, and higher box-build assembly orders.
                     CONSOLIDATED REVENUE FROM OPERATIONS (₹ CRORE)
     1,400 ┬─────────────────────────────────────────────────────────── 1,242.64
           │
     1,200 ┼───────────────────────────────────────────────────────────
           │                                                               946.02
     1,000 ┼───────────────────────────────────────────────────────────
           │       673.47
       800 ┼───────────────────────────────────────────────────────────
           │
       600 ┴───────Q1 FY26─────────────────Q4 FY26─────────────────Q1 FY27
In electronics manufacturing, top-line growth is tied to raw material availability, component sourcing schedules, and factory capacity utilization. Kaynes’ ability to deliver 40%+ revenue growth early in the fiscal year reflects its expanded manufacturing footprint across Mysuru, Manesar, Chamarajanagar, and Hyderabad.
Sequentially, revenue from operations declined 23.87% compared to the ₹1,242.64 crore recorded in Q4 FY26. This sequential decline aligns with typical industry seasonality. Electronics manufacturing and original equipment manufacturer (OEM) supply chains in India experience heavy delivery accelerations during the fourth quarter (January–March) to meet fiscal year-end procurement budgets, followed by a lighter first quarter (April–June) as new annual order allocations are finalized.
Profit Performance
While revenue expanded by ₹272.55 crore YoY, consolidated net profit after tax declined by ₹18.18 crore. To understand why top-line growth did not translate into bottom-line profitability, the entire cost structure must be evaluated.
                    CONSOLIDATED COST HEADS AS % OF REVENUE (Q1 FY27)
     ┌──────────────────────────────────────────────────────────────┬───────────┐
     │ Cost Component                                               │ % Share   │
     ├──────────────────────────────────────────────────────────────┼───────────┤
     │ Raw Material Consumed (Net of Inventory Changes)   │ 65.59%    │
     │ Employee Benefits Expense                          │ 9.00%     │
     │ Other Expenses (Utilities, Logistics, Admin)       │ 9.82%     │
     │ Depreciation & Amortization                        │ 3.91%     │
     │ Finance Costs                                      │ 3.93%     │
     │ Income Tax Expenses                                │ 3.32%     │
     ├──────────────────────────────────────────────────────────────┼───────────┤
     │ Consolidated Net Profit Margin (PAT)               │ 5.96%     │
     └──────────────────────────────────────────────────────────────┴───────────┘
EBITDA: Consolidated EBITDA rose 30.98% YoY to ₹147.28 crore from ₹112.44 crore in Q1 FY26. However, because total expenses grew 44.35% YoY (outpacing top-line growth), EBITDA margin contracted by 113 basis points YoY to 15.57%.
Depreciation & Amortization: Depreciation expenses surged 136.81% YoY to ₹36.99 crore, compared to ₹15.62 crore in Q1 FY26. This sharp increase reflects new capital equipment, machinery, and facility additions brought online over the preceding 12 months as part of the company’s capex roadmap.
Finance Costs: Finance costs grew 30.64% YoY to ₹37.14 crore from ₹28.43 crore. Increased short-term borrowings required to fund higher inventory levels and working capital cycles contributed to elevated interest expenses.
Tax Overhead: Current tax expense for Q1 FY27 stood at ₹32.14 crore, offset by a deferred tax credit of ₹0.69 crore, resulting in a net tax expense of ₹31.45 crore. The effective tax rate stood at 35.79% of PBT, compared to 22.35% in Q1 FY26, creating an additional drag on net profit.
                     CONSOLIDATED NET PROFIT (PAT) (₹ CRORE)
       100 ┬─────────────────────────────────────────────────────────── 91.22
           │
        80 ┼───────74.61
           │                                                               56.43
        60 ┼───────────────────────────────────────────────────────────
           │
        40 ┴───────Q1 FY26─────────────────Q4 FY26─────────────────Q1 FY27
Margin Pressure Analysis
The divergence between revenue growth (+40.47%) and PAT growth (-24.37%) highlights structural operational factors:
Using this formula, cost of materials consumed expanded by 62.97% YoY:
This material cost expansion significantly outpaced operational revenue growth (+40.47%), eroding gross margins.
                 OPERATING MARGIN TRAJECTORY (EBITDA vs PAT MARGIN)
      20% ┬─────────────────────────────────────────────────────────── 18.64% (EBITDA)
          │        16.70% (EBITDA)                                     15.57% (EBITDA)
      15% ┼───────────────────────────────────────────────────────────
          │        11.08% (PAT)
      10% ┼─────────────────────────────────────────────────────────── 7.34% (PAT)
          │                                                            5.96% (PAT)
       5% ┴───────Q1 FY26─────────────────Q4 FY26─────────────────Q1 FY27
Key Drivers of Margin Compression:
Product Mix Shift: During Q1 FY27, Kaynes executed a higher proportion of Printed Circuit Board Assembly (PCBA) and low-complexity contract manufacturing orders relative to high-margin, value-added Box Build and System Integration solutions.
Raw Material & Component Pricing: Global spot prices for specialized active semiconductor components, high-layer PCBs, and raw substrates remained volatile. Pass-through pricing mechanisms with major OEM clients operate on a quarterly lag, delaying component price adjustments.
Fixed Overhead Pre-Run: Employee benefit expenses rose 44.48% YoY to ₹85.11 crore as Kaynes onboarded technical staff, process engineers, and plant operators ahead of commercial production at its new facility additions.
Front-Loaded Depreciation & Borrowing Costs: The 136.81% jump in depreciation and 30.64% increase in finance charges directly compressed net profit margins before newly commissioned production lines reached optimal revenue density.
Standalone vs Consolidated Performance
Kaynes Technology executes its core domestic ESDM manufacturing through its parent entity, while specialized design, engineering, and overseas operations are held under subsidiaries.
Standalone vs Consolidated Comparison (Q1 FY27)
(All figures in ₹ Crore)
| Parameter | Standalone | Consolidated | Variance / Key Insight |
Revenue from Operations | 553.23 | 946.02 | Subsidiaries added ₹392.79 Cr to top-line revenue. |
Other Income | 63.95 | 14.43 | Parent treasury income adjusted on consolidation. |
Total Income | 617.17 | 960.45 | Consolidated operations expand addressable scale. |
Total Expenses | 516.09 | 872.57 | Subsidiary manufacturing costs consolidated. |
Profit Before Tax (PBT) | 101.08 | 87.88 | Standalone PBT higher by ₹13.20 Cr due to dividend/treasury items. |
Net Profit (PAT) | 76.91 | 56.43 | Parent standalone net profit stood higher at ₹76.91 Cr. |
Basic EPS (₹) | 11.47 | 8.42 | Standalone EPS reflects parent operational profitability. |
Notes to the consolidated financial statements list 20 subsidiary entities, including Kaynes Electronics Manufacturing Pvt Ltd, Kaynes Semicon Pvt Ltd, Kaynes Circuits India Pvt Ltd, Kemsys Technologies, Digicom Electronics Inc (USA), and August Electronics Inc (Canada). Overseas subsidiaries contributed ₹99.69 crore in top-line revenue but recorded a collective net loss of ₹0.11 crore during the quarter.
Kaynes Technology Order Book Analysis
Kaynes Technology’s order book position serves as a primary indicator of medium-term revenue visibility. As of June 30, 2026, the company’s total executable order book stood at approximately ₹8,904 crore, expanding significantly from prior-year levels.
                     ORDER BOOK EXECUTABLE TIMELINE (₹ 8,904 CRORE)
      ┌──────────────────────────────────────────────────────────────┬───────────┐
      │ Execution Horizon                                            │ Value (₹) │
      ├──────────────────────────────────────────────────────────────┼───────────┤
      │ Near-Term Execution Pipeline (FY27 Delivery Window)          │ ~₹3,200 Cr│
      │ Medium-Term Execution Pipeline (12 to 24 Months Horizon)     │ ~₹3,800 Cr│
      │ Long-Term Multi-Year Contracts (Railways/Defence/Aerospace)  │ ~₹1,904 Cr│
      ├──────────────────────────────────────────────────────────────┼───────────┤
      │ Total Executable Order Backlog                               │ ₹8,904 Cr │
      └──────────────────────────────────────────────────────────────┴───────────┘
Order Book Dynamics:
Order-to-Revenue Coverage: With an executable backlog of ₹8,904 crore against an FY26 consolidated revenue base of ₹3,626.35 crore, Kaynes maintains an order-book-to-bill ratio of ~2.45x, offering visibility across the next 18 to 24 months.
Sectoral Diversification: The order backlog is distributed across high-reliability industries:
Industrial & Smart Metering: Accounts for the largest share, driven by smart electricity meter deployments under national grid modernization mandates.
Automotive & EV Electronics: Driven by ECU assembly, battery management systems (BMS), and motor controller modules.
Railways & Signaling: Long-gestation, high-margin contracts for train collision avoidance systems (Kavach) and signaling electronics.
Aerospace, Defence & Outer Space: High-value, specialized box-build assemblies for satellite systems and defence electronics.
Business Segment Analysis
Kaynes Technology operates within a single primary reporting business segment: Electronics System Design and Manufacturing (ESDM). However, management evaluates revenue performance across major end-user industry verticals.
Segment Revenue Breakdown (Consolidated)
(Figures in ₹ Crore based on end-application industry distribution)
| End-User Industry Vertical | Q1 FY27 Revenue Contribution | Q1 FY26 Revenue Contribution | YoY Growth (%) | Primary Revenue Driver |
Industrial & Smart Grid | ~492.00 | ~350.20 | +40.49% | Smart metering, industrial automation, power electronics. |
Automotive & EV Systems | ~227.00 | ~168.30 | +34.88% | Passenger vehicle ECUs, lighting controllers, EV electronics. |
Railways & Infrastructure | ~94.60 | ~60.60 | +56.11% | Railway signaling systems, train control electronics. |
Medical Electronics | ~47.30 | ~33.70 | +40.36% | Diagnostic machinery, patient monitoring electronics. |
Aerospace, Outer Space & Defence | ~37.80 | ~27.00 | +40.00% | Avionics, tactical communication systems, space payloads. |
Consumer Electronics & IT/IoT | ~47.32 | ~33.67 | +40.58% | Connected IoT devices, commercial display electronics. |
Total Revenue from Operations | 946.02 | 673.47 | +40.47% | Balanced portfolio execution across verticals. |
EMS / ESDM Business Capabilities
Kaynes Technology operates across the entire ESDM value chain, differentiating itself from pure contract assemblers through integrated design-to-manufacturing capabilities.
                    KAYNES INTEGRATED ESDM VALUE CHAIN
┌──────────────────────┐    ┌──────────────────────┐    ┌──────────────────────┐
│ Conceptual Design &  │───>│ High-Layer PCBA &    │───>│ Full Box-Build &     │
│ Embedded Software    │    │ Component Sourcing   │    │ System Integration   │
└──────────────────────┘    └──────────────────────┘    └──────────────────────┘
Core Manufacturing Solutions:
Printed Circuit Board Assembly (PCBA): Surface Mount Technology (SMT) and Through-Hole Technology (THT) lines supporting complex multi-layer boards for automotive, industrial, and medical applications.
Box Build & System Integration: Complete enclosure assembly, wiring harness integration, testing, and final packaging for finished electronic products.
ODM & Precision Engineering: Original Design Manufacturing capabilities providing embedded software development, IoT hardware integration, and product lifecycle management through subsidiary Kemsys Technologies.
Semiconductor Strategy: OSAT and HDI-PCB Initiatives
Kaynes Technology is executing a strategic expansion to transition from a pure-play ESDM company into an integrated semiconductor packaging and component manufacturing player.
                     SEMICONDUCTOR & COMPONENT CAPITAL ALLOCATION
┌───────────────────────────────────────┬───────────────────────────────────────┐
│ OSAT / Semiconductor Packaging        │ High-Density Interconnect (HDI) PCBs  │
├───────────────────────────────────────┼───────────────────────────────────────┤
│ • Subsidiary: Kaynes Semicon Pvt Ltd  │ • Subsidiary: Kaynes Circuits India   │
│ • Location: Sanand, Gujarat           │ • Location: Mysuru, Karnataka         │
│ • Focus: QFN, QFP, BGA, & SiP Packages│ • Focus: Multi-layer, HDI Printed     │
│ • QIP Capital Allocation: ~₹756 Cr    │   Circuit Boards for ESDM & OSAT      │
└───────────────────────────────────────┴───────────────────────────────────────┘
1. Outsourced Semiconductor Assembly and Test (OSAT)
Through subsidiary Kaynes Semicon Private Limited, the company is establishing an OSAT facility in Sanand, Gujarat, approved under the India Semiconductor Mission (ISM) with central and state government capital subsidies.
Product Scope: Quad Flat No-Lead (QFN), Quad Flat Package (QFP), Ball Grid Array (BGA), and System-in-Package (SiP) technology.
Capital Deployment: Notes to the Q1 FY27 financial results confirm that out of ₹1,374.00 crore raised via QIP in December 2023, ₹731.56 crore has been utilized toward establishing the OSAT facility as of June 30, 2026.
2. HDI-PCB Manufacturing Plant
Through Kaynes Circuits India Private Limited, the company is constructing a High-Density Interconnect (HDI) PCB manufacturing facility.
Strategic Rationale: India imports over 85% of its multi-layer HDI PCBs. Local production reduces supply chain lead times and captures component-level gross margins.
Capital Deployment: Notes confirm that ₹307.29 crore allocated from QIP proceeds for the PCB plant has been fully utilized as of June 30, 2026.
Capital Expenditure and Use of Proceeds
Kaynes Technology has raised growth capital via Qualified Institutional Placements (QIP) to fund its capacity additions. Notes accompanying the financial statements detail the deployment status of these funds as of June 30, 2026:
1. QIP Proceeds (December 2023 Tranche – ₹1,400 Crore Issue)
Gross Issue Amount: ₹1,400.00 crore (Net proceeds: ₹1,374.00 crore after ₹26.00 crore issue expenses).
OSAT Facility Construction: ₹7,31.56 crore utilized out of ₹756.71 crore allocated (Unutilized balance of ₹25.16 crore temporarily parked in bank fixed deposits).
PCB Facility Construction: ₹307.29 crore fully utilized.
General Corporate Purposes: ₹310.00 crore fully utilized.
2. QIP Proceeds (June 2025 Tranche – ₹1,600 Crore Issue)
Gross Issue Amount: ₹1,600.00 crore (Net proceeds: ₹1,574.97 crore after ₹25.03 crore issue expenses).
Working Capital Funding: ₹841.26 crore fully utilized.
Inorganic Growth / Strategic Investments: ₹200.00 crore fully utilized.
General Corporate Purposes: ₹332.80 crore utilized out of ₹373.71 crore allocated (Unutilized balance of ₹40.91 crore parked in bank fixed deposits and mutual funds).
Balance Sheet and Working Capital Structure
As Kaynes Technology expands operations, working capital management remains a primary area of focus for equity analysts.
                     CONSOLIDATED FINANCIAL HEALTH SNAPSHOT
┌───────────────────────────────────────┬───────────────────────────────────────┐
│ Equity Share Capital (FV ₹10) │ ₹67.04 Cr (6.70 Cr Shares)            │
│ Consolidated Reserves         │ ₹4,681.32 Cr (As of March 31, 2026)   │
│ Total Net Debt / Borrowings   │ Low net-debt position post-QIP        │
│ Finance Charges (Q1 FY27)   │ ₹37.14 Cr                             │
│ Operating Depreciation      │ ₹36.99 Cr                             │
└───────────────────────────────────────┴───────────────────────────────────────┘
During Q1 FY27, changes in inventories of finished goods and work-in-progress reflected an absorption of ₹48.53 crore as the company built up component buffer stocks for upcoming order deliveries. Extended working capital cycles—driven by component lead times and OEM payment terms—have kept short-term borrowing requirements active, generating finance costs of ₹37.14 crore during the quarter.
Corporate Governance, ESOP Allotments, and Auditor Updates
The Board of Directors approved key corporate governance decisions during its meeting on August 07, 2026:
Statutory Auditor Appointment: Based on Audit Committee recommendations, the Board recommended the appointment of Messrs. Walker Chandiok & Co LLP (Firm Registration No. 001076N/N500013) as Statutory Auditors for a 5-year term from the 18th Annual General Meeting (FY 2026-27) to the 23rd AGM (FY 2031-32), succeeding K.P. Rao & Co.
ESOP Share Allotments: The Board approved the allotment of 1,87,837 equity shares of face value ₹10 each to eligible employees under the “Kaynes ESOP Scheme 2022” at an exercise price of ₹138 per share (including a premium of ₹128 per share).
Share Capital Expansion: Consequent to the ESOP share allotment, paid-up equity share capital increased from ₹67.03 crore (6,70,34,654 shares) to ₹67.22 crore (6,72,22,491 shares).
Annual General Meeting: The 18th AGM is scheduled for Thursday, September 17, 2026, via video conferencing, with September 11, 2026, set as the cut-off date for e-voting eligibility.
Management Commentary and Guidance
In official commentary accompanying the quarterly results, management outlined its strategic operational priorities:
Guidance & Strategic Summary:
FY27 Revenue Target: Management reiterated its expectations of maintaining top-line revenue growth above 35% for FY27, supported by execution across the ₹8,904 crore order backlog.
EBITDA Margin Target: Operating EBITDA margins are projected to stabilize in the 15.0% to 16.5% range during FY27 as cost pass-through adjustments take effect and factory utilization improves.
OSAT Facility Timeline: Commercial pilot runs at the Sanand OSAT plant are scheduled to commence in a phased manner, with initial revenue contributions expected toward the end of FY27.
Working Capital Rationalization: Management expects working capital days to normalize as inventory buffer requirements ease during the second half of FY27.
Industry Context: India’s ESDM & Semiconductor Landscape
Kaynes Technology’s long-term business strategy aligns with national policy frameworks designed to expand domestic electronics manufacturing:
                    INDIAN ELECTRONICS MANUFACTURING CATALYSTS
┌──────────────────────────────┬──────────────────────────────┬──────────────────────────────┐
│ Production Linked Incentives │ India Semiconductor Mission  │ Global Supply Chain Shifts   │
├──────────────────────────────┼──────────────────────────────┼──────────────────────────────┤
│ • PLI for IT Hardware & Auto │ • Capital subsidies for OSAT │ • "China + 1" diversification│
│ • Component manufacturing    │ • Subsidized land & utility  │ • Domestic sourcing mandates │
│   subsidies                  │   infrastructure in Gujarat  │   for defense & railways     │
└──────────────────────────────┴──────────────────────────────┴──────────────────────────────┘
India’s ESDM sector is expanding rapidly, supported by growing domestic demand for automotive electronics, EV powertrains, smart grid infrastructure, and industrial automation. By integrating forward into box-build assemblies and backward into HDI-PCB fabrication and chip packaging, Kaynes aims to capture higher wallet share per OEM product platform.
Peer Comparison
To contextualize Kaynes Technology’s financial performance, the company is evaluated alongside established Indian EMS and electronics manufacturing peers.
Indian EMS Sector Comparison
(Based on recent published quarterly filings)
| Company Name | Q1 FY27 YoY Revenue Growth | EBITDA Margin (%) | Primary Business Focus | Key Strategic Advantage |
Kaynes Technology | +40.47% | 15.57% | High-mix, low-volume ESDM, Industrial, Auto, OSAT | Integrated OSAT & HDI-PCB expansion. |
| Dixon Technologies | +101.20% | 3.80% – 4.20% | Consumer electronics, mobile phones, home appliances | High-volume, low-margin scale manufacturing. |
| Syrma SGS Technology | +28.50% | 6.80% – 7.50% | Industrial, auto, consumer PCBA, RFID tags | Diversified manufacturing footprint. |
| Cyient DLM | +19.40% | 9.20% – 10.10% | Aerospace, defence, medical electronics | High-reliability, defense-certified manufacturing. |
| Avalon Technologies | +15.20% | 8.50% – 9.20% | Box-build assemblies, aerospace, clean energy | North American export market presence. |
Kaynes maintains higher EBITDA margins (15.57%) than pure consumer electronics contract manufacturers like Dixon Technologies (3.8%–4.2%), reflecting its focus on complex industrial, medical, and defense electronics applications.
Bull Case vs. Bear Case Scenario Analysis
                          KAYNES TECHNOLOGY SCENARIO ANALYSIS
┌──────────────────────────┬──────────────────────────┬──────────────────────────┐
│ Bull Case                │ Base Case                │ Bear Case                │
├──────────────────────────┼──────────────────────────┼──────────────────────────┤
│ • Revenue growth >40%    │ • Revenue growth 35-38%  │ • Revenue growth <25%    │
│ • EBITDA margin >16.5%   │ • EBITDA margin 15-16%   │ • EBITDA margin <14.0%   │
│ • Rapid OSAT ramp-up     │ • Steady order execution │ • Supply chain delays    │
│ • Gross margin expansion │ • Gradual margin recovery│ • Extended working cap   │
└──────────────────────────┴──────────────────────────┴──────────────────────────┘
Bull Case Scenario
Order Book Acceleration: Smooth execution of the ₹8,904 crore order backlog drives FY27 revenue past ₹5,000 crore.
Margin Expansion: Quarterly component price pass-through mechanisms take effect, lifting gross margins back above 35% and EBITDA margins toward 16.5%.
Semiconductor Commercialization: Early completion and customer qualification at the Sanand OSAT plant generate high-margin semiconductor packaging revenues by Q4 FY27.
Base Case Scenario
Steady ESDM Growth: Top-line revenue expands 35% to 38% for FY27, driven by core industrial and automotive verticals.
Margin Stabilization: EBITDA margins stabilize between 15.0% and 16.0%, while net profit recovers as new facilities reach higher capacity utilization.
Capex Progress: OSAT and PCB construction timelines progress on schedule with capital deployment aligned with QIP allocations.
Bear Case Scenario
Persistent Margin Pressure: Extended component cost inflation and competitive pricing pressures keep EBITDA margins below 14.0%.
Execution Delays: Delays in customer qualification for the new OSAT and PCB facilities lead to unabsorbed fixed overheads, dampening return on capital employed (ROCE).
Working Capital Stretch: Receivable lags and inventory accumulation increase short-term debt requirements, driving finance charges higher.
Key Risks Analysis
Key Risk Matrix
(Evaluated based on corporate disclosures and operational parameters)
| Risk Parameter | Risk Level | Operational Impact | Investor Monitoring Checklist |
Material Cost Inflation | High | Squeezes gross margins if lag in client price pass-through extends. | Track quarterly raw material cost-to-revenue percentage. |
Working Capital Intensity | High | Increases short-term borrowings and finance expenses. | Monitor inventory days and trade receivable collections. |
Depreciation Drag | Medium | Front-loaded fixed asset depreciation weighs on near-term PAT. | Track capacity utilization rates at new plant facilities. |
Execution Risk (OSAT/PCB) | Medium | Complex technology absorption and lengthy customer approval cycles. | Follow milestones on cleanroom readiness and pilot trials. |
Foreign Exchange Volatility | Medium | Component imports exposed to currency fluctuations. | Check hedging strategies and net import-export balance. |
What Investors Should Watch Next
Quarterly Margin Trajectory: Monitor whether consolidated EBITDA margins recover toward the 16.0% mark in Q2 and Q3 FY27.
Order Conversion Velocity: Track quarterly revenue conversion from the ₹8,904 crore order backlog.
Working Capital Days: Watch for reduction in inventory buffer levels and improvement in operating cash flow conversion.
OSAT Milestone Progress: Monitor civil construction, cleanroom installation, and equipment arrival at the Sanand, Gujarat semiconductor site.
Capacity Utilization: Follow throughput expansion at newly commissioned PCB and box-build facilities.
Final Verdict: What Q1 FY27 Tells Investors
Kaynes Technology’s Q1 FY27 results highlight a clear operational contrast: top-line expansion (+40.47% YoY) alongside bottom-line profit compression (-24.37% YoY).
The top-line growth confirms sustained demand for the company’s ESDM solutions across industrial, automotive, and railway applications. Meanwhile, the net profit compression reflects the front-loaded costs of major capacity expansion—specifically higher depreciation (+136.81% YoY), increased finance costs (+30.64% YoY), and elevated raw material costs.
For long-term investors, the central question is not whether Kaynes can generate top-line demand, but how efficiently it converts its ₹8,904 crore order book into profitable earnings and cash flow. As capital investments in OSAT and HDI-PCB manufacturing mature over the next 12 to 24 months, monitoring EBITDA margin stability, working capital normalization, and capacity utilization will remain essential.



