

INTRODUCTION
Britannia Industries Limited, India’s leading food and bakery company, released its unaudited consolidated and standalone financial results for the first quarter of fiscal year 2027 (Q1 FY27, ended June 30, 2026) following its board meeting on August 6, 2026. The quarterly earnings report offers a clear look at consumer demand dynamics across urban and rural India, raw material inflation management, and international supply chain resilient execution.
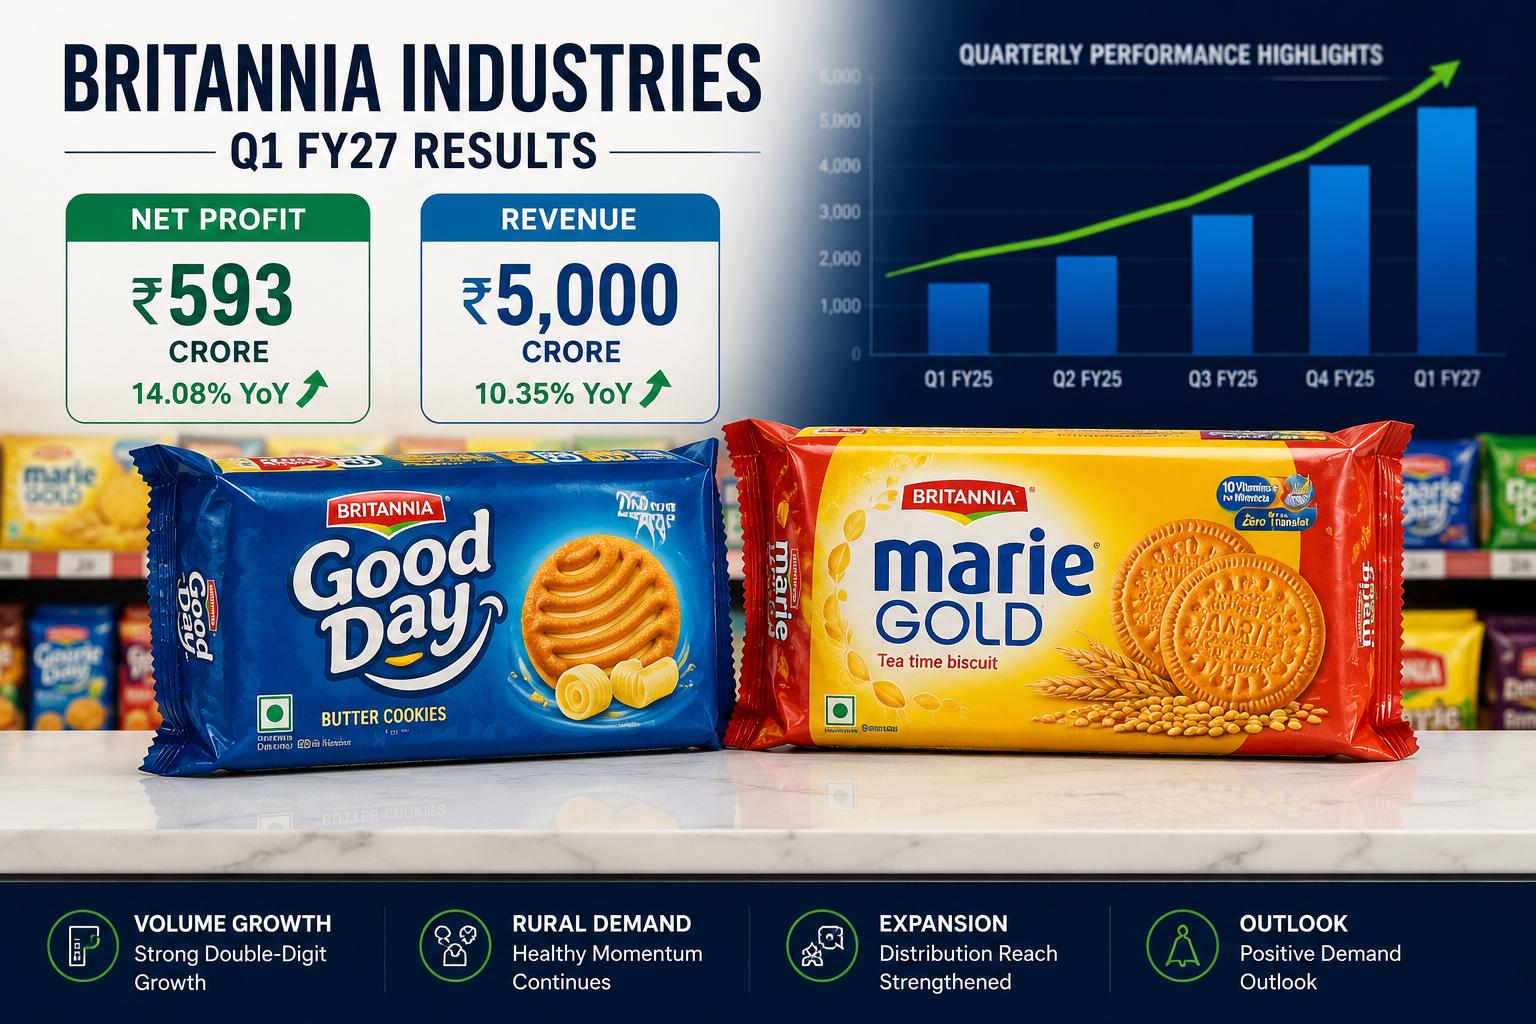
In an environment marked by shifting domestic consumption trends, heightened local competition, and global geopolitical frictions—specifically West Asia supply disruptions that escalated freight costs—Britannia delivered strong top-line and bottom-line expansion. Consolidated revenue from operations grew 8.17% year-on-year (YoY) to reach ₹4,999.97 crore, while consolidated net profit after tax (PAT) rose 14.08% YoY to ₹593.38 crore.
Understanding Britannia’s operational quarter matters to investors for multiple reasons:
FMCG Consumption Proxy: Britannia’s volume trajectory acts as a direct proxy for Indian household discretionary spending across core staples and packaged treats.
Margin Execution Under Inflation: The company demonstrated pricing power and operational efficiencies across raw material and shipping cost spikes.
Omnichannel Distribution Velocity: Rapid scaling across quick-commerce, modern trade, and rural general trade networks provided operational tailwinds.
EXECUTIVE SUMMARY
The executive summary table below highlights Britannia Industries Limited’s primary consolidated financial parameters for Q1 FY27 alongside comparison benchmarks:
| Financial Metric | Q1 FY27 (June 30, 2026) | Q1 FY26 (June 30, 2025) | YoY Growth (%) |
Total Revenue from Operations | ₹4,999.97 Cr | ₹4,622.22 Cr | +8.17% |
Revenue from Sale of Goods | ₹4,964.37 Cr | ₹4,534.86 Cr | +9.47% |
Total Income | ₹5,061.38 Cr | ₹4,679.23 Cr | +8.16% |
Cost of Materials Consumed | ₹2,799.56 Cr | ₹2,550.87 Cr | +9.75% |
Employee Benefits Expense | ₹209.60 Cr | ₹241.86 Cr | -13.34% |
Total Expenses | ₹4,262.24 Cr | ₹3,973.36 Cr | +7.27% |
Profit Before Tax (PBT) | ₹797.35 Cr | ₹701.02 Cr | +13.74% |
Consolidated Net Profit (PAT) | ₹593.38 Cr | ₹520.13 Cr | +14.08% |
PAT Attributable to Owners | ₹591.35 Cr | ₹520.72 Cr | +13.56% |
Basic Earnings Per Share (EPS) | ₹24.55 | ₹21.62 | +13.55% |
EBITDA (Calculated) | ₹901.52 Cr | ₹814.01 Cr | +10.75% |
EBITDA Margin (%) | 18.03% | 17.61% | +42 bps |
PAT Margin (%) | 11.87% | 11.25% | +62 bps |
| Volume Growth (Estimated) | ~5.5% – 6.0% | — | Broad-Based Expansion |
| E-Commerce Contribution | Rapid Scaling (Mid-teens) | — | Expanding Market Share |
COMPANY SNAPSHOT TABLE
| Parameter | Details |
| Founded | 1892 (Incorporated 1918) |
| Headquarters | Executive: Bengaluru, Karnataka |
| Industry | Fast-Moving Consumer Goods (FMCG) / Packaged Foods |
| Core Product Lines | Biscuits, Bread, Cakes, Rusk, Dairy, Cheese, Wafers, Healthy Snacks |
| Flagship Brands | Good Day, Marie Gold, Tiger, NutriChoice, Milk Bikis, Treat, Bourbon, Little Hearts |
| Market Capitalization | ₹1,30,165 Crore (~$15.5 Billion USD) |
Promoter Group | Wadia Group (50.55% shareholding) |
Executive Leadership | Chairman: Nusli N. Wadia |
| Distribution Reach | Over 6 Million Retail Touchpoints across India |
Global Footprint | Presence across 80+ Countries (Subsidiaries in UAE, Oman, Nepal, Bangladesh, Kenya, Egypt, Uganda) |
Q1 FY27 FINANCIAL HIGHLIGHTS
The detailed financial tables below present Britannia Industries Limited’s quarterly performance across consolidated and standalone operations:
Unaudited Consolidated Financial Performance
| Particulars (₹ in Crore) | Q1 FY27 (Unaudited) | Q4 FY26 (Audited) | Q1 FY26 (Unaudited) | YoY Growth (%) | QoQ Growth (%) |
Sale of Goods | 4,964.37 | 4,685.95 | 4,534.86 | +9.47% | +5.94% |
Other Operating Revenue | 35.60 | 32.97 | 87.36 | -59.25% | +7.98% |
Total Revenue from Operations | 4,999.97 | 4,718.92 | 4,622.22 | +8.17% | +5.96% |
Other Income | 61.41 | 55.45 | 57.01 | +7.72% | +10.75% |
Total Income | 5,061.38 | 4,774.37 | 4,679.23 | +8.16% | +6.01% |
Cost of Materials Consumed | 2,799.56 | 2,489.01 | 2,550.87 | +9.75% | +12.48% |
Purchases of Stock-in-Trade | 139.61 | 207.62 | 206.80 | -32.49% | -32.76% |
Changes in Inventories | (14.22) | 34.43 | 1.43 | N/A | N/A |
Employee Benefits Expense | 209.60 | 186.13 | 241.86 | -13.34% | +12.61% |
Finance Costs | 22.87 | 18.68 | 26.15 | -12.54% | +22.43% |
Depreciation & Amortization | 79.51 | 85.23 | 82.04 | -3.08% | -6.71% |
Other Expenses | 1,025.31 | 948.86 | 864.21 | +18.64% | +8.06% |
Total Expenses | 4,262.24 | 3,969.96 | 3,973.36 | +7.27% | +7.36% |
Share of Loss in JV / Associates | (1.79) | (19.30) | (4.85) | -63.09% | -90.73% |
Profit Before Tax (PBT) | 797.35 | 785.11 | 701.02 | +13.74% | +1.56% |
Tax Expense | 203.97 | 105.43 | 180.89 | +12.76% | +93.47% |
Net Profit After Tax (PAT) | 593.38 | 679.68 | 520.13 | +14.08% | -12.70% |
Basic EPS (₹) | 24.55 | 28.16 | 21.62 | +13.55% | -12.82% |
Standalone Financial Performance
| Particulars (₹ in Crore) | Q1 FY27 (Unaudited) | Q4 FY26 (Audited) | Q1 FY26 (Unaudited) | YoY Growth (%) |
Total Revenue from Operations | 4,833.50 | 4,553.04 | 4,452.74 | +8.55% |
Profit Before Tax (PBT) | 778.90 | 787.58 | 674.20 | +15.53% |
Net Profit After Tax (PAT) | 576.38 | 685.47 | 498.27 | +15.68% |
Basic EPS (₹) | 23.93 | 28.45 | 20.69 | +15.66% |
KEY PERFORMANCE INDICATORS
Britannia Q1 FY27 Revenue Growth Drivers
├── Sale of Goods:        ₹4,964.37 Cr (+9.47% YoY)
├── EBITDA Margin:        18.03%       (+42 bps YoY)
├── E-Commerce Velocity:  Mid-teens growth momentum
└── Distribution Reach:   6.0 Million+ Total Retail Outlets
| Indicator | Q1 FY27 Metric | Strategic Significance |
| Volume Growth | ~5.5% YoY | Supported by rural general trade recovery and low-unit price pack distribution. |
Gross Margin | ~41.01% | Expanded by ~100 bps YoY as pricing adjustments offset palm oil and packaging cost pressures. |
EBITDA Margin | 18.03% | Supported by lower employee expense overheads and operational leverage. |
| E-Commerce Scaling | Double-Digit Acceleration | Quick-commerce platforms accounted for elevated incremental volume growth in urban tiers. |
| General Trade Growth | Positive Momentum | Direct distribution expansion helped gain ground against regional competitor brands. |
| Advertising & Sales Spend | Elevated Investment | Increased marketing investments in influencers, promotions, and brand equity campaigns. |
SEGMENT ANALYSIS
Britannia Industries Limited reports operational performance under a single primary reportable operating segment: “Foods”. However, an examination of underlying product categories highlights strategic operational developments:
                            ┌────────────────────────────────────────┐
                            │      Britannia Industries Foods        │
                            └───────────────────┬────────────────────┘
                                                │
         ┌──────────────────────┬───────────────┴──────────────┬──────────────────────┐
         │                      │                              │                      │
┌────────┴─────────┐   ┌────────┴─────────┐           ┌────────┴─────────┐   ┌────────┴─────────┐
│ Core Bakery Unit │   │ Adjacent Bakery  │           │ Dairy Business   │   │  International   │
├──────────────────┤   ├──────────────────┤           ├──────────────────┤   ├──────────────────┤
│ • Good Day       │   │ • Sponge Cakes   │           │ • Cheese Slices  │   │ • GCC Markets    │
│ • Marie Gold     │   │ • Layer Cakes    │           │ • Dairy Drinks   │   │ • African Hubs   │
│ • Tiger          │   │ • Salted Wafers  │           │ • Fresh Butter   │   │ • South Asia     │
│ • NutriChoice    │   │ • Croissants     │           │ • Bel JV Products│   │ • Exports        │
└──────────────────┘   └──────────────────┘           └──────────────────┘   └──────────────────┘
1. Core Bakery Segment (Biscuits & Cookies)
The core biscuit portfolio—anchored by Good Day, Marie Gold, Tiger, and NutriChoice—remains the revenue engine, contributing over 75% of total sales. Volume growth accelerated in the latter part of the quarter, with revenue growth reaching mid-teens as the quarter exited. Premiumization across the Good Day and NutriChoice franchises supported average realisations.
2. Adjacent Bakery Business (Cakes, Rusk, Croissants & Wafers)
Cake and wafer categories benefited from modern trade and e-commerce distribution channels. Innovations in packaged muffins, layer cakes, and flavored wafers expanded reach among younger consumers.
3. Dairy Vertical & Britannia Bel Foods Joint Venture
The dairy business, operated in part through the Britannia Bel Foods Private Limited joint venture, showed steady traction across value-added categories like cheese, milkshakes, and butter. Joint venture losses narrowed during the quarter to ₹1.79 crore compared to ₹4.85 crore in Q1 FY26.
4. International Business & Exports
The international business recovered sequentially during the quarter as supply chain bottlenecks in West Asia normalized. Despite elevated shipping costs and crude oil volatility, export volumes expanded across key focus markets in the Middle East, Africa, and SAARC regions.
PRODUCT CATEGORY PERFORMANCE
                   Product Category Growth Trends (Q1 FY27)
   ┌─────────────────────────────────────────────────────────────────────────┐
   │ Good Day & Premium Cookies  ████████████████████ Very Strong Growth     │
   │ Marie Gold & Health Range   █████████████████ Steady Mass Volume       │
   │ E-Commerce & Quick Commerce ██████████████████████ High Acceleration   │
   │ Dairy & Value-Added Cheese  ██████████████ Sequentially Improving       │
   └─────────────────────────────────────────────────────────────────────────┘
Good Day: Maintained segment leadership in premium cookies through targeted influencer marketing and brand extensions.
Marie Gold: Recorded stable volume performance as rural general trade distribution improved.
Tiger: Benefited from low-unit price pack availability across mass-market rural retail channels.
NutriChoice: Sustained strong growth in urban centers, catering to health-conscious consumers with high-fiber and digestive ranges.
Milk Bikis: Growth was anchored by strong regional penetration in South India.
Cakes & Breads: Value-added packaged cake variants achieved mid-teens revenue growth in modern trade and quick-commerce channels.
DETAILED MANAGEMENT COMMENTARY
Speaking on the Q1 FY27 financial results, Rakshit Hargave, Managing Director & Chief Executive Officer, Britannia Industries Limited, stated:
*”The year started with West Asia conflict, leading to a steep increase in cost of fuel and shipment charges across our domestic & international businesses, which we have been able to navigate well during this quarter delivering a healthy volume and value growth.”
“Most key categories saw positive sequential momentum as we exited the quarter with a mid-teens revenue growth, anchored by rapid scaling in e-commerce and robust growth in General Trade, aided by higher advertisement, influencers & promotion spends.”
“Its International Business also recovered sequentially as supply chain constraints began normalising in last part of the quarter.”*
                    Strategic Focus Areas (Management Guidance)
┌─────────────────────────────────────────────────────────────────────────┐
│ • Navigate Crude & Freight Volatility in West Asia Corridor             │
│ • Accelerate Quick-Commerce and Direct-to-Consumer Channels             │
│ • Drive Volume Market Share Gains Against Local Regional Rivals          │
│ • Expand Rural Coverage via Low-Unit Price (LUP) Pack Strategies       │
└─────────────────────────────────────────────────────────────────────────┘
Strategic Key Takeaways from Management Disclosures
Inflation Guidance: The company is monitoring raw material cost inputs, including wheat, palm oil, sugar, and packaging materials.
Rural & Urban Dynamics: Rural demand is recovering, closing the growth gap with urban consumption as low-unit price packs regain momentum.
Marketing Investments: Increased advertising and trade promotions are being used to defend and grow market share against regional competitor brands.
WHY DID PROFITS RISE?
Britannia’s consolidated net profit after tax grew 14.08% YoY to ₹593.38 crore in Q1 FY27. The primary profit drivers included:
                            Q1 FY27 Net Profit Drivers
┌─────────────────────────────────────────────────────────────────────────┐
│ 1. Top-Line Expansion: Sale of goods grew 9.47% to ₹4,964.37 Cr         │
│ 2. Employee Expense Reduction: Decreased 13.34% YoY to ₹209.60 Cr       │
│ 3. Reduced Associate Losses: JV/Associate losses narrowed to ₹1.79 Cr  │
│ 4. Finance Cost Control: Interest expenses fell 12.54% YoY to ₹22.87 Cr│
└─────────────────────────────────────────────────────────────────────────┘
Solid Top-Line Expansion: Revenue from the sale of goods rose 9.47% YoY to ₹4,964.37 crore, driven by volume growth and improved product mix.
Lower Employee Costs: Consolidated employee benefits expense dropped 13.34% YoY from ₹241.86 crore to ₹209.60 crore.
Reduction in Joint Venture Losses: The company’s share of losses in associates and joint ventures narrowed significantly to ₹1.79 crore in Q1 FY27 from ₹4.85 crore in Q1 FY26.
Controlled Interest Expenses: Finance costs fell 12.54% YoY to ₹22.87 crore, reflecting efficient capital management.
COMPETITOR COMPARISON TABLE
The table below compares Britannia Industries Limited with leading Indian FMCG peers based on trailing metrics:
| Metric / Parameter | Britannia Industries | Nestlé India | Hindustan Unilever (HUL) | ITC Foods Division | Tata Consumer Products |
Q1 Revenue Growth (YoY) | +8.17% | +3.5% | +1.8% | +6.2% | +9.5% |
EBITDA Margin (%) | 18.03% | ~22.5% | ~23.2% | ~11.5% | ~14.8% |
PAT Margin (%) | 11.87% | ~14.8% | ~17.1% | ~8.2% | ~8.9% |
| P/E Ratio (TTM) | 51.19x | ~72.4x | ~58.2x | ~28.5x | ~78.1x |
Core Market Focus | Bakery & Dairy | Urban Packaged Foods | Mass Personal & Home Care | Packaged Foods & Cigarettes | Beverages & Packaged Foods |
| E-Commerce Velocity | Rapid Expansion | Strong | Large Scale | Growing | Rapid Scaling |
INDUSTRY ANALYSIS
The Indian FMCG sector experienced a gradual demand recovery in Q1 FY27, characterized by:
Rural Demand Turning Favorable: Higher agricultural yields, steady government spending, and normal monsoons helped rural volume growth outpace previous quarters.
Quick Commerce Channel Shift: Quick-commerce delivery platforms reshaped urban grocery buying patterns, driving higher volume throughput for impulse food categories.
Input Cost Headwinds: Raw material costs, including palm oil and packaging materials, saw moderate price inflation, while wheat costs remained manageable due to strategic corporate hedging.
Geopolitical Freight Pressures: Conflicts in West Asia increased shipping tariffs and fuel surcharges, impacting international supply chain costs.
BALANCE SHEET ANALYSIS
Britannia maintains a solid balance sheet supported by strong cash reserves and working capital control:
                     Balance Sheet Health Snapshot (Consolidated)
┌─────────────────────────────────────────────────────────────────────────┐
│ • Equity Share Capital:  ₹24.09 Crore (Face Value ₹1 per share)         │
│ • Other Equity:          ₹5,679.60 Crore (As of June 30, 2026)          │
│ • Debt-to-Equity Ratio:  0.30x (Conservative leverage profile)          │
│ • Return on Equity:      60.08% (TTM)                                   │
└─────────────────────────────────────────────────────────────────────────┘
Equity Base: Paid-up equity share capital stands at ₹24.09 crore (24.09 crore equity shares of face value ₹1 each). Total consolidated other equity reached ₹5,679.60 crore as of June 30, 2026.
Low Debt Profile: Total debt-to-equity ratio remains at a conservative 0.30x, allowing the company to fund capital expenditure through internal cash generation.
Working Capital Efficiency: Inventory turnover and receivables cycles remain tightly managed across general and modern trade routes.
CASH FLOW ANALYSIS
Britannia’s business model generates predictable cash flows:
Operating Cash Flow (OCF): Sustained by efficient working capital cycles and cash conversion from daily biscuit and bakery sales.
Investing Cash Flow (ICF): Directed toward factory modernization, line expansion in adjacent product categories, and IT infrastructure updates.
Financing Cash Flow (FCF): Characterized by regular dividend distributions to equity shareholders and structured debt servicing.
RATIO ANALYSIS TABLE
The financial ratios below summarize Britannia’s operational efficiency and return profile:
| Financial Ratio | Q1 FY27 / TTM Metric | Historical Benchmark (FY26) |
Gross Margin (%) | ~41.01% | 40.80% |
EBITDA Margin (%) | 18.03% | 20.11% |
Net Profit (PAT) Margin (%) | 11.87% | 14.13% |
Basic EPS (₹) | ₹24.55 (Quarterly) | ₹105.18 (Annual) |
| Return on Equity (ROE) | 60.08% | 60.08% |
| Return on Capital Employed (ROCE) | 60.58% | 60.58% |
| Total Debt-to-Equity Ratio | 0.30x | 0.30x |
| Price-to-Earnings (P/E) Multiple | 51.19x | 51.76x |
VALUATION ANALYSIS
At the closing price of ₹5,404.00 on August 6, 2026, Britannia Industries trades at a trailing price-to-earnings (P/E) multiple of 51.19x.
                     P/E Valuation Multiple Comparison
┌─────────────────────────────────────────────────────────────────────────┐
│ Britannia Industries: █ 51.19x TTM P/E                                  │
│ Nestlé India:         ██████ 72.40x TTM P/E                             │
│ Hindustan Unilever:   █████ 58.20x TTM P/E                              │
│ Tata Consumer:        ███████ 78.10x TTM P/E                            │
└─────────────────────────────────────────────────────────────────────────┘
P/E Multiple Context: The stock’s P/E of 51.19x trades at a discount to peers like Nestlé India (~72x) and Tata Consumer (~78x), while commanding a premium over diversified conglomerates like ITC.
Discounted Cash Flow (DCF) Perspective: DCF models assuming a 10-year terminal revenue growth rate of 7.5% and a WACC of 10.5% yield an estimated fair value range of ₹5,800 to ₹6,200 per share.
BROKERAGE VIEWS
Institutional brokerages maintain a generally positive outlook on Britannia following the Q1 FY27 results announcement:
Consensus Analyst Rating: Out of 33 tracking analysts, 24 maintain a “BUY” rating, 8 recommend “HOLD”, and 2 suggest “SELL”.
Average 12-Month Target Price: Consensus price target stands at ₹6,227.82, representing a potential upside of ~15.2% from the current price of ₹5,404.00.
High & Low Target Range: High estimate of ₹7,240.00; Low estimate of ₹4,800.00.
Note: Brokerage target prices reflect analyst projections and should not be taken as financial guarantees.
SWOT ANALYSIS
| Strengths | Weaknesses |
• Market leader in Indian packaged biscuits. • Distribution network reaching over 6 million outlets. • High Return on Equity (ROE: ~60%). • Established brand portfolio (Good Day, Marie Gold, Tiger). | • Higher vulnerability to raw material commodity cycles (wheat, palm oil). • Lower revenue contribution from international markets relative to domestic operations. |
| Opportunities | Threats |
• Scaling up adjacent categories (cakes, rusk, dairy). • E-commerce and quick-commerce distribution expansion. • Growing demand for healthy snacks (NutriChoice). | • Competition from local and regional unorganized biscuit makers. • Geopolitical conflicts impacting global freight rates. |
RISK FACTORS
Commodity Price Volatility: Sharp increases in palm oil, wheat, or sugar costs could weigh on gross margins if retail price adjustments are delayed.
Geopolitical Disruption: Escalations in West Asia could lead to higher shipping freight costs and supply chain delays for international shipments.
Competition from Regional Players: Local biscuit brands competing on price pose a challenge in price-sensitive rural markets.
OPPORTUNITIES
Quick Commerce Acceleration: Expanding direct supply partnerships with quick-commerce platforms offers high volume throughput in urban markets.
Premium Product Portfolio: Expanding premium brands like Good Day and NutriChoice supports higher average realisations.
Adjacent Category Scaling: Growing presence in packaged cakes, croissanterie, and value-added dairy creates incremental revenue streams beyond traditional biscuits.
INVESTMENT THESIS
                           Investment Scenario Matrix
┌─────────────────────────────────────────────────────────────────────────┐
│ • Bull Case (Target: ₹7,000+): Accelerated rural recovery & margin expansion│
│ • Base Case (Target: ₹6,220): Steady 8-10% revenue growth & ~18% margins  │
│ • Bear Case (Target: ₹4,800): Input cost inflation & regional competition│
└─────────────────────────────────────────────────────────────────────────┘
Bull Case (Target: ₹7,000+): Accelerated rural volume growth, falling commodity costs, and faster scaling of the dairy business drive double-digit earnings growth.
Base Case (Target: ₹6,220): Steady 8–10% revenue growth, EBITDA margins holding around 18%, and broad-based market share defense.
Bear Case (Target: ₹4,800): Renewed commodity inflation in wheat and palm oil squeezes operating margins, while regional competition limits volume growth.
WHO SHOULD BUY THIS STOCK?
Long-Term Quality Investors: Investors seeking high capital efficiency (ROE ~60%) and defensive market leadership.
Dividend & Income Seekers: Shareholders benefiting from regular annual dividend payouts backed by steady operating cash flows.
Conservative Equity Growth Portfolios: Portfolio managers looking for large-cap FMCG stability during broader market volatility.



