

Introduction
In an era where India’s capital expenditure narrative continues to drive structural growth across the broader economy, engineering, procurement, and construction (EPC) major NCC Limited (NSE: NCC, BSE: 500294) has delivered its financial report for the first quarter of Financial Year 2026-27 (Q1 FY27). The quarterly numbers, formally approved by the company’s Board of Directors on August 6, 2026, show sustained expansion across both standalone and consolidated operations.
Investors across domestic and international markets actively track NCC Limited because it serves as a representative barometric indicator for Indian physical infrastructure buildout. Holding a multi-decade operational history, NCC operates across diverse verticals including industrial and residential buildings, water supply schemes, electrical distribution, transportation, mining, and urban rail transit.
The Q1 FY27 financial results carry significance for market participants for several reasons. First, the first quarter of any Indian financial year typically presents execution headwinds caused by seasonal monsoons and labor availability shifts. Second, investors are looking for evidence of margin stability after recent inflationary pressures in raw construction materials and elevated sub-contracting expenses. Third, following a period where management navigated broader macroeconomic uncertainty, market participants are analyzing execution velocity to determine whether top-line expansion can translate into sustainable earnings growth.
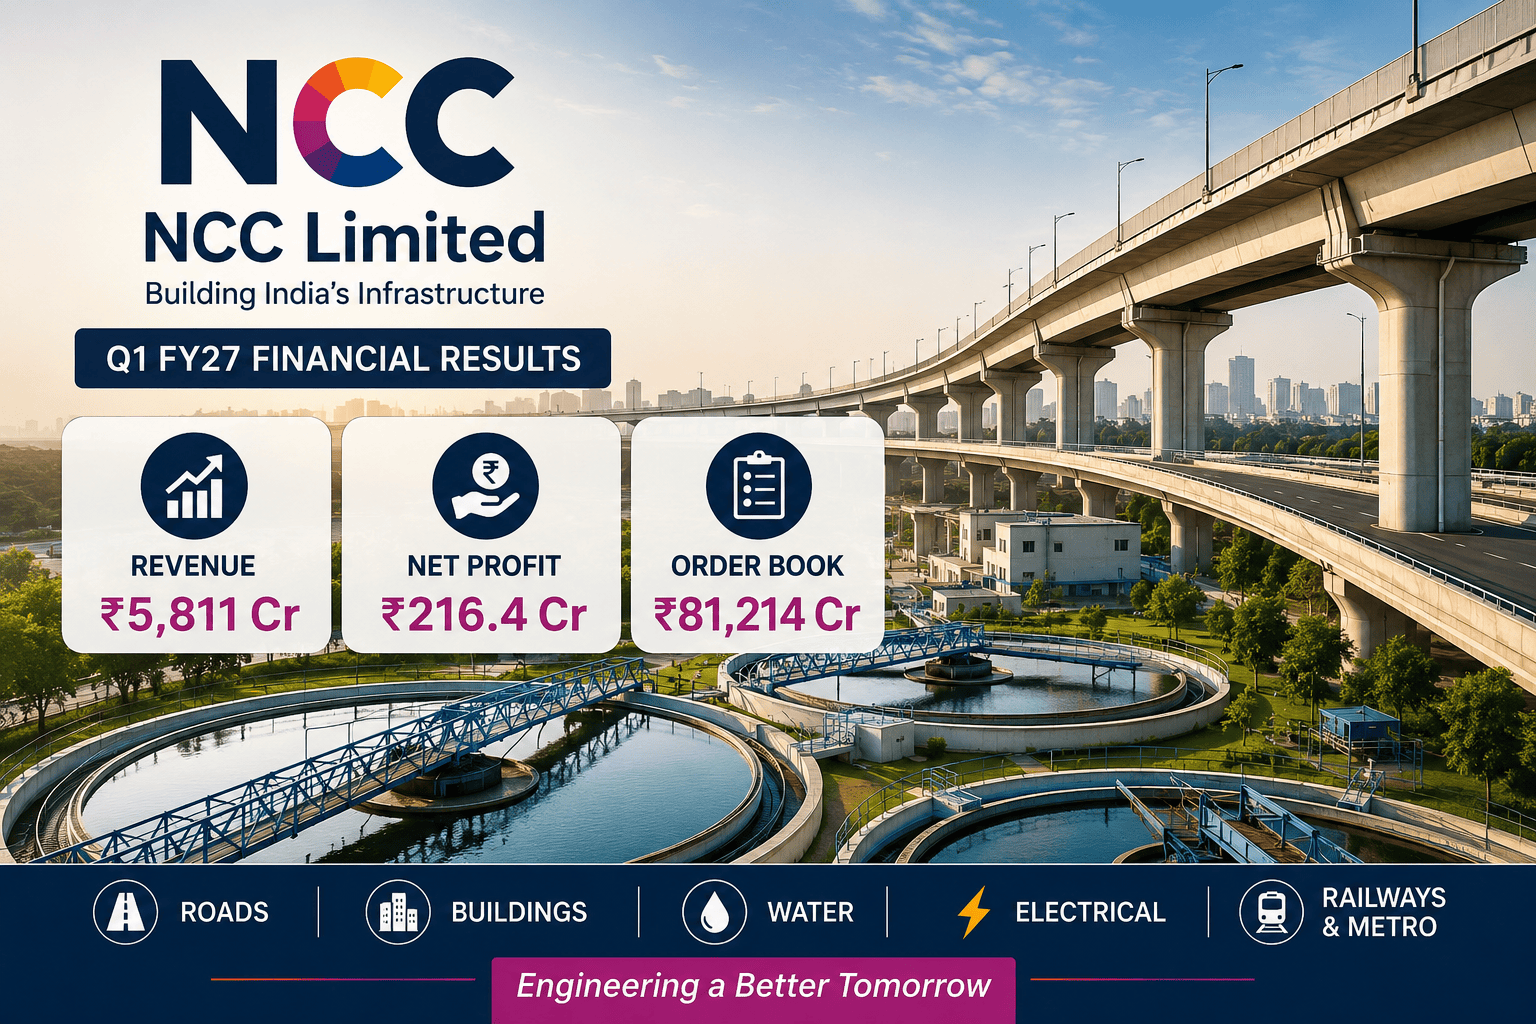
+-------------------------------------------------------------------------------+
|                        NCC LTD. Q1 FY27 AT A GLANCE                           |
+--------------------------+--------------------------+-------------------------+
| Consolidated Revenue     | Consolidated Net Profit  | Consolidated Order Book |
| ₹5,811.83 Cr (+12.2% YoY)| ₹216.40 Cr (+12.6% YoY)  | ₹81,214 Cr (as of Jun26)|
+--------------------------+--------------------------+-------------------------+
During Q1 FY27, NCC Limited recorded consolidated revenue from operations of ₹5,811.83 crore, reflecting a year-on-year growth of 12.2%. Consolidated Net Profit attributable to shareholders rose 12.6% YoY to ₹216.40 crore. On the order intake front, the group secured new orders worth ₹3,889 crore during the quarter, taking its total consolidated order book to ₹81,214 crore as of June 30, 2026. This provides revenue visibility of nearly four times its annual revenue scale.
This research article provides an analytical evaluation of NCC Ltd.’s Q1 FY27 financial metrics. Readers will gain insight into standalone vs. consolidated operational dynamics, segment-level performance, balance sheet mechanics, order book composition, valuation multiples, competitive positioning, and a balanced long-term investment perspective.
Company Overview
Corporate History & Business Profile
Incorporated originally as Nagarjuna Construction Company Limited before rebranding to NCC Limited, the company has evolved from a regional construction entity into one of India’s largest conglomerate infrastructure and EPC developers. Headquartered at NCC House in Madhapur, Hyderabad, Telangana, the company operates across major national geographies and selectively maintains international project offices in the Middle East.
                     +----------------------------------+
                     |           NCC LIMITED            |
                     |  (Infrastructure Construction)  |
                     +----------------+-----------------+
                                      |
         +----------------------------+----------------------------+
         |                                                         |
+--------v--------+                                       +--------v--------+
|  CONSTRUCTION   |                                       |   REAL ESTATE   |
|  • Buildings    |                                       |  • Urban Homes  |
|  • Water & T&D  |                                       |  • Commercial   |
|  • Transportation|                                      |  • Joint Ventures|
|  • Mining & Rail|                                       +-----------------+
+-----------------+
Core Operating Segments
NCC structures its business reporting primarily into three core operating divisions under Indian Accounting Standards (Ind AS 108):
Construction Segment: The core engine of the group, accounting for over 98% of gross operating revenues. This segment covers high-rise structures, commercial complexes, institutional campuses, national highways, expressways, flyovers, bridges, water treatment plants, sewage networks, power transmission lines, smart metering setups, coal mining overburden removal, and metro rail elevated corridors.
Real Estate Segment: Managed largely through subsidiaries like NCC Urban Infrastructure Limited, this vertical focuses on residential complexes, townships, and commercial office space developments.
Others / Infrastructure Concessions: Encompasses residual Build-Operate-Transfer (BOT) assets, special purpose vehicles (SPVs), and minor service contracts.
Competitive Positioning & Revenue Drivers
NCC ranks as a tier-one construction developer in India, trailing primary market leader Larsen & Toubro in terms of gross turnover, but maintaining scale alongside peers like KNR Constructions, PNC Infratech, HG Infra, and Afcons Infrastructure. Its business model relies on bidding for government and public sector undertaking (PSU) contracts, with public sector client assignments comprising the vast majority of its order book.
The main drivers of top-line expansion for NCC include national capital expenditure outlays, state-level urban utility programs (such as Jal Jeevan Mission and AMRUT), smart grid upgrades, and coal production expansion by government mining entities. Its key competitive advantages stem from diverse project capabilities, established joint-venture partnerships, project bidding capacity, and a nationwide equipment library that reduces sub-contractor reliance on specialized heavy machinery.
Q1 FY27 Financial Highlights
NCC Limited’s financial performance for the quarter ended June 30, 2026, demonstrated top-line and bottom-line expansion on a consolidated basis. The standalone results, reflecting parent-level engineering execution, demonstrated stable revenue scale alongside modest margin movements.
CONSOLIDATED FINANCIAL PERFORMANCE (Q1 FY27 vs Q1 FY26)
======================================================
Revenue from Operations:  ₹5,811.83 Cr  ▲ 12.2%
Total Income:             ₹5,842.48 Cr  ▲ 12.2%
Consolidated EBITDA:      ₹545.12 Cr    ▲ 19.5%
Net Profit (Attributable): ₹216.40 Cr    ▲ 12.6%
Basic & Diluted EPS:      ₹3.45         ▲ 12.7%
Consolidated Order Book:  ₹81,214 Cr    (Strong Visibility)
Consolidated Performance Summary
Revenue from Operations: Reached ₹5,811.83 crore in Q1 FY27, up 12.2% compared to ₹5,178.99 crore recorded in Q1 FY26.
Total Revenue (Including Other Income): Stood at ₹5,842.48 crore versus ₹5,207.93 crore in the year-ago period.
EBITDA: Consolidated EBITDA reached ₹545.12 crore, up 19.5% from ₹456.12 crore in Q1 FY26.
Profit After Tax (PAT): Net profit attributable to the shareholders of the company reached ₹216.40 crore, registering a 12.6% increase over ₹192.14 crore reported in Q1 FY26. Total consolidated PAT (including non-controlling interest) was ₹228.90 crore.
Earnings Per Share (EPS): Basic and diluted EPS on a consolidated basis rose to ₹3.45 per share for the quarter, compared to ₹3.06 in Q1 FY26.
Standalone Performance Summary
Revenue from Operations: Standalone revenue came in at ₹4,911.50 crore, growing 12.2% YoY from ₹4,378.33 crore in Q1 FY26.
Total Standalone Income: Reached ₹4,952.45 crore compared to ₹4,429.76 crore in Q1 FY26.
EBITDA: Standalone EBITDA was reported at ₹442.45 crore against ₹394.82 crore in the corresponding quarter of the previous year.
Standalone Net Profit: Came in at ₹187.31 crore versus ₹189.99 crore in Q1 FY26.
Standalone EPS: Stood at ₹2.98 compared to ₹3.03 in Q1 FY26.
Expenditure, Debt, and Exceptional Items
During the quarter, raw construction costs expanded alongside business growth. Cost of materials consumed on a consolidated basis stood at ₹1,857.93 crore, while sub-contractor work bills totaled ₹2,605.70 crore. Finance costs on a consolidated basis increased to ₹198.02 crore from ₹163.62 crore in Q1 FY26, reflecting working capital usage and prevailing borrowing costs. No exceptional items were recorded in Q1 FY27, whereas the preceding quarter (Q4 FY26) had included provisions relating to new labor code implementations and subsidiary loan impairments.
Financial Comparison Tables
The following tables present a side-by-side comparison of NCC Limited’s performance across quarterly periods, drawn directly from official stock exchange filings.
Consolidated Quarter Comparison (in ₹ Crore)
| Financial Metric | Q1 FY27 (Unaudited) | Q4 FY26 (Audited) | Q1 FY26 (Unaudited) | YoY Growth (%) | QoQ Growth (%) |
| Revenue from Operations | 5,811.83 | 6,232.71 | 5,178.99 | +12.22% | -6.75% |
| Other Income | 30.65 | 18.27 | 28.94 | +5.91% | +67.76% |
| Total Income | 5,842.48 | 6,250.98 | 5,207.93 | +12.18% | -6.53% |
| Cost of Materials Consumed | 1,857.93 | 1,984.97 | 1,820.46 | +2.06% | -6.40% |
| Stock Inventory Changes | (57.88) | (71.19) | (73.54) | N/A | N/A |
| Construction Expenses | 531.30 | 575.10 | 458.87 | +15.78% | -7.62% |
| Sub-Contractor Work Bills | 2,605.70 | 2,863.31 | 2,223.22 | +17.20% | -9.00% |
| Employee Benefits Expense | 234.24 | 225.84 | 203.13 | +15.32% | +3.72% |
| Finance Costs | 198.02 | 213.47 | 163.62 | +21.02% | -7.24% |
| Depreciation & Amortization | 69.31 | 64.60 | 55.04 | +25.93% | +7.29% |
| Other Expenses | 95.42 | 104.27 | 90.73 | +5.17% | -8.49% |
| Total Expenses | 5,534.04 | 5,960.37 | 4,941.53 | +11.99% | -7.15% |
| Operating Profit (EBITDA) | 545.12 | 522.35 | 456.12 | +19.51% | +4.36% |
| EBITDA Margin (%) | 9.38% | 8.38% | 8.81% | +57 bps | +100 bps |
| Profit Before Tax (PBT) | 311.64 | 293.59 | 268.36 | +16.13% | +6.15% |
| Tax Expense | 82.74 | 76.82 | 63.72 | +29.85% | +7.71% |
| PAT (Attributable to Owners) | 216.40 | 206.02 | 192.14 | +12.63% | +5.04% |
| Consolidated Basic EPS (₹) | 3.45 | 3.28 | 3.06 | +12.75% | +5.18% |
| Consolidated Order Book | 81,214 | 81,500* | 71,568 | +13.48% | -0.35% |
*Note: Q4 FY26 Order Book estimated based on reported full-year figures.
Standalone Quarter Comparison (in ₹ Crore)
| Financial Metric | Q1 FY27 (Unaudited) | Q4 FY26 (Audited) | Q1 FY26 (Restated) | YoY Growth (%) |
| Revenue from Operations | 4,911.50 | 5,315.71 | 4,378.33 | +12.18% |
| Other Income | 40.95 | 66.48 | 51.43 | -20.38% |
| Total Income | 4,952.45 | 5,382.19 | 4,429.76 | +11.80% |
| Total Expenses | 4,698.94 | 5,102.11 | 4,189.07 | +12.17% |
| Profit Before Tax (PBT) | 253.51 | 258.58 | 240.69 | +5.33% |
| Net Profit After Tax (PAT) | 187.31 | 202.88 | 189.99 | -1.41% |
| Standalone EPS (₹) | 2.98 | 3.23 | 3.03 | -1.65% |
Year-on-Year (YoY) Analysis
A comparison of Q1 FY27 against Q1 FY26 demonstrates top-line trajectory across consolidated operations.
YoY PERFORMANCE METRIC TRENDS (Q1 FY26 vs Q1 FY27)
---------------------------------------------------
Consolidated Top-Line:     ₹5,178.99 Cr ---> ₹5,811.83 Cr (+12.2%)
Consolidated EBITDA:       ₹456.12 Cr   ---> ₹545.12 Cr   (+19.5%)
Consolidated Net Profit:   ₹192.14 Cr   ---> ₹216.40 Cr   (+12.6%)
Sub-Contractor Bills:      ₹2,223.22 Cr ---> ₹2,605.70 Cr (+17.2%)
Finance Costs:             ₹163.62 Cr   ---> ₹198.02 Cr   (+21.0%)
Top-Line Growth Drivers
Consolidated turnover expanded by 12.2% YoY, primarily supported by steady execution momentum within the core construction division. The construction segment alone added ₹607.96 crore in gross top-line compared to Q1 FY26. This performance was driven by the execution of previously secured project orders across water distribution schemes, building construction, and urban transportation corridors.
Operational Cost Dynamics
While revenues grew 12.2%, costs moved at varying rates:
Sub-Contractor Expenses: Rose 17.2% YoY from ₹2,223.22 crore to ₹2,605.70 crore. This reflects specialized sub-contracting requirements in complex water, smart metering, and electrical projects where speed of completion is prioritized.
Raw Material Expenses: Cost of materials consumed recorded a muted increase of 2.06% YoY to ₹1,857.93 crore. Moderate commodity prices for structural steel, cement, and bitumen helped offset higher volumes used across construction sites.
Finance Costs: Consolidated finance charges grew 21.0% YoY to ₹198.02 crore. This increase was driven by higher working capital requirements to maintain supply chains, bank guarantee charges, and commercial debt utilization.
Bottom-Line Impact
Consolidated net profit attributable to equity holders expanded 12.6% YoY to ₹216.40 crore. On a standalone basis, net profit experienced a slight 1.4% decline to ₹187.31 crore, primarily due to lower standalone other income (which fell from ₹51.43 crore to ₹40.95 crore) and higher standalone interest expenses.
Quarter-on-Quarter (QoQ) Analysis
Comparing Q1 FY27 results to the preceding quarter (Q4 FY26) highlights standard seasonal trends within the Indian construction industry.
QoQ SEASONAL COMPARISON
-----------------------
Q4 FY26 Revenue (Peak March Quarter Execution):  ₹6,232.71 Cr
Q1 FY27 Revenue (Monsoon / Early FY Quarter):     ₹5,811.83 Cr (-6.75%)
EBITDA Margin Movement:                           8.38% ---> 9.38% (+100 bps)
Seasonal Revenue Cycles
In the EPC sector, Q4 (January–March) represents the seasonal execution peak as project managers work to meet fiscal-year construction milestones before the onset of the monsoon. Consequently, consolidated revenue from operations moderated by 6.75% QoQ from ₹6,232.71 crore in Q4 FY26 to ₹5,811.83 crore in Q1 FY27.
Margin Resiliency
Despite lower sequential revenues, consolidated operating profit (EBITDA) improved from ₹522.35 crore in Q4 FY26 to ₹545.12 crore in Q1 FY27. The consolidated EBITDA margin expanded by 100 basis points sequentially from 8.38% to 9.38%. This margin improvement was aided by the absence of exceptional provisions that had impacted Q4 FY26 profitability and tighter management of material consumption costs during the current quarter.
Segment-wise Performance
NCC Limited reports primary segment data across three categories: Construction, Real Estate, and Others.
+-----------------------------------------------------------------------+
|                    Q1 FY27 GROSS REVENUE BY SEGMENT                   |
+-----------------------------------------------------------------------+
| Construction Division:  ₹5,759.29 Cr (99.10% of total)               |
| Real Estate Division:   ₹52.54 Cr    (0.90% of total)               |
| Others / Concessions:   ₹0.00 Cr     (Negligible standalone)        |
+-----------------------------------------------------------------------+
Segment Performance Table (in ₹ Crore)
| Operating Segment | Q1 FY27 Revenue | Q4 FY26 Revenue | Q1 FY26 Revenue | Q1 FY27 Result (EBIT) | Q1 FY26 Result (EBIT) |
| Construction | 5,759.29 | 6,183.32 | 5,151.33 | 343.58 | 297.68 |
| Real Estate | 52.54 | 49.39 | 27.66 | 4.77 | 1.14 |
| Others | 0.00 | 0.00 | 0.00 | (1.13) | (0.50) |
| Total Segment Gross | 5,811.83 | 6,232.71 | 5,178.99 | 347.22 | 298.32 |
| Less: Net Finance Cost | — | — | — | (42.23) | (41.84) |
| Add: Unallocable Income | — | — | — | 3.45 | 9.92 |
| Add: Associate Share | — | — | — | 3.20 | 1.96 |
| Profit Before Tax | — | — | — | 311.64 | 268.36 |
Detailed Segment Analysis
1. Construction Division
The Construction vertical represents the company’s primary operational focus. In Q1 FY27, it generated gross revenue of ₹5,759.29 crore, representing 99.1% of total operational revenues. Segment EBIT reached ₹343.58 crore, up 15.4% from ₹297.68 crore in Q1 FY26. Within this vertical, internal sub-segments include:
Buildings & Housing: Generates substantial order volumes through government residential programs, commercial offices, institutional campuses, and healthcare centers.
Water & Environment: Covers drinking water distribution networks, bulk water pipelines, and treatment facilities under central/state government programs.
Transportation (Roads, Bridges, Expressways): Focuses on highway construction and elevated transit structures.
Electrical, Power & Smart Meters: Involves power distribution infrastructure, smart meter deployments, and substation installations.
Mining & Railways: Involves long-term overburden removal contracts for coal mining companies and railway siding projects.
2. Real Estate Division
The Real Estate segment generated revenue of ₹52.54 crore in Q1 FY27 compared to ₹27.66 crore in Q1 FY26, representing an 89.9% increase. Operating profit for the division expanded to ₹4.77 crore from ₹1.14 crore in Q1 FY26. While real estate activity contributes a smaller portion of overall revenues, higher realization per square foot in select residential projects contributed positively to segment margins during the quarter.
Order Book & Inflow Analysis
A central indicator of future growth for any EPC company is the size, quality, and execution speed of its order book.
+--------------------------------------------------------------------+
|                  ORDER BOOK VISIBILITY OVERVIEW                    |
+--------------------------------------------------------------------+
| Q1 FY27 Order Inflows:          ₹3,889 Crore                       |
| Total Consolidated Order Book:  ₹81,214 Crore (as of June 30, 2026)|
| Book-to-Bill Ratio:             ~3.9x (Based on TTM Revenue)      |
| Core Customer Profile:          >85% Public Sector / Government    |
+--------------------------------------------------------------------+
Order Intake and Execution Pipeline
In Q1 FY27, NCC Limited secured new order wins totaling ₹3,889 crore (including scope changes across existing projects). This order intake was supported by transportation contract wins secured in late June 2026 totaling ₹534.85 crore, alongside building and water infrastructure orders.
Order Book Table (in ₹ Crore)
| Order Book Parameter | Figure / Value | Operational Meaning |
| Total Consolidated Order Book | ₹81,214 Cr | Multi-year revenue visibility |
| Q1 FY27 New Order Wins | ₹3,889 Cr | Replenishment rate matching quarterly execution |
| Book-to-Bill Ratio | ~3.9x | Provides forward revenue cover for ~3-4 years |
| Dominant Vertical | Buildings & Water | Diversified exposure across government capex |
| Client Mix | Government & PSUs | Low counterparty credit default risk |
Diversification & Revenue Cover
The consolidated order book of ₹81,214 crore as of June 30, 2026, provides a book-to-bill ratio of roughly 3.9x relative to FY26 consolidated revenues of ₹20,823 crore. This scale of order cover reduces near-term pressure to bid aggressively for lower-margin projects, allowing management to prioritize contract selection based on margin quality and execution timelines.
Management Commentary & Guidance
Management updates provided in regulatory disclosures and earnings interactions highlight operational priorities for FY27.
MANAGEMENT FOCUS AREAS - FY27
-----------------------------
* Priority on execution speed and working capital management.
* Selective bidding criteria targeting minimum EBITDA margin thresholds.
* Continued focus on debt management and balance sheet health.
* Expansion of execution capabilities in water, electrical, and transportation verticals.
Business & Execution Focus
Execution Velocity: Management’s operational focus remains centered on accelerating site completion across water distribution and smart meter contracts. Moving projects beyond initial development phases into peak revenue generation is critical for maintaining cash flows.
Margin Management: Management maintains a conservative approach to margin expectations, targeting an EBITDA margin floor around 8.5% to 9.0%. Tighter material procurement strategies and contract price-escalation clauses help insulate margins against supply chain swings.
Capital Allocation & Debt: The company continues to prioritize working capital optimization to control interest costs. Free cash flow generated from completed projects is being allocated toward reducing working capital debt and fulfilling equity commitments in active projects.
Industry Analysis & Macro Drivers
NCC Limited’s growth trajectory is aligned with national infrastructure investment policies.
                      +---------------------------------------+
                      |       MACRO INFRASTRUCTURE DRIVERS    |
                      +-------------------+-------------------+
                                          |
         +--------------------------------+--------------------------------+
         |                                |                                |
+--------v-------+               +--------v-------+               +--------v-------+
|  NATIONAL CAPEX|               | URBAN UTILITIES|               | ENERGY & POWER |
|  • Roads & Rail|               |  • Water Schemes|              |  • Smart Grid  |
|  • Expressways |               |  • AMRUT / Jal  |              |  • Sub-stations|
+----------------+               +----------------+               +----------------+
Key Sector Growth Drivers
Government Capital Spending: Central and state budget allocations for national highways, rail corridors, and urban transit continue to drive EPC order pipelines.
Water Infrastructure Initiatives: Government programs focusing on rural drinking water access and municipal sewage treatment provide project opportunities for NCC’s Water & Environment division.
Grid Modernization & Smart Meters: Power distribution utility updates across several Indian states are driving order books in smart metering and distribution infrastructure.
Commercial & Institutional Construction: State and central government plans for medical colleges, administrative complexes, public housing, and airport terminal expansions support the Buildings division.
Competitor Comparison
Evaluating NCC Limited against peer infrastructure companies provides perspective on its operational scale, margins, and stock valuation multiples.
Peer Group Comparison Table
| Metric / Parameter | NCC Limited | Larsen & Toubro | KNR Constructions | PNC Infratech | HG Infra Eng. |
| Market Cap Category | Mid/Large Cap | Mega Cap | Mid Cap | Mid Cap | Small/Mid Cap |
| Consolidated Revenue (FY26) | ₹20,823 Cr | ₹2,21,113 Cr | ₹4,150 Cr | ₹7,800 Cr | ₹5,200 Cr |
| EBITDA Margin (%) | ~8.8% – 9.4% | ~10.5% – 11.2% | ~16.0% – 18.0% | ~12.5% – 13.5% | ~14.0% – 15.5% |
| Order Book Size | ₹81,214 Cr | ₹4,75,000+ Cr | ₹8,500 Cr | ₹14,000 Cr | ₹12,500 Cr |
| Book-to-Bill Ratio | ~3.9x | ~2.1x | ~2.0x | ~1.8x | ~2.4x |
| Trailing P/E Ratio (x) | ~13.3x | ~31.0x | ~12.5x | ~11.0x | ~12.0x |
| Price to Book (P/B) (x) | ~1.12x | ~4.20x | ~1.80x | ~1.30x | ~2.10x |
Analysis: While pure-play highway developers (like KNR Constructions and HG Infra) often post higher EBITDA margins due to HAM/BOT project structures, NCC’s broader operational profile across buildings, water, mining, and power segments provides revenue diversification and shields it from cyclical slowdowns in any single sub-sector.
Share Price Analysis, Valuation & Shareholding
Valuation Metrics Summary
STOCK VALUATION PROFILE (NSE: NCC)
----------------------------------
Current Market Price (CMP):    ~₹143 - ₹144 (As of August 2026)
52-Week Range:                 ₹130.00 (Low) - ₹225.95 (High)
Market Capitalization:         ~₹8,980 Cr - ₹9,014 Cr
Trailing Twelve Month P/E:     ~13.35x
Price-to-Book Value (P/B):     ~1.12x
Market Cap-to-Sales:           ~0.39x
Consolidated TTM EPS:          ₹10.76
Technical Trends & Moving Averages
Trading near the ₹143–₹144 range in early August 2026, the stock has undergone a period of valuation consolidation following broader capital market swings. The stock’s current trading zone sits closer to its 52-week low of ₹130.00 than its peak of ₹225.95. Technical indicators show short-term moving averages stabilizing near the current price level, with long-term moving averages establishing technical support zones around ₹135–₹140.
                      NCC SHAREHOLDING STRUCTURE
                      --------------------------
   Promoter Holding [23.08%] ■■■■■
   Foreign Inst. (FII) [11.29%] ■■
   Domestic Inst. (DII) [17.88%] ■■■■
   Public & Others [47.75%] ■■■■■■■■■■
Shareholding Pattern Breakdown (as of June 30, 2026)
Promoter & Promoter Group: 23.08% (slight increase from 22.81% in March 2026). Pledged shares remain minimal at ~3.80%.
Foreign Institutional Investors (FIIs): 11.29%
Domestic Institutional Investors (DIIs): 17.88% (including 14.13% held via Mutual Funds)
Retail & Public Shareholders: 47.75%
Brokerage View & Analyst Consensus
Analyst ratings across institutional brokerages reflect a generally positive stance, driven primarily by order book visibility, balanced by a degree of caution regarding project execution timelines and working capital usage.
Institutional Rating Snapshot
ANALYST CONSENSUS BREAKDOWN (11 Coverage Analysts)
--------------------------------------------------
Strong Buy / Buy:  8 Analysts (72.7%)
Hold / Neutral:    2 Analysts (18.2%)
Sell:              1 Analyst  (9.1%)
Target Price Range: ₹160 - ₹242 (12-Month Horizon)
Institutional Investment Thesis
Bull Thesis: Supported by a book-to-bill ratio near ~3.9x, stable execution across state government projects, and an attractive valuation multiple (~13x P/E) relative to historical averages.
Bear / Neutral Thesis: Focuses on risks including working capital expansion, interest expense growth, and potential execution delays caused by seasonal monsoons or state-level payment cycles.
Strategic Strengths
Substantial Order Book Visibility: A consolidated order pipeline of ₹81,214 crore provides earnings visibility spanning 3 to 4 years.
Diversified Project Portfolio: Operations spread across buildings, water networks, transportation, electrical grids, and mining mitigate single-sector downturn risks.
Low Counterparty Credit Risk: Over 85% of projects are awarded by central government bodies, state departments, and PSUs, reducing bad debt risks.
Established Bidding Capacity: High technical qualification scores allow NCC to bid for large-scale national infrastructure projects.
Fundamental Weaknesses
Working Capital Intensity: Construction operations require significant working capital to manage project receivables, bank guarantees, and inventory.
Elevated Finance Costs: Interest charges (₹198.02 crore in Q1 FY27) reduce net profit margins relative to operating profits.
Sub-Contractor Dependency: Sub-contractor work bills accounted for ₹2,605.70 crore in Q1 FY27, limiting direct cost control in specialized projects.
Opportunities & Growth Catalysts
Jal Jeevan Mission & Urban Water Expansion: Continued execution of urban and rural water supply infrastructure contracts.
Smart Grid & Metering Rollout: Ongoing installations of smart electricity meters provide stable multi-year execution pipelines.
Urban Mass Transit Systems: Expanding tender activity for metro rail corridors and elevated transit networks in tier-1 and tier-2 Indian cities.
Commercial Real Estate Realizations: Unlocking cash flow from completed residential and commercial real estate assets through NCC Urban.
Investment & Business Risks
RISK IDENTIFICATION MATRIX
+------------------------+-------------------+-----------------------------------+
| Risk Category          | Severity Level    | Mitigation Mechanism              |
+------------------------+-------------------+-----------------------------------+
| Payment Delays         | Moderate / High   | State government receivables monitoring|
| Commodity Inflation    | Moderate          | Price escalation contract terms   |
| Monsoon Interruptions  | Seasonal / Medium | Accelerated H2 execution planning |
| Interest Rate Risk     | Moderate          | Debt reduction via project cash flow|
+------------------------+-------------------+-----------------------------------+
Working Capital Delays: Slower payment processing from municipal bodies or state utilities can stretch working capital cycles and drive borrowing needs.
Input Material Inflation: Unexpected spikes in global steel, cement, or fuel prices could weigh on contract margins despite escalation clauses.
Execution Bottlenecks: Delays in land acquisition, site clearings, or environmental permits can slow quarterly revenue generation.
SWOT Analysis Table
| Strengths (S) | Weaknesses (W) |
• Order book of ₹81,214 Cr (~3.9x cover) | • High working capital requirement |
• Diversified footprint across 5+ EPC verticals | • Elevated interest cost load (₹198 Cr/qtr) |
| • Established bidding capabilities and asset base | • Sub-contractor cost dependency |
| • Low promoter share pledge (~3.8%) | • EBITDA margins capped below ~10% |
| Opportunities (O) | Threats (T) |
| • Expanding national infrastructure outlays | • Prolonged monsoon-related site work delays |
| • Smart metering and power grid upgrades | • Material price inflation across steel & cement |
| • Higher government outlays for water projects | • State government budget re-allocations |
| • Real estate portfolio monetization | • Tightening credit and banking guarantee limits |
Five Important Charts to Insert
To enhance visual analysis for readers, the following charts should be embedded:
Chart 1: Consolidated Revenue & Net Profit Trend (Q1 FY26 to Q1 FY27)
Type: Dual-axis Bar & Line Chart.
Data: Quarterly operational revenue alongside net profit attributable to shareholders.
Chart 2: EBITDA & Margin Trajectory (Quarterly)
Type: Line Chart showing EBITDA in ₹ Crore and EBITDA Margin percentage over the past 5 quarters.
Chart 3: Consolidated Order Book Composition by Division
Type: Donut Chart displaying order book percentages across Buildings, Water, Electrical, Transportation, and Mining.
Chart 4: Shareholding Pattern Breakdown
Type: Pie Chart illustrating Promoter, FII, DII, Mutual Fund, and Retail public equity distribution.
Chart 5: Stock Price relative to Key Moving Averages (1-Year Trend)
Type: Candlestick Chart with overlay lines for 50-day and 200-day Simple Moving Averages (SMA).
Five Important Infographics to Insert
Infographic 1: Q1 FY27 Earnings Dashboard
Visuals: Prominent metric cards displaying Revenue (₹5,811.83 Cr), Net Profit (₹216.40 Cr), EBITDA (₹545.12 Cr), and Order Book (₹81,214 Cr).
Infographic 2: The EPC Execution Life Cycle
Visuals: Step-by-step process flow illustrating Tender Bidding $\rightarrow$ Order Award $\rightarrow$ Sub-contracting $\rightarrow$ Material Sourcing $\rightarrow$ Milestone Billing $\rightarrow$ Cash Realization.
Infographic 3: Segment Revenue Mix Breakdown
Visuals: Visual comparison highlighting Construction (99.1%) vs. Real Estate (0.9%).
Infographic 4: Geographic & Vertical Footprint
Visuals: Map of India marking core project regions across water supply networks, transportation corridors, and smart meter deployments.
Infographic 5: Investment Risk-Reward Heatmap
Visuals: Comparison matrix balancing growth catalysts against working capital and inflationary risks.
Investor Takeaways
================================================================================
                         STRATEGIC INVESTMENT HORIZONS
================================================================================

[ SHORT TERM (0-6 Months) ]
* Track H2 FY27 execution pace post-monsoon.
* Monitor order intake during autumn government tendering cycles.
* Key Technical Levels: Support near ₹130–₹135; Resistance near ₹160–₹170.

[ MEDIUM TERM (1-2 Years) ]
* Monitor cash conversion cycles and working capital stability.
* Look for EBITDA margins expanding toward the 9.5% level.
* Track debt management and interest coverage ratio improvements.

[ LONG TERM (3-5 Years) ]
* Value creation driven by multi-year infrastructure order execution.
* Potential re-rating if working capital cycles tighten and return metrics expand.
================================================================================
Is NCC a Good Long-Term Investment?
From a fundamental equity research perspective, NCC Limited represents a established play on India’s expanding infrastructure market.
Factors Supporting Long-Term Investment
Substantial Revenue Cover: An order book standing at ₹81,214 crore provides execution visibility spanning several years.
Reasonable Valuations: Trading at roughly 13.3x trailing earnings and 1.12x book value, the stock presents an entry valuation compared to historical sector averages.
Segment Diversification: Operational capabilities across buildings, water, power, and transport cushion earnings against downturns in any single segment.
Counter-Balancing Factors
Margin Caps: As a public-contract EPC developer, operating margins remain structurally bounded within the 8.5%–9.5% range.
Working Capital Usage: Capital intensity requires continuous bank credit line management and ongoing interest costs.
Verdict: NCC Limited offers a balanced investment profile for equity investors seeking exposure to Indian infrastructure growth at reasonable valuations. Investors should monitor quarterly receivables and execution progress post-monsoon.
Final Editorial Verdict
NCC Limited’s Q1 FY27 financial results show a company continuing to deliver steady top-line growth. With consolidated operational revenues rising 12.2% YoY to ₹5,811.83 crore, net profits expanding to ₹216.40 crore, and a consolidated order book standing at ₹81,214 crore, the company’s core construction engine remains healthy.
While rising finance charges and working capital needs remain key operational monitorables, the company’s diversified order book and conservative valuation multiples provide structural support. For long-term investors tracking Indian capital expenditure trends, NCC Limited remains an important infrastructure stock to watch as execution picks up in the second half of FY27.



