

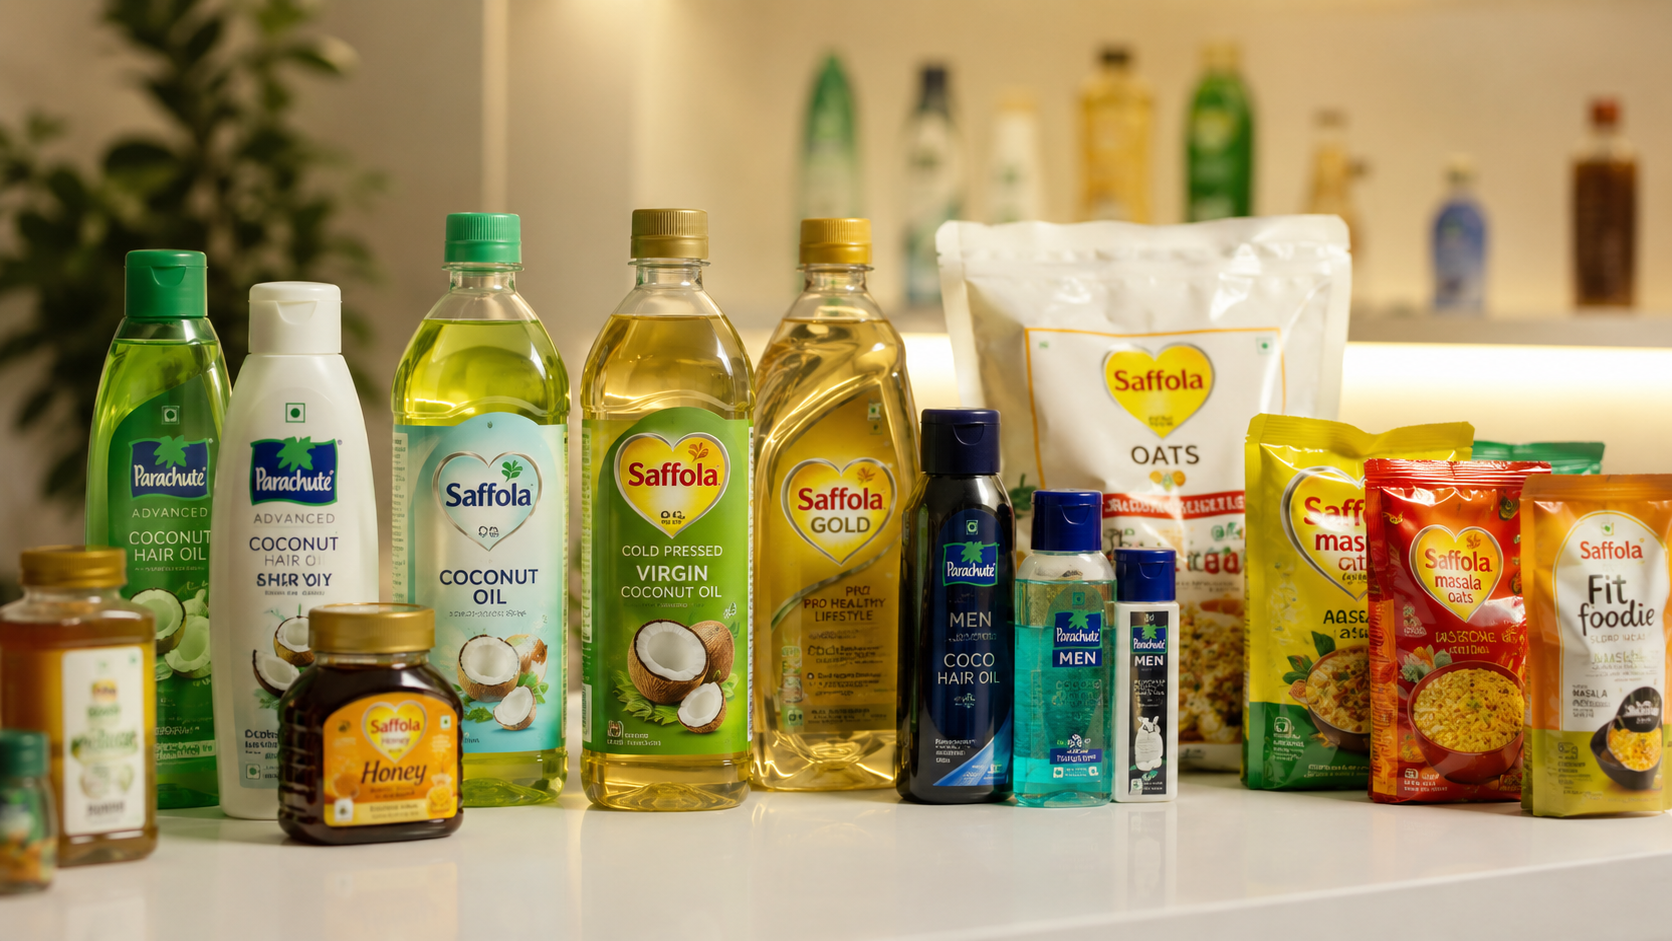
Introduction
India’s Fast-Moving Consumer Goods (FMCG) sector faced an evolving operating environment in the first quarter of Fiscal Year 2026–27. While domestic economic activity remained resilient, supported by steady private consumption, FMCG players navigated commodity price movements, localized weather disruptions, and shifting trade channel dynamics.
Against this backdrop, Marico Limited published its un-audited consolidated financial results for the quarter ended June 30, 2026, delivering broad-based operational and financial gains. The Mumbai-headquartered consumer goods company demonstrated strong volume growth across its core domestic portfolio while continuing to scale up its emerging growth engines in Foods, Premium Personal Care, and Digital-First brands.
                 ┌──────────────────────────────────────────────┐
                 │         MARICO Q1 FY27 DUAL ENGINE           │
                 │      Domestic Strength vs. Global CCG        │
                 └──────────────────────┬───────────────────────┘
                                        │
        ┌───────────────────────────────┼───────────────────────────────┐
        │                               │                               │
┌───────┴───────┐               ┌───────┴───────┐               ┌───────┴───────┐
│ India Volume  │               │ India Revenue │               │ Int'l CCG     │
│ 11.00% YoY    │               │ ₹3,003 Crore  │               │ 15.00% YoY    │
│ (20-Qtr High) │               │ (+21.00% YoY) │               │ (Broad-based) │
└───────────────┘               └───────────────┘               └───────────────┘
For equity analysts and institutional investors, Marico’s Q1 FY27 financial results show a combination of market share gains in mature categories alongside portfolio diversification. The company’s strategy—centered on reducing reliance on commodity-linked lines while building margin-accretive personal care and foods franchises—is reflected in its recent operational metrics.
Company Overview & Business Model
Founded in 1988 by Harsh Mariwala, Marico Limited has transformed from a domestic coconut oil and edible oil packager into an international consumer products group operating across hair care, skin care, edible oils, healthy foods, male grooming, and digital-first personal care.
                  ┌──────────────────────────────────────────┐
                  │              MARICO LIMITED              │
                  │        Consolidated FMCG Portfolio       │
                  └─────────────────────┬────────────────────┘
                                        │
         ┌──────────────────────────────┼──────────────────────────────┐
         │                              │                              │
┌────────┴────────┐            ┌────────┴────────┐            ┌────────┴────────┐
│  Domestic Core  │            │ Emerging Growth │            │  International  │
│  Commodity/Mass │            │ Foods & Digital │            │ Regional Units  │
└────────┬────────┘            └────────┬────────┘            └────────┬────────┘
         │                              │                              │
 ┌───────┴───────┐              ┌───────┴───────┐              ┌───────┴───────┐
 │ • Parachute   │              │ • Saffola Oats│              │ • Bangladesh  │
 │   Coconut Oil │              │ • True Element│              │ • Vietnam     │
 │ • Saffola Oils│              │ • Beardo/Plix │              │ • MENA Region │
 │ • Nihar/VAHO  │              │ • Cosmix/4700 │              │ • South Africa│
 └───────────────┘              └───────────────┘              └───────────────┘
How Marico Makes Money
Marico operates an integrated FMCG manufacturing, sourcing, branding, and distribution business model:
Core Coconut & Edible Oils Franchise: Generates high-volume cash flows via Parachute Coconut Oil and Saffola Edible Oils. Sourcing efficiencies in raw copra and crude vegetable oils enable Marico to maintain high market shares while funding portfolio diversification.
Value-Added Hair Oils (VAHO): Operates across mass, mid-tier, and premium price tiers through brands like Nihar Naturals, Parachute Advansed, and Hair Care Almond, delivering higher gross margins than unbranded coconut oils.
Foods & Health Segment: Leverages the trust in the Saffola brand name to enter adjacent healthy snacking and breakfast categories, including Saffola Oats, Soya Chunks, Muesli, and acquired nutrition brands like True Elements, 4700BC, and Cosmix.
Digital-First & Premium Personal Care: Focuses on urban, e-commerce, and quick-commerce channels through digital-native acquisitions like Beardo (male grooming), Plix (plant-based nutrition), and Just Herbs (Ayurvedic beauty).
International Expansion: Builds category leadership in emerging markets across South Asia, Southeast Asia, the Middle East, North Africa, and Sub-Saharan Africa.
Q1 FY27 Detailed Financial Performance
During the quarter ended June 30, 2026, Marico reported a 23% YoY increase in consolidated top-line revenue from operations to ₹3,957 crore (restated). Profitability saw a matching 25% YoY increase in both EBITDA and net profit.
Table 1: Quarterly Financial Highlights (Consolidated)
| Financial Metric (₹ Crore) | Q1 FY27 Reported | Q1 FY26 (Restated) | YoY Change (%) | FY26 Full Year |
| Revenue from Operations | ₹3,957 | ₹3,221 | +23.00% | ₹13,478 |
| Material Cost (Raw + Packaging) | ₹2,112 | ₹1,730 | +22.08% | ₹7,559 |
| Gross Profit | ₹1,845 | ₹1,491 | +23.74% | ₹5,919 |
| Gross Margin (%) | 46.63% | 46.29% | +34 bps | 43.91% |
| Advertising & Sales Promotion (ASP) | ₹327 | ₹261 | +25.29% | ₹1,167 |
| Employee Cost | ₹269 | ₹220 | +22.27% | ₹916 |
| Other Expenses | ₹430 | ₹355 | +21.13% | ₹1,508 |
| EBITDA | ₹819 | ₹655 | +25.04% | ₹2,328 |
| EBITDA Margin (%) | 20.70% | 20.30% | +40 bps | 17.30% |
| Profit Before Tax (PBT) | ₹790 | ₹656 | +20.43% | ₹2,277 |
| Reported PAT | ₹630 | ₹504 | +25.00% | ₹1,762 |
| Recurring PAT (excl. one-offs) | ₹630 | ₹504 | +25.00% | ₹1,762 |
Table 2: Year-on-Year (YoY) Growth Metrics
| Performance Indicator | Q1 FY27 YoY Growth | Key Contributing Factors |
| India Business Revenue Growth | +21.00% | Strong 11% volume underlying expansion plus pricing actions. |
| India Business Volume Growth | +11.00% | Double-digit growth in Parachute Rigids and VAHO scaling. |
| International Business Growth (INR) | +29.00% | Favorable currency movements and constant currency outperformance. |
| International Business CCG | +15.00% | Led by Vietnam (+27% CCG) and MENA (+24% CCG). |
| Consolidated EBITDA Growth | +25.00% | Driven by top-line operating leverage and copra cost savings. |
Table 3: Quarter-on-Quarter (QoQ) Comparison
| Financial Metric (₹ Crore) | Q1 FY27 | Q4 FY26 | QoQ Change (%) |
| Revenue from Operations | ₹3,957 | ₹3,301 (Restated) | +19.87% |
| EBITDA | ₹819 | ₹522 | +56.90% |
| EBITDA Margin (%) | 20.70% | 15.80% | +490 bps |
| Material Cost Ratio (%) | 53.40% | 55.60% | -220 bps |
| ASP Ratio (% of Revenue) | 8.30% | 8.70% | -40 bps |
Segment-Wise & Brand-Wise Analysis
Marico’s domestic portfolio spans several distinct product categories.
Q1 FY27 India Revenue Contribution by Category

 ┌─────────────────────────────────────────────────────────┐
 │ Parachute Coconut Oil (35%)                             │
 └─────────────────────────────────────────────────────────┘
 ┌───────────────────────────────────┐
 │ Value Added Hair Oils (18%)       │
 └───────────────────────────────────┘
 ┌───────────────────────────────┐
 │ Saffola Edible Oils (16%)     │
 └───────────────────────────────┘
 ┌─────────────────────────────────────────────────────────┐
 │ Foods, Premium Personal Care & Digital-First (24%)      │
 └─────────────────────────────────────────────────────────┘
 ┌─────────┐
 │ Others  │
 └─────────┘
Table 4: Business Segment Performance (Domestic)
| Product Category / Franchise | Contribution to India Revenue | Volume Growth (Q1 FY27) | Value / Revenue Growth | Market Share Status (MAT Jun’26) |
| Parachute Coconut Oil | 35.00% | +10.00% YoY | +23.00% YoY | 59.00% (+400 bps gain, #1 Rank) |
| Value-Added Hair Oils (VAHO) | 18.00% | Broad-based growth | +22.00% YoY | 29.00% (+80 bps gain, #1 Rank) |
| Saffola Edible Oils | 16.00% | High-Single-Digit Decline | +7.00% YoY | Strong leadership in premium blends |
| Saffola Foods Portfolio | Category Component | Double-digit growth | +43.00% YoY | 42.00% share in Saffola Oats (#1 Rank) |
| Premium Personal Care & Digital | Category Component | High double-digit | ARR ~₹450 Cr | 44% Serums share; 51% Gels share |
1. Parachute Coconut Oil
Parachute Rigids posted a 10% volume growth during Q1 FY27, delivering one of its strongest underlying performances in recent years. Revenue expanded by 23% YoY, supported by selective price adjustments designed to pass value to consumers amid softening copra prices. Parachute strengthened its market leadership, gaining 400 basis points in volume market share to hit a record 59%.
2. Value-Added Hair Oils (VAHO)
The Value-Added Hair Oils franchise recorded a 22% YoY value growth. Market share expanded by 80 basis points on a MAT basis to 29%, maintaining Marico’s rank as the market leader in the hair oils category. Growth was driven by premiumization across key franchises and strong consumer traction in the Almond hair oil range.
3. Saffola Edible Oils
Saffola Edible Oils reported a 7% revenue growth, despite a high-single-digit volume decline. The volume decline resulted from a strategic decision to rationalize the supply of select low-margin trade variants to protect overall category profitability. Premium cold-pressed oil offerings experienced steady consumer demand, and selective price increases were implemented to manage rising input costs in raw vegetable oils.
4. Foods Portfolio
Marico’s Foods division recorded a 43% YoY growth rate, crossing ₹1,300 crore in annualized revenue run-rate. Saffola Oats maintained its market leadership with a 42% volume market share. Adjacent lines—including Saffola Soya Chunks, Saffola Muesli, True Elements, 4700BC Gourmet Popcorn, and Cosmix plant-based protein—delivered positive sequential and year-on-year sales growth.
5. Premium Personal Care & Digital-First Brands
The Premium Personal Care portfolio (encompassing hair nourishment, skin care, male grooming, and hair cleansing) reached an Annualized Revenue Run-rate (ARR) of ~₹450 crore. Digital-first brands Beardo and Plix continued to scale up profitably, supported by growth in modern trade and quick-commerce channels.
International Business Performance
Marico’s International business delivered a 15% Constant Currency Growth (CCG) in Q1 FY27, with total overseas revenue reaching ₹954 crore (+29% YoY in INR terms). Growth was supported by strong performance in Southeast Asia and the MENA region.
Table 5: International Business Performance
| Geographical Market | Q1 FY27 CCG (%) | Key Growth Drivers & Market Context |
| Vietnam | +27.00% | Strong traction in male/female grooming; GTM & e-commerce acceleration. |
| MENA (Middle East & N. Africa) | +24.00% | Resilient execution and distribution expansion across Gulf and Egypt. |
| South Africa | +8.00% | Driven by the core ethnic Hair Care portfolio. |
| Bangladesh | +4.00% | Moderated due to a high prior-year base and inflation-linked demand softness. |
| NCD & Exports | +16.00% | Expansion into neighboring export territories. |
| Total International Business | +15.00% CCG | Revenue: ₹954 Crore (+29% YoY in INR terms). |
International Business Revenue Share Evolution

  Non-Bangladesh Portfolio Share:
  • FY20: ~50%
  • FY26: ~55%
  • FY27E: ~59%
  • FY30 Target: ~65%

  Premium Categories Share in International Revenue:
  • FY20: ~20%
  • FY26: ~30%
  • FY30 Target: ~40%
The non-Bangladesh portfolio expanded its contribution to overall international revenues to 59% in Q1 FY27, up from 50% in FY20, progressing toward the group’s long-term target of 65% by FY30.
Cost Structure & Margins Analysis
Marico’s operating margin structure improved during Q1 FY27 due to input cost trends and gross margin realization.
Table 6: Margins & Expenditure Analysis (Consolidated)
| Cost & Margin Element | Q1 FY27 (% of Revenue) | Q4 FY26 (% of Revenue) | Q1 FY26 (% of Revenue) | FY26 Full Year |
| Material Cost (Raw + Pkg) | 53.40% | 55.60% | 53.70% | 56.10% |
| Advertising & Promotion (ASP) | 8.30% | 8.70% | 8.10% | 8.70% |
| Personnel / Employee Costs | 6.80% | 7.20% | 6.80% | 6.80% |
| Other Operating Expenses | 10.90% | 12.70% | 11.00% | 11.20% |
| EBITDA Margin | 20.70% | 15.80% | 20.30% | 17.30% |
| EBITDA Margin Before ASP | 29.00% | 24.50% | 28.40% | 25.90% |
Key Raw Material Price Trends (YoY Movements in Q1 FY27)

  Copra Prices:                   ▼ -29% YoY  (Favorable Input Tailwind)
  Rice Bran Oil (RBO):            ▲ +23% YoY  (Input Inflation)
  Liquid Paraffin (LLP):          ▲ +97% YoY  (Crude-linked Inflation)
  High-Density Polyethylene (HDPE):▲ +65% YoY  (Packaging Cost Pressure)
Copra Cost Savings: Copra market prices declined 29% YoY, helping offset cost pressures across crude-linked inputs like Liquid Paraffin (+97% YoY) and HDPE packaging (+65% YoY).
Reinvestment in Brand Equity: Marico increased advertising and promotional investments by 25% YoY to ₹327 crore, maintaining its ASP-to-revenue ratio at 8.3% to support new product launches.
Working Capital & Balance Sheet Snapshot
Marico maintains a conservative balance sheet characterized by negative net debt, zero long-term leverage, and working capital ratios.
Table 7: Working Capital Efficiency Metrics
| Working Capital Parameter | Q1 FY27 (Days) | Q4 FY26 (Days) | Operational Impact / Trend |
| Debtors Turnover | 31 Days | 39 Days | Improved receivables collection across trade channels. |
| Inventory Turnover | 40 Days | 43 Days | Optimized raw material and finished goods stock levels. |
| Net Working Capital | 26 Days | 34 Days | 30.7% reduction in working capital days QoQ. |
Management Commentary & Conference Call Highlights
Saugata Gupta, Managing Director and CEO of Marico Limited, summarized the quarterly performance during the investor call:
“Our Q1 performance is a reaffirmation of our strategic clarity, execution quality, and growth model—resilient core brands, accelerating premium and digital play, and a diversified international growth engine. With 23% revenue growth driven by double-digit volume growth in India and 25% profit growth—our highest in the last 28 quarters—we have a great start to the year. We are advancing ahead with greater confidence and clarity to deliver our full-year aspirations and in our journey towards Vision 2030, guided by our Fewer, Bigger, Bolder, and Faster philosophy.”
                     ┌────────────────────────────────────────┐
                     │     MARICO VISION 2030 STRATEGY        │
                     └───────────────────┬────────────────────┘
                                         │
        ┌────────────────────────────────┼────────────────────────────────┐
        │                                │                                │
┌───────┴───────┐                ┌───────┴───────┐                ┌───────┴───────┐
│ Revenue Target│                │ Profitability │                │ Portfolio Mix │
│ ₹20,000+ Cr   │                │ Mid-Teens     │                │ Foods & PPC   │
│ Consolidated  │                │ EBITDA CAGR   │                │ 33% Share     │
└───────────────┘                └───────────────┘                └───────────────┘
Key Management Guidance Summary
FY27 Top-Line Outlook: On track to achieve double-digit revenue growth and cross the ₹15,000 crore revenue mark in FY27.
FY27 Margin Guidance: Target high-teen EBITDA growth for the full year, supported by operating leverage and structural cost-management under the ‘MarVal’ program.
Domestic Volume Expectations: Expect to sustain high single-digit (HSD) volume growth in the Indian market through FY27.
International CCG Expectations: Expect to deliver mid-teens constant currency growth across overseas operations.
Long-Term Vision 2030: Targeting ₹20,000+ crore in consolidated top-line revenue by FY30, supported by a mid-teens EBITDA CAGR.
Project SETU, Distribution & Digital Transformation
To support long-term volume growth, Marico is executing Project SETU, a 3-year phased go-to-market (GTM) transformation plan:
Project SETU Implementation Roadmap

  Phase 1 (FY24): Direct Reach Baseline (1.0x)
  Phase 2 (FY25-26): Direct Reach Expansion & AI Integration
  Phase 3 (FY27 Target): 1.5x Direct Reach Expansion
Direct Reach Expansion: Expanding direct distribution coverage by 1.5x by FY27 across urban and rural traditional trade channels.
Assortment Optimization: Improving product assortment to drive penetration in premium value-added hair oils, hair care, and foods.
Channel Specific Coverage: Expanding direct reach into chemist, cosmetic, and specialty food outlets, alongside pan-India rural coverage.
Quick-Commerce Acceleration: E-commerce sales grew rapidly, led by >50% YoY growth in Quick-Commerce platforms (e.g., Blinkit, Zepto, Instamart).
ESG Performance & Sustainability Highlights
Marico continues to track its Environmental, Social, and Governance (ESG) metrics as outlined in its Integrated Annual Report:
Emissions Reduction: Achieved an 87% reduction in Scope 1 and Scope 2 greenhouse gas emissions intensity compared to its FY13 baseline.
Renewable Energy Integration: Sourced 76.66% of its total manufacturing energy from renewable sources.
Water Stewardship: Reduced manufacturing water withdrawal intensity by 29% compared to FY25, creating ~570 crore liters of cumulative water conservation potential.
Circular Economy: Maintained a 95% recyclable packaging material share and processed 27,191 MT of post-consumer plastic waste under Extended Producer Responsibility (EPR) guidelines.
Sustainable Agriculture: Enrolled 2.06 lakh farmers across 4.83 lakh acres of farmland under coconut productivity improvement initiatives.
Peer Comparison & Industry Landscape
Marico operates alongside several established domestic and multinational FMCG competitors in India.
Table 10: Peer Comparison
| Company Name | Market Cap (₹ Cr) | Revenue Growth (YoY) | PAT Growth (YoY) | EBITDA Margin (%) | Trailing P/E (x) | ROE (%) | Dividend Yield (%) |
| Marico Ltd. | ~₹88,500 | +23.00% | +25.00% | 20.70% | ~50.2x | ~35.5% | ~1.65% |
| Hindustan Unilever | ~₹575,000 | +4.50% | +3.20% | 23.50% | ~56.8x | ~20.2% | ~1.60% |
| Dabur India | ~₹102,000 | +7.00% | +8.10% | 19.50% | ~53.4x | ~21.5% | ~1.15% |
| Godrej Consumer | ~₹142,000 | +11.20% | +13.50% | 21.20% | ~58.1x | ~18.8% | ~1.00% |
| Emami Ltd. | ~₹36,000 | +9.50% | +11.00% | 26.00% | ~38.5x | ~28.0% | ~1.40% |
| Colgate-Palmolive | ~₹86,000 | +13.00% | +16.20% | 31.80% | ~57.2x | ~72.0% | ~1.90% |
Valuation Analysis & Share Price Performance
Trading around ₹680–₹690 per share on the National Stock Exchange (NSE), Marico carries a market capitalization of approximately ₹88,500 crore.
Table 11 & 12: Analyst Consensus & Target Prices
| Brokerage / Research House | Rating Recommendation | 12-Month Target Price (₹) | Key Investment Assumptions |
| Motilal Oswal | BUY | ₹760 | Domestic volume acceleration; margin expansion in Foods. |
| Nuvama Institutional | BUY | ₹775 | Strong execution in Parachute; scale-up of Digital-first brands. |
| ICICI Securities | ADD / BUY | ₹740 | Copra price tailwinds; International CCG stability. |
| Jefferies | BUY | ₹780 | Portfolio shift toward premium personal care and foods. |
| Goldman Sachs | BUY | ₹765 | Earnings compounding under Vision 2030 targets. |
SWOT Analysis
                      ┌──────────────────────────────────────┐
                      │         MARICO LIMITED SWOT          │
                      └──────────────────┬───────────────────┘
                                         │
        ┌────────────────────────────────┼────────────────────────────────┐
        │                                │                                │
┌───────┴───────┐                ┌───────┴───────┐                ┌───────┴───────┐
│ Strengths     │                │ Weaknesses    │                │ Opportunities │
│ • 59% Market  │                │ • Copra Price │                │ • Quick-Com.  │
│   Share Hydro │                │   Sensitivity │                │   Scaling     │
│ • Strong Brand│                │ • Saffola Oil │                │ • Premium     │
│   Equity      │                │   Volatile    │                │   PersonalCare│
└───────────────┘                └───────────────┘                └───────────────┘
| Factor | Detailed Strategic Assessment |
| Strengths | Market leadership in coconut oil (59% share) and VAHO (29% share); strong direct distribution network; debt-free balance sheet. |
| Weaknesses | Raw material cost sensitivity to copra and vegetable oil market fluctuations; volume rationalization in Saffola Edible Oils. |
| Opportunities | Expansion of the Foods portfolio to ₹1,300+ Cr run-rate; rapid growth in quick-commerce channels; portfolio premiumization in International markets. |
| Threats | Persistent food inflation dampening discretionary rural spending; geopolitical risks in overseas markets like Bangladesh. |
Investment Thesis & Bull/Bear Scenarios
                     ┌────────────────────────────────────────┐
                     │          INVESTMENT SCENARIOS          │
                     └──────────────────┬────────────────────┘
                                         │
        ┌────────────────────────────────┼────────────────────────────────┐
        │                                │                                │
┌───────┴───────┐                ┌───────┴───────┐                ┌───────┴───────┐
│ Bull Case     │                │ Base Case     │                │ Bear Case     │
│ Target: ₹820  │                │ Target: ₹760  │                │ Target: ₹590  │
│ High Single-  │                │ HSD Volume    │                │ Copra Price   │
│ Digit Volume  │                │ Growth        │                │ Spike         │
└───────────────┘                └───────────────┘                └───────────────┘
Bull Case (Target: ₹820): Domestic volume growth exceeds 10% consistently, copra prices remain low, and Foods/Digital-First EBITDA margins expand to the mid-teens ahead of schedule.
Base Case (Target: ₹760): Domestic volume grows at a high single-digit rate, international CCG holds in the mid-teens, and consolidated revenue crosses ₹15,000 crore in FY27.
Bear Case (Target: ₹590): Copra prices spike sharply, food inflation dampens rural demand, or political instability disrupts the Bangladesh overseas division.



