

Introduction: The Strategic Imperative of Green Financing
The global energy transition is no longer merely an environmental objective; it has evolved into a key pillar of national macroeconomic security and industrial strategy. At the core of India’s aggressive decarbonization roadmap—aiming for 500 GW of non-fossil fuel power capacity by 2030 and Net Zero emissions by 2070—lies the challenge of capital mobilization. Renewable infrastructure projects require high upfront capital expenditures, specialized underwriting capabilities, and extended tenure financing structures.
In this landscape, the Indian Renewable Energy Development Agency Ltd. (IREDA) serves a crucial function. As a specialized Non-Banking Financial Company (NBFC) under the administrative control of the Ministry of New and Renewable Energy (MNRE), IREDA acts as a dedicated financial bridge connecting policy objectives with institutional capital deployment.
The publication of IREDA’s Q1 FY27 financial results for the quarter ended June 30, 2026, provides an opportunity to evaluate the health of India’s green financing machinery. Equity investors, fixed-income market participants, and policy analysts track IREDA’s quarterly performance not only to gauge the institution’s standalone profitability, but also as a leading indicator for project execution velocity across solar, wind, hydro, battery energy storage, and green hydrogen sectors.
+-----------------------------------------------------------------------------------+
|                            IREDA: Financial Flow Overview                         |
+-----------------------------------------------------------------------------------+
|  Capital Raising  --->  Balance Sheet Cushion  --->  Project Loan Disbursements  |
|  * Bond Issues          * CRAR: 20.30%              * Total Loans: ₹94,852 Cr     |
|  * Bank Borrowings      * Net Worth: ₹14,133 Cr     * Primary Sector: Solar & Wind|
+-----------------------------------------------------------------------------------+
Company Overview: Business Model & Market Positioning
Founded in 1987, IREDA is a Systemically Important Non-Deposit taking Non-Banking Financial Company (NBFC-ND-SI) registered with the Reserve Bank of India (RBI). Granted ‘Navratna’ status by the Government of India, IREDA operates as a pure-play specialized institution financing the renewable energy (RE) and energy efficiency (EE) sectors.
Revenue Model and Financing Structure
IREDA generates revenue primarily through:
Interest Income: Interest earned on long-term project loans, term loans, and short-term working capital facilities granted to renewable project developers.
Fee & Commission Income: Upfront processing fees, loan documentation charges, monitoring fees, and advisory service charges.
Treasury & Investment Income: Gains on fair value changes of investments, interest on bank deposits, and liquid fund management.
Unlike diversified power lenders, IREDA’s loan portfolio is concentrated in clean energy infrastructure, providing specialized underwriting protocols tailored to variable renewable energy generation profiles, power purchase agreement (PPA) counterparty risks, and technology risk assessments.
Key Competitive Advantages
Sovereign Backing & Policy Alignment: As a government-owned central public sector enterprise (CPSE), IREDA benefits from sovereign sponsorship, facilitating access to concessional international credit lines (from multilateral development banks such as KFW, ADB, and JICA) alongside low-cost domestic bond markets.
First-Mover Expertise: Over three decades of specialized domain experience in technical evaluation and underwriting of emerging renewable technologies.
Dedicated Subsidiary Presence: The establishment of IREDA Global Green Energy Finance IFSC Limited in GIFT City, Gujarat, enables international green capital pooling and cross-border currency financing.
Q1 FY27 Financial Highlights: Standalone & Consolidated
IREDA’s Board of Directors formally approved the unaudited standalone and consolidated financial results for the quarter ended June 30, 2026, during its meeting held on August 3, 2026. The joint statutory auditors, Shiv & Associates and Rao & Emmar, conducted a limited review report issuing an unqualified opinion with no audit qualifications.
Standalone Quarterly Performance Summary
| Financial Metric | Q1 FY27 (Ended June 30, 2026) | Q4 FY26 (Ended March 31, 2026) | Q1 FY26 (Ended June 30, 2025) | YoY Growth (%) | QoQ Growth (%) |
Interest Income | ₹2,197.80 Cr | ₹2,138.33 Cr | ₹1,908.79 Cr | +15.14% | +2.78% |
Fees & Commission Income | ₹37.40 Cr | ₹12.14 Cr | ₹15.34 Cr | +143.81% | +208.07% |
Total Revenue from Operations | ₹2,248.39 Cr | ₹2,174.95 Cr | ₹1,947.29 Cr | +15.46% | +3.38% |
Other Income | ₹1.15 Cr | ₹5.95 Cr | ₹12.24 Cr | -90.60% | -80.67% |
Total Income | ₹2,249.54 Cr | ₹2,180.90 Cr | ₹1,959.53 Cr | +14.80% | +3.15% |
Finance Costs (Interest Expense) | ₹1,341.04 Cr | ₹1,240.85 Cr | ₹1,218.27 Cr | +10.08% | +8.07% |
Impairment on Financial Instruments | ₹418.54 Cr | ₹215.29 Cr | ₹362.61 Cr | +15.42% | +94.41% |
Total Expenses | ₹1,836.82 Cr | ₹1,561.64 Cr | ₹1,654.90 Cr | +10.99% | +17.62% |
Profit Before Tax (PBT) | ₹412.72 Cr | ₹619.26 Cr | ₹304.63 Cr | +35.48% | -33.35% |
Tax Expense (Current + Deferred) | ₹75.22 Cr | ₹126.51 Cr | ₹57.95 Cr | +29.80% | -40.54% |
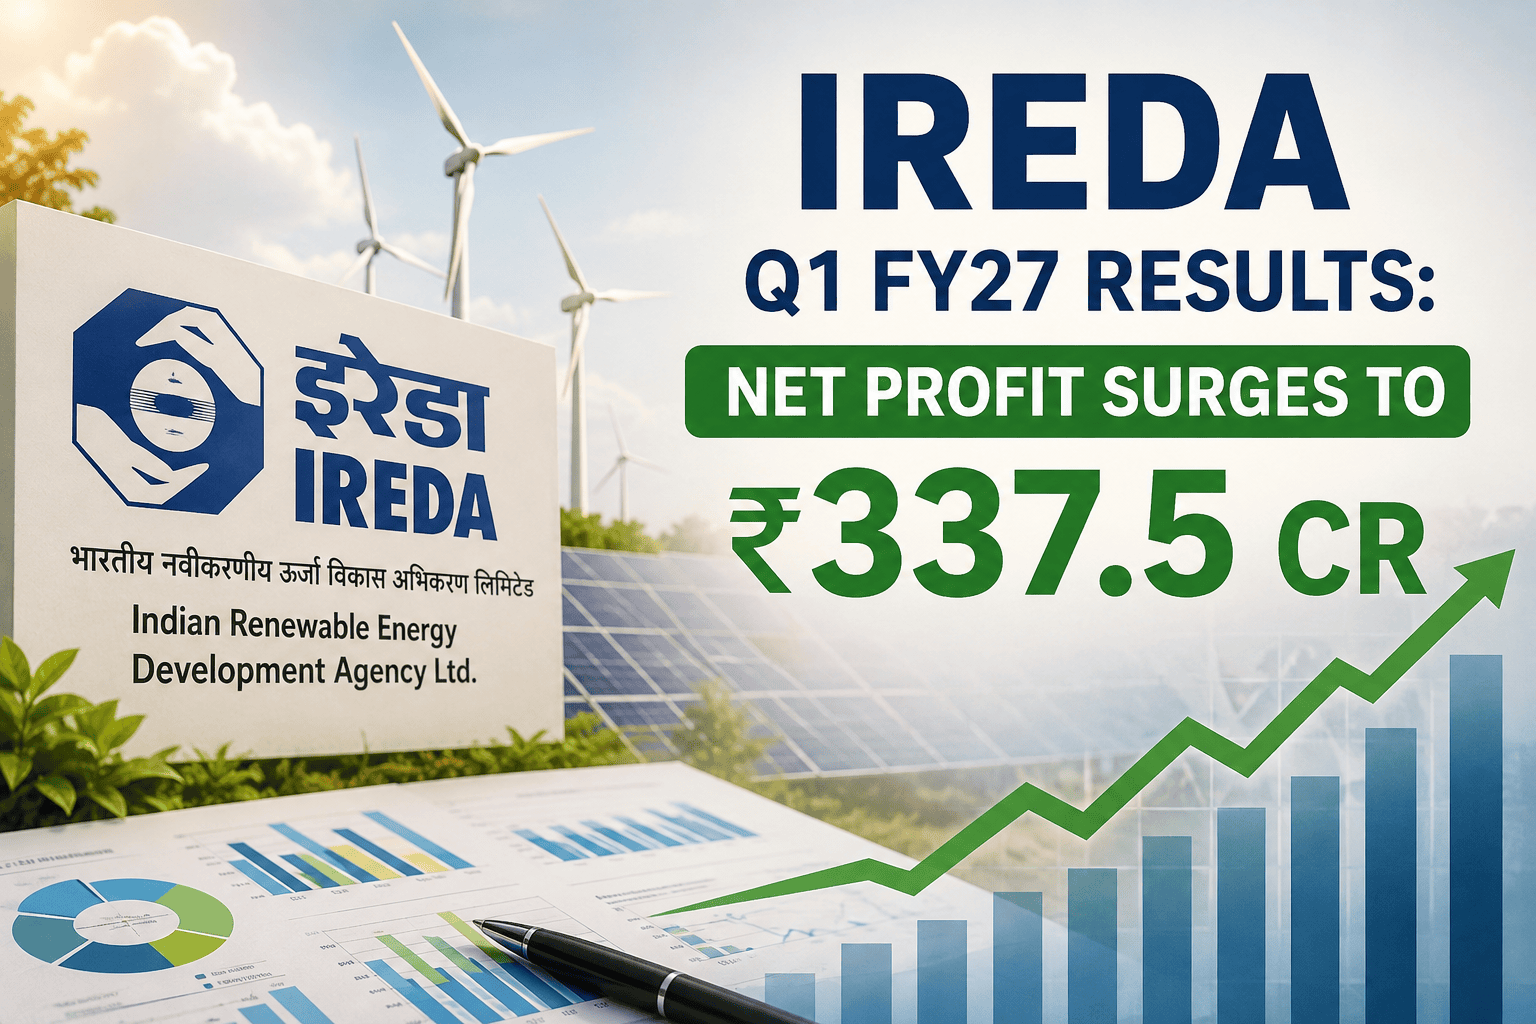
Net Profit After Tax (PAT) | ₹337.50 Cr | ₹492.75 Cr | ₹246.68 Cr | +36.82% | -31.51% |
Basic & Diluted EPS (₹) | ₹1.20 | ₹1.76 | ₹0.91 | +31.87% | -31.82% |
Visual Suggestion: Bar chart illustrating revenue from operations expanding from ₹1,947.29 Cr in Q1 FY26 to ₹2,248.39 Cr in Q1 FY27, juxtaposed against quarterly net profit trends.
Key Takeaways from Standalone Performance:
Topline Expansion: Total Revenue from Operations grew 15.46% year-on-year to ₹2,248.39 crore, driven by higher interest income from a expanding loan book.
Fee-Based Momentum: Fees and commission income rose to ₹37.40 crore, reflecting higher underwriting and processing activities during the quarter.
Profitability Dynamics: Standalone Net Profit grew 36.82% YoY to ₹337.50 crore compared to ₹246.68 crore in Q1 FY26. Sequentially (QoQ), profit registered a drop from ₹492.75 crore in Q4 FY26, primarily due to an increase in provisions/impairments on financial instruments to ₹418.54 crore compared to ₹215.29 crore in the preceding quarter.
Consolidated Results Overview
IREDA’s consolidated entity includes its wholly owned subsidiary, IREDA Global Green Energy Finance IFSC Limited.
Consolidated Total Income: ₹2,250.60 Cr (vs. ₹1,959.84 Cr in Q1 FY26).
Consolidated Net Profit: ₹338.53 Cr (vs. ₹246.88 Cr in Q1 FY26).
Consolidated Basic EPS: ₹1.21 per share.
Segment Analysis & Loan Book Breakdown
IREDA operates strictly as a specialized financial institution focused on renewable energy and infrastructure. Under Ind AS 108, the company reports a single primary operating segment: Providing Finance for Renewable Energy & Related Projects.
However, looking into the underlying loan exposure reveals a diversified distribution across energy generation technologies:
+--------------------------------------------------------------------------+
|                  IREDA Loan Asset Distribution Structure                  |
+--------------------------------------------------------------------------+
|  Solar Power Projects           | Primary Allocation Share (~32-35%)     |
|  Wind Energy Projects           | Core Legacy Exposure    (~20-22%)     |
|  Hydro & Biomass Power          | Stable Yield Assets     (~12-15%)     |
|  Emerging Technologies          | Green Hydrogen, BESS, EVs (~10-12%)    |
|  Transmission & Infrastructure  | Evacuation & Grid Lines (~15-18%)      |
+--------------------------------------------------------------------------+
Underlying Sub-Sector Dynamics
Solar Energy: Remains the largest allocation in the asset portfolio, driven by large-scale utility solar parks, rooftop solar programs (such as PM Surya Ghar), and PM-KUSUM agricultural solarization schemes.
Wind Power: Continues to yield steady cash flows through repowering projects and hybrid wind-solar contracts.
Hydro Power: Encompasses small hydro facilities along with growing participation in pumped storage hydro projects (PSPs) providing firm dispatchable clean power.
Emerging Clean Tech Segments:
Energy Storage Systems (BESS): Financing utility-scale battery installations to balance grid intermittency.
Green Hydrogen & Ammonia: Underwriting early-stage production infrastructure under the National Green Hydrogen Mission.
Electric Mobility (EV) & Charging Infrastructure: Extending credit to fleet operators, commercial EV financing intermediaries, and charging station networks.
Loan Book Size, Sanctions, and Disbursements
A key driver of long-term earning power for infrastructure NBFCs is loan book growth.
Loan Book Trend & Asset Base
| Portfolio Parameter | As at June 30, 2026 | As at June 30, 2025 | YoY Growth (%) |
Stage I & II Loans (Standard Assets) | ₹91,284.26 Cr | ₹76,549.79 Cr | +19.25% |
Stage III Loans (Credit Impaired Assets) | ₹3,567.62 Cr | ₹3,302.12 Cr | +8.04% |
Total Gross Loan Assets | ₹94,851.88 Cr | ₹79,851.91 Cr | +18.78% |
Cumulative Impairment Allowance | ₹3,099.55 Cr | ₹2,244.78 Cr | +38.08% |
| Net Loan Portfolio | ₹91,752.33 Cr | ₹77,607.13 Cr | +18.23% |
Visual Suggestion: Stacked column chart demonstrating total loan book expanding from ₹79,852 crore in Q1 FY26 toward the ₹95,000 crore mark in Q1 FY27.
Capital Deployment Efficiency
The expansion in gross loan assets to ₹94,851.88 crore reflects consistent project execution across green energy developers. Borrowing costs stayed structured through low-cost domestic bond issuances, including the private placement of ₹1,500 crore in Series XVIII-A Taxable Unsecured Bonds completed on June 24, 2026.
Asset Quality & Provisioning Analysis
For financial institutions engaged in long-term project finance, maintaining balance sheet health requires rigorous asset quality monitoring and prudent provisioning.
Non-Performing Asset (NPA) Metrics
| Asset Quality Metric | As at June 30, 2026 | As at June 30, 2025 | Variance / Trend |
Gross NPA Ratio (%) | 3.76% | 4.13% | Improved by -37 bps |
Net NPA Ratio (%) | 1.22% | 2.06% | Improved by -84 bps |
Provision Coverage Ratio (PCR – Stage III) | 68.22% | 51.10% | Strengthened by +1,712 bps |
Stage I & II Provisioning (%) | 0.73% | 0.73% | Stable |
Total Impairment Allowance Ratio (%) | 3.27% | 2.81% | Increased cushion (+46 bps) |
+-----------------------------------------------------------------------+
|                    IREDA Asset Quality Trajectory                     |
+-----------------------------------------------------------------------+
|  Gross NPA:  4.13% (June 2025)  --->  3.76% (June 2026)  [Down 37 bps]|
|  Net NPA:    2.06% (June 2025)  --->  1.22% (June 2026)  [Down 84 bps]|
|  PCR:       51.10% (June 2025)  ---> 68.22% (June 2026)  [Up 1,712 bps]
+-----------------------------------------------------------------------+
Analysis of Asset Quality Dynamics:
Structural Improvement in Asset Quality: Gross NPA improved from 4.13% as of June 30, 2025, to 3.76% as of June 30, 2026. Concurrently, Net NPA decreased from 2.06% to 1.22%.
Substantial Provisioning Strengthening: Provision Coverage Ratio (PCR) for Stage III credit-impaired assets rose from 51.10% to 68.22%. Total cumulative impairment loss allowances stood at ₹3,099.55 crore.
Judicial Classifications: Note 8 to the financial statements reveals that loan accounts totaling ₹394.00 crore continue to be classified as Stage II/I Standard instead of Stage III Non-Performing Assets pursuant to interim stay orders issued by High Courts. However, as a matter of financial prudence, IREDA has recognized interest income on these accounts strictly on a collection basis and created appropriate impairment allowances.
Margin Analysis & Key Operational Ratios
An examination of profitability margins highlights how efficiently IREDA translates asset growth into net profit:
| Operational Ratio / Margin | Q1 FY27 (Ended June 30, 2026) | Q1 FY26 (Ended June 30, 2025) | Directional Trajectory |
Operating Margin (%) | 18.31% (Standalone) / 18.34% (Consol) | 15.02% | Expanded by +329 bps |
Net Profit Margin (%) | 15.00% (Standalone) / 15.04% (Consol) | 12.59% / 12.60% | Expanded by +241 bps |
Capital Adequacy Ratio (CRAR) | 20.30% (Standalone) / 20.28% (Consol) | 19.58% | Strengthened (+72 bps) |
Debt-to-Equity Ratio | 5.59x | 5.35x | Controlled leverage |
Total Debt to Total Assets | 0.83x | 0.82x | Stable asset backing |
Margin Drivers:
Yield vs. Cost of Funds: Operating margin expanded to 18.31%, demonstrating effective spread management despite interest rate fluctuations across domestic money markets.
Capital Adequacy: Capital Adequacy Ratio (CRAR) reached 20.30%, well above the mandatory Reserve Bank of India minimum requirement of 15.0% for NBFCs. Tier I capital represents the dominant portion at ₹14,935.83 crore, providing a buffer for future loan book expansion.
Management Commentary & Strategic Governance Updates
Leadership and Operational Governance
As disclosed in Note 1 of the financial results, Dr. Bijay Kumar Mohanty serves as Chairman & Managing Director (Additional Charge) alongside his role as Director (Finance).
The company disclosed that its Audit Committee was not in existence effective March 28, 2026, due to the non-availability of required Independent Directors under the Companies Act and SEBI LODR Regulations. As a Central Public Sector Enterprise (CPSE), the power to appoint directors rests with the Government of India, and IREDA has formally requested the administrative ministry to finalize appointments.
Key Strategic Directives Highlighted by Management:
Funding Clean Energy Innovation: Active focus on underwriting newer technology verticals including Green Hydrogen, Pumped Hydro Storage, and Battery Energy Storage Systems (BESS).
International Capital Sourcing: Leveraging its GIFT City subsidiary (IREDA Global Green Energy Finance IFSC Limited) to source lower-cost foreign currency capital and issue green bonds.
Commitment to Asset Quality: Continuing proactive recovery measures and maintaining conservatism in ECL provisioning models.
Industry Context & Macroeconomic Tailwinds
IREDA operates within a supportive policy environment, shaped by India’s structural energy needs and government decarbonization targets.
+--------------------------------------------------------------------------+
|                  Macro Economic Pillars Driving IREDA Growth             |
+--------------------------------------------------------------------------+
|  500 GW Non-Fossil Target  ---> Mass Scale Utility Bidding Acceleration  |
|  PM Surya Ghar Scheme      ---> Decentralized Rooftop Solar Financing    |
|  Green Hydrogen Mission   ---> Capital Allocation for Electrolyzers      |
|  PLI Manufacturing Schemes ---> Domestic Solar Cell & Battery Capacity   |
+--------------------------------------------------------------------------+
Institutional Drivers:
PM Surya Ghar Muft Bijli Yojana: Providing subsidies and low-cost credit lines to scale rooftop solar installations across 10 million households, creating wholesale refinancing opportunities for NBFCs like IREDA.
National Green Hydrogen Mission: Aiming for at least 5 MMT of green hydrogen production capacity per annum by 2030, requiring an estimated outlay of over ₹8 lakh crore in total capital expenditures.
Grid-Scale Storage Obligations: Government mandates requiring distribution utilities to procure energy storage obligations (ESO), driving loan demand for large-scale battery storage facilities and pumped hydro storage assets.
Peer Comparison: Financial & Valuation Metrics
To evaluate IREDA’s positioning within the public infrastructure financing ecosystem, we compare its key metrics with leading peers: Power Finance Corporation (PFC) and REC Limited.
| Metric / Parameter | IREDA Ltd. (Q1 FY27) | Power Finance Corp (PFC) | REC Limited | Sector Average / Remarks |
| Market Cap (₹ Cr) | ~₹34,550 Cr | ~₹1,45,000 Cr | ~₹1,30,000 Cr | Specialized Clean Energy Pure-Play |
| Primary Exposure | 100% Clean Energy / RE | Power Infra (Thermal+RE) | Power Infra & Discom Financing | Pure ESG Focus for IREDA |
| Gross Loan Book (₹ Cr) | ₹94,852 Cr | >₹4,80,000 Cr | >₹5,00,000 Cr | Scale Advantage with PFC/REC |
| Gross NPA Ratio (%) | 3.76% | ~2.9% | ~2.6% | Asset quality improving across PSUs |
| Net NPA Ratio (%) | 1.22% | ~0.8% | ~0.7% | Higher PCR strengthening IREDA cushion |
| CRAR (%) | 20.30% | ~20.5% | ~21.0% | Strong capital adequacy across peers |
| Price-to-Earnings (P/E) | ~18.0x | ~7.5x | ~8.0x | IREDA commands a Green Growth Premium |
| Price-to-Book (P/B) | ~2.44x | ~1.20x | ~1.35x | Reflects specialized ESG mandate |
| Dividend Yield (%) | ~1.13% | ~3.8% | ~4.2% | PFC/REC offer higher current yield |
Note: Comparative metrics based on market updates and disclosures.
Balance Sheet & Capital Structure Analysis
Key Balance Sheet Line Items (As of June 30, 2026)
Net Worth: ₹14,132.50 Crore (Standalone) / ₹14,137.19 Crore (Consolidated), compared to ₹12,401.86 Crore as of June 30, 2025.
Paid-Up Equity Capital: ₹2,809.23 Crore (Face value ₹10 per share).
Total Outstanding Debt / Financial Indebtedness: ₹79,002.01 Crore.
Breakdown of Total Financial Indebtedness (₹79,002.01 Cr):
Debt Securities (Bonds/NCDs): ₹29,921.57 Crore.
Borrowings (Bank Term Loans / FIs): ₹45,823.04 Crore.
Subordinated Liabilities: ₹3,257.40 Crore.
+-------------------------------------------------------------------------+
|                  IREDA Financial Indebtedness Breakdown                 |
+-------------------------------------------------------------------------+
|  Bank Borrowings & Term Loans   | ₹45,823.04 Cr  (58.0%)                |
|  Debt Securities (Bonds/NCDs)   | ₹29,921.57 Cr  (37.9%)                |
|  Subordinated Liabilities       | ₹3,257.40 Cr   (4.1%)                 |
|  TOTAL FINANCIAL INDEBTEDNESS   | ₹79,002.01 Cr  (100.0%)               |
+-------------------------------------------------------------------------+
Security & Solvency Protection
As disclosed in Note 7 and Annexure B, all secured non-convertible debt securities issued by IREDA maintain a Security Cover of 3.57 times, secured by charges on the company’s loan receivables. There were zero defaults on debt service obligations as of June 30, 2026.
Cash Flow & Liquidity Interpretation
As a non-banking finance company, IREDA’s operating cash flows naturally reflect net disbursements to borrowers.
Operating Cash Outflows: Standard for growing financial lenders, as loan disbursements systematically exceed principal repayments during periods of portfolio expansion.
Financing Cash Inflows: Driven by long-term debt issuances and bank line drawdowns. During Q1 FY27, IREDA successfully raised ₹1,500 crore via taxable unsecured bonds.
Liquidity Position: Backed by committed bank lines, high capital adequacy (CRAR 20.30%), and a high-quality loan asset portfolio where 96.24% of assets are performing standard loans (Stage I & II).
Valuation Analysis & Investment Thesis
Current Valuation Framework
Trading Share Price: ~₹123.00 per share
Market Capitalization: ~₹34,553 Crore
Trailing Twelve Months (TTM) EPS: ~₹6.67 – ₹6.73 per share
Price-to-Earnings Ratio (P/E): ~18.0x
Price-to-Book Ratio (P/B): ~2.44x (based on book value of ~₹50.3 per share)
+----------------------------------------------------------------------+
|                     Valuation Multiple Comparison                    |
+----------------------------------------------------------------------+
|  P/E Ratio:  IREDA (~18.0x)  vs  Sector / Power Peers (~7.5x - 8.5x) |
|  P/B Ratio:  IREDA (~2.44x)  vs  Sector / Power Peers (~1.2x - 1.35x)|
+----------------------------------------------------------------------+
Valuation Assessment: Premium Realities
IREDA trades at a valuation premium relative to traditional public sector power financiers like PFC and REC. Market pricing reflects:
Pure Green Energy Mandate: Absence of legacy thermal power assets or discom restructuring debt, reducing long-term stranded asset risks.
Growth Runway: Direct participation in India’s multi-decade renewable capital buildout.
Improving Quality Metrics: Steady decline in Net NPAs (1.22%) and a strengthening Provision Coverage Ratio (68.22%).
Shareholding Pattern Trends
The shareholding structure demonstrates institutional participation following the company’s public listing:
| Category | Holding Share (%) – June 2026 | Holding Share (%) – March 2026 | Key Observations |
| Promoters (Government of India) | 71.76% | 71.76% | Stable majority sovereign ownership |
| Foreign Institutional Investors (FII) | 2.48% | 2.14% | Continued institutional inflow (+34 bps) |
| Domestic Institutional Inst. (DII) | 2.38% | 2.44% | Minor rebalancing (-6 bps) |
| Mutual Funds | 0.11% | 0.14% | Selective participation |
| Retail & Public Investors | 23.37% | 23.65% | Broad retail ownership base |
Visual Suggestion: Donut chart illustrating shareholding distribution, highlighting the 71.76% Government of India equity stake.
Historical Stock Performance Summary
| Period / Horizon | Return (%) | Comparison vs. Benchmark |
| 1 Day | +2.86% | Outperformed Nifty PSU Bank Index |
| 1 Month | -4.27% | Market consolidation phase |
| 3 Months | -8.96% | Sectoral interest rate adjustments |
| 52-Week High / Low | ₹163.35 / ₹108.65 | Current price sits ~24.7% below 52W High |
Comprehensive SWOT Analysis
+-----------------------------------------------------------------------------------+
|                                  SWOT MATRIX                                      |
+-----------------------------------------------------------------------------------+
| STRENGTHS                                 | OPPORTUNITIES                         |
| • Navratna PSU Status & Government Backing| • Expansion into BESS & Green Hydrogen|
| • Pure-play Clean Energy Underwriting      | • GIFT City International Capital Hub |
| • Robust CRAR of 20.30% & Net NPA of 1.22%| • National Solar & Wind Buildout Goals|
+-------------------------------------------+---------------------------------------+
| WEAKNESSES                                | THREATS                               |
| • High Sectoral Concentration Risk        | • Global & Domestic Interest Rate Risk|
| • Higher Valuation Multiples vs Peers     | • Discom Payment Delays / Slippages   |
| • Board Independence Governance Vacancies  | • Aggressive Clean Energy Price Bids  |
+-----------------------------------------------------------------------------------+
Key Growth Drivers & Risk Matrix
Primary Growth Catalysts
Capacity Expansion Surge: India’s ambitious plan to add 40–50 GW of renewable capacity annually provides a continuous pipeline for loan sanctions.
GIFT City Subsidiary Operations: Operating through IREDA Global Green Energy Finance IFSC Limited allows foreign currency loan structuring, tapping global ESG debt funds at lower yields.
Diversification into Storage & Hydrogen: Funding storage technologies positions IREDA to capture value across the entire clean energy value chain.
Key Risks & Mitigation Factors
Interest Rate Volatility: Cost of funds increases could compress Net Interest Margins if borrowing costs rise faster than asset yields can be repriced.
Concentration Risk: Exclusive exposure to clean energy projects makes the company sensitive to sector-specific policy shifts or discom financial health.
Execution & Grid Delays: Solar and wind project delays caused by land acquisition or transmission connectivity issues can delay loan disbursements and interest generation.
Analyst Opinions & Long-Term Investment Thesis
Market Consensus & Analyst Views
Institutional research desks view IREDA as a structural growth story tied directly to India’s energy transition goals.
Bullish Arguments: Highlight the company’s strong revenue growth (+15.46% YoY), improving asset quality (Net NPA down to 1.22%), higher PCR (68.22%), and strategic importance as an MNRE-backed lender.
Conservative Concerns: Focus on elevated valuation multiples (~18x P/E) compared to traditional power financiers, alongside the need to monitor loan book slippages in newer technologies.
Investment Perspective
For Long-Term Investors: IREDA offers direct exposure to India’s green infrastructure development. Investors seeking structural ESG themes may monitor the stock for long-term compounding potential, while watching quarterly loan book execution and NPA trends.
Key Metrics to Track in Coming Quarters:
Net Interest Margins (NIM) and spread management.
Resolution of the ₹394 crore stay-order loan accounts.
Appointment of Independent Directors to restore Audit Committee compliance.
Growth in loan disbursements across BESS and Green Hydrogen.
Conclusion
IREDA’s Q1 FY27 financial results demonstrate continued operational momentum, supported by a 15.46% growth in operating revenue to ₹2,248.39 crore and a 36.82% surge in standalone net profit to ₹337.50 crore. Gross NPAs decreased to 3.76%, while the Provision Coverage Ratio rose to 68.22%. With a total loan portfolio approaching ₹95,000 crore and a Capital Adequacy Ratio of 20.30%, IREDA remains well-positioned to finance India’s clean energy ambitions.



