

Introduction
Computer Age Management Services Ltd. (CAMS), India’s premier Mutual Fund Registrar and Transfer Agent (RTA), officially declared its financial results for the first quarter ended June 30, 2026 (Q1 FY27) on August 3, 2026. The company delivered a solid operational performance characterized by double-digit top-line growth, sustained profit expansion, and industry-leading operating margins. CAMS continues to serve as an indispensable backbone for the Indian capital markets, benefiting directly from unprecedented retail participation across Systematic Investment Plans (SIPs) and broad equity market expansion.
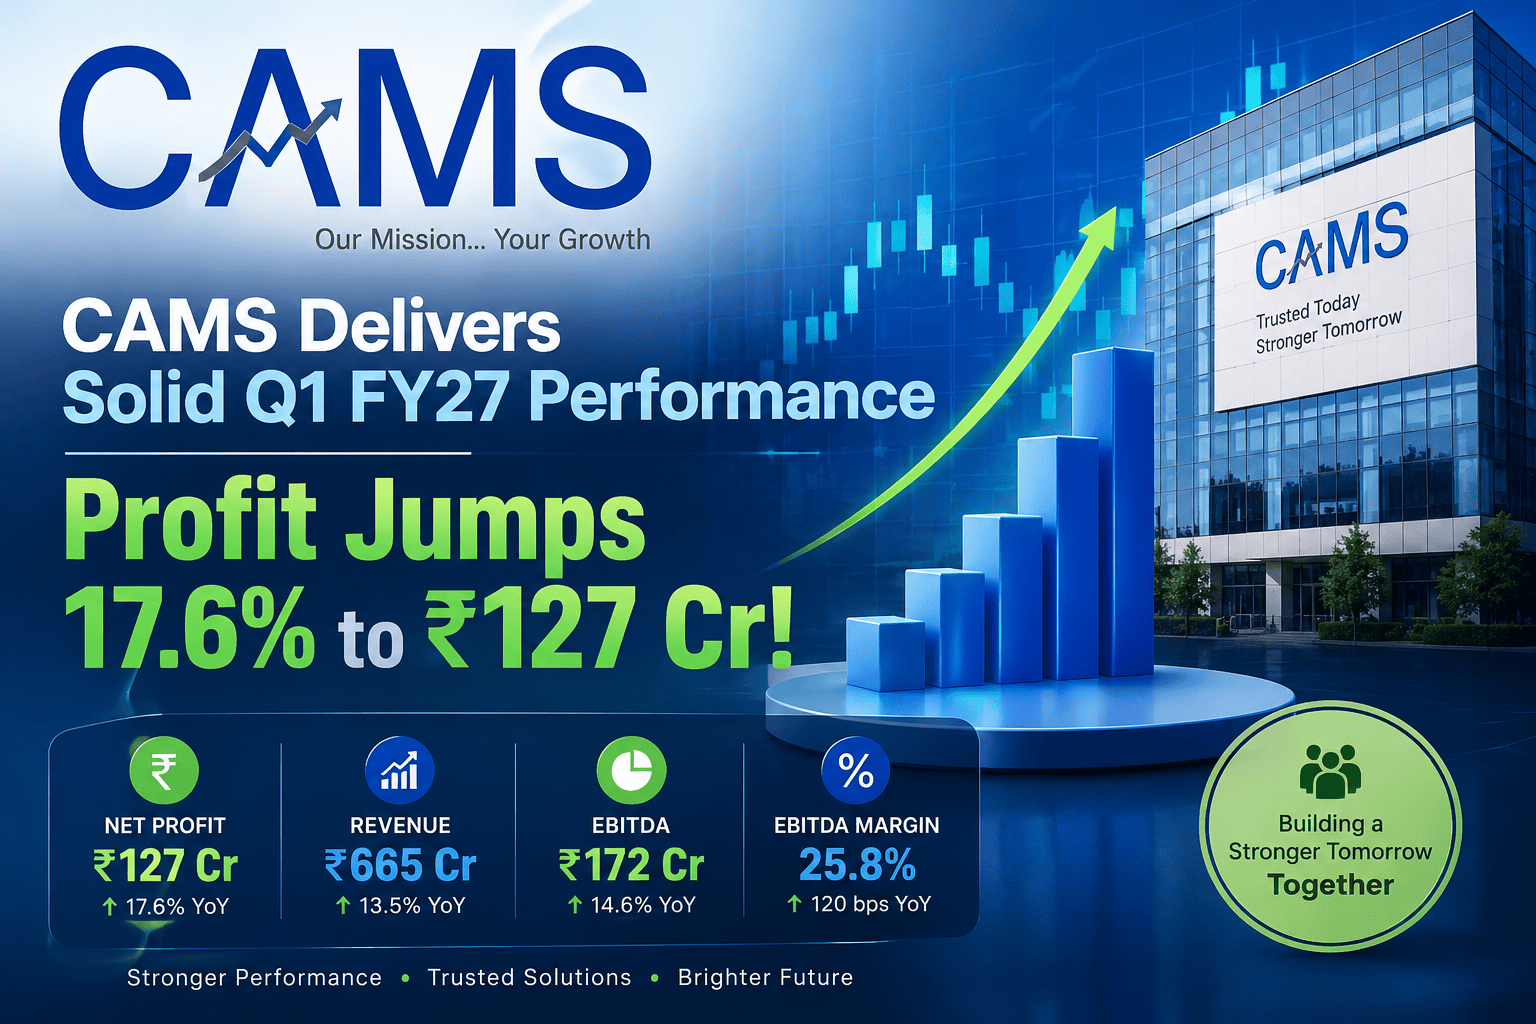
For Q1 FY27, CAMS posted a consolidated revenue from operations of ₹395.02 crore, representing an 11.54% increase compared to ₹354.15 crore reported in the corresponding quarter of the previous financial year (Q1 FY26). On a sequential basis, revenue remained virtually flat, adjusting slightly by 0.05% from ₹395.22 crore in Q4 FY26. Total revenue, including non-operating income, reached ₹411.60 crore, up 12.06% YoY. Profitability registered robust expansion, with Consolidated Profit After Tax (PAT) surging 17.63% YoY to ₹127.10 crore. Net profit attributable to equity owners reached ₹128.01 crore, reflecting a 17.34% YoY growth and a 1.25% sequential gain.
The board of directors declared a first interim dividend of ₹2.50 per equity share of face value ₹2 each. Additionally, CAMS announced strategic corporate movements, including the full 100% consolidation of Fintuple Technologies as a wholly-owned subsidiary and a revised acquisition structure for Think Analytics India Private Limited. These steps further reinforce CAMS’s long-term pivot toward becoming an integrated asset servicing and digital financial technology ecosystem.
Company Overview
Computer Age Management Services Ltd. (CAMS) is a technology-driven financial infrastructure provider and India’s largest Registrar and Transfer Agent (RTA) for mutual funds. Established in 1988, the company has grown from a specialized back-office data processing service into a systemic capital market entity. CAMS provides digital infrastructure, transaction processing, customer onboarding, compliance, and reporting services across the financial services sector.
  +-------------------------------------------------------------------+
  |                       CAMS ENTERPRISE ECOSYSTEM                   |
  +-------------------------------------------------------------------+
                                    |
        +---------------------------+---------------------------+
        |                                                       |
  +-----------+                                           +-----------+
  | Mutual    |                                           | Non-MF    |
  | Fund RTA  |                                           | Growth    |
  | Services  |                                           | Engines   |
  +-----------+                                           +-----------+
        |                                                       |
        +-- Equity & Debt AAUM Servicing                        +-- CAMS KRA (KYC Agency)
        +-- SIP Processing Infrastructure                       +-- Insurance Repository
        +-- AMC Back-Office Operations                          +-- Account Aggregator
        +-- Investor Interface Platforms                        +-- AIF & PMS Servicing
                                                                +-- CAMSPay & Fintuple AI
Business Model and Market Position
CAMS operates an asset-servicing model heavily linked to the growth of India’s mutual fund industry. The core Mutual Fund RTA business generates tier-structured fees based on the Average Assets Under Management (AAUM) serviced. The company holds a dominant market share of over 68% in the Indian Mutual Fund RTA space, servicing top Asset Management Companies (AMCs) including SBI Mutual Fund, ICICI Prudential Mutual Fund, HDFC Mutual Fund, Nippon India Mutual Fund, and Kotak Mahindra Mutual Fund.
Competitive Advantages
High Entry Barriers: Capital market RTA operations demand extensive regulatory compliance, deep integration with banking networks, high cyber-security protocols, and massive infrastructure scale.
Long-Standing Client Relationships: Switching costs for mutual funds are extremely high, generating long-term contractual visibility.
Diversified Financial Technology Verticals: Outside mutual funds, CAMS has scaled its presence across Alternative Investment Funds (AIF), Portfolio Management Services (PMS), Insurance Repositories, Know Your Customer (KYC) Registration Agencies (KRA), Account Aggregators, and Payments.
Quick Highlights Table
| Financial / Operational Metric | Q1 FY27 | Q4 FY26 | Q1 FY26 | YoY Growth (%) | QoQ Growth (%) |
| Revenue from Operations (₹ Cr) | 395.02 | 395.22 | 354.15 | +11.54% | -0.05% |
| Total Revenue (₹ Cr) | 411.60 | 408.15 | 367.29 | +12.06% | +0.85% |
| EBITDA (Excl. Other Income) (₹ Cr) | 182.73 | 183.11 | 154.27 | +18.45% | -0.21% |
| EBITDA Margin (%) | 46.26% | 46.33% | 43.56% | +270 bps | -7 bps |
| Consolidated Net Profit / PAT (₹ Cr) | 127.10 | 125.45 | 108.05 | +17.63% | +1.32% |
| PAT Attributable to Owners (₹ Cr) | 128.01 | 126.43 | 109.09 | +17.34% | +1.25% |
| PAT Margin (%) | 32.18% | 31.74% | 30.51% | +167 bps | +44 bps |
| Diluted Earnings Per Share (₹) | 5.14 | 5.08 | 4.39 | +17.08% | +1.18% |
| Interim Dividend Per Share (₹) | ₹2.50 | – | – | N/A | N/A |
| Standalone Revenue (₹ Cr) | 353.05 | 357.01 | 334.38 | +5.58% | -1.11% |
| Standalone Net Profit (₹ Cr) | 121.81 | 98.99 | 105.19 | +15.80% | +23.05% |
Complete Financial Analysis
       CAMS Consolidated Financial Progression (Q1 FY26 vs Q1 FY27)

   Revenue from Operations (₹ Cr)        Consolidated Net Profit / PAT (₹ Cr)
   +----------------------------+        +----------------------------------+
   | Q1 FY26: 354.15            |        | Q1 FY26: 108.05                  |
   | Q1 FY27: 395.02  (+11.54%) |        | Q1 FY27: 127.10       (+17.63%)   |
   +----------------------------+        +----------------------------------+
Revenue & Top-Line Performance
CAMS achieved consolidated operational revenue of ₹395.02 crore in Q1 FY27, driven by strong systematic retail participation and higher average equity asset balances. Total revenue grew 12.06% YoY to ₹411.60 crore, supported by non-operating income of ₹16.58 crore. The non-mutual fund revenues continued to expand as a proportion of total revenue, insulating the business from potential asset fee pressures.
Operating Expenses & Cost Control
Consolidated total expenses for the quarter stood at ₹238.32 crore, compared to ₹222.65 crore in Q1 FY26 and ₹241.67 crore in Q4 FY26.
Employee Benefits Expense: Controlled at ₹123.66 crore, flat sequentially compared to ₹125.33 crore in Q4 FY26 and up modestly from ₹122.44 crore in Q1 FY26.
Other Expenses: Stood at ₹88.63 crore compared to ₹77.43 crore in Q1 FY26, driven by continuous investments in IT infrastructure, software licenses, and cloud processing capacity.
EBITDA and Profitability Margins
Operating profit (EBITDA excluding other income) expanded by 18.45% YoY to ₹182.73 crore. The consolidated EBITDA margin expanded 270 basis points YoY to 46.26%, demonstrating operational leverage. Net profit margin reached 32.18%, up from 30.51% recorded in Q1 FY26.
Profit After Tax (PAT) and Earnings Per Share (EPS)
Consolidated PAT for Q1 FY27 reached ₹127.10 crore. Profit attributable to the owners of the parent entity came in at ₹128.01 crore. Basic Earnings Per Share (EPS) stood at ₹5.16, while Diluted EPS reached ₹5.14 for the quarter (face value ₹2 per share).
Segment-Wise Performance
                           CAMS Segment Breakdown
  +-----------------------------------------------------------------------+
  |  Mutual Fund RTA Services (~85-88% Revenue Share)                     |
  |  -- Core Equity & Debt AAUM Processing                                |
  |  -- SIP Lifecycle & Investor Account Management                       |
  +-----------------------------------------------------------------------+
  |  Non-Mutual Fund Verticals (~12-15% Revenue Share)                     |
  |  -- CAMS KRA: Digital KYC Processing                                  |
  |  -- Insurance Repository: Policy Digitization                         |
  |  -- Alternative Investment Servicing: AIF & PMS Back-Office           |
  |  -- CAMSPay & Fintuple: B2B Payment & Wealth Fintech Platforms        |
  +-----------------------------------------------------------------------+
1. Mutual Fund Services (Core Engine)
Mutual Fund RTA services remain the primary contributor to CAMS’s revenue. Systematic Investment Plan (SIP) transaction volumes reached record highs during the quarter, providing a stable recurring revenue base. Equity asset expansion across partner AMCs helped offset tier-based yield compression.
2. CAMS KRA Services
CAMS KRA, the company’s KYC Registration Agency, maintained its growth trajectory driven by retail investor onboarding across mutual funds, broking platforms, and portfolio management services.
3. Insurance Repository
CAMS Insurance Repository Services Limited (CAMSRep) continued expanding its electronic insurance account (eIA) holdings, supported by regulatory pushes toward insurance policy digitization.
4. Alternative Investment & Wealth Servicing
Through its digital platforms and the integration of Fintuple Technologies, CAMS delivers digital onboarding, API infrastructure, and back-office solutions for AIFs, PMS, and wealth managers.
5. Payments & Account Aggregator
CAMSPay handles recurring automated payment debits for mutual fund SIPs and banking partners. CAMS Financial Information Services continues to onboard major financial institutions onto its Account Aggregator framework.
Strategic Corporate Transactions & Subsidiary Updates
During the board meeting held on August 3, 2026, CAMS leadership approved key corporate moves:
  +-------------------------------------------------------------------+
  |                 STRATEGIC SUBSIDIARY TRANSACTIONS                 |
  +-------------------------------------------------------------------+
                                    |
        +---------------------------+---------------------------+
        |                                                       |
  +-----------+                                           +-----------+
  | Fintuple  |                                           | Think     |
  | Tech      |                                           | Analytics |
  +-----------+                                           +-----------+
  | 100% Wholly-Owned Subsidiary                          | 20.91% Additional Stake
  | Acquired remaining stake                              | Revised Consideration:
  | for ₹96.67 Lakhs                                      | ₹17.73 Crores
  +-------------------------------------------------------+-----------+
Fintuple Technologies Acquisition: CAMS acquired the remaining shares of Fintuple Technologies Private Limited for a consideration of ₹96.67 lakh, making Fintuple a 100% wholly-owned subsidiary.
Think Analytics Stake Expansion: The board approved the acquisition of an additional 20.91% stake in Think Analytics India Private Limited for a revised consideration of ₹17.73 crore. Think Analytics specializes in Alternative Data and AI Credit Scoring solutions, strengthening CAMS’s capabilities in AI-driven onboarding and analytics.
SEBI Administrative Warning: The board took on record an administrative warning letter received from SEBI on June 1, 2026, regarding certain procedural non-compliances during regular operations. CAMS confirmed that corrective actions have been fully implemented with zero financial impact on operations.
Balance Sheet Analysis
                    CAMS Consolidated Balance Sheet Overview
  +--------------------------------------------------------------------------+
  | Equity Capital & Reserves: Strong Net Worth Base (~₹1,320 Cr)            |
  | Total Debt: Minimal / Practically Zero Borrowings                        |
  | Cash & Liquid Investments: Strong Balance Sheet Position (>₹450 Cr)      |
  | Asset Efficiency: Asset-Light Business with High Capital Return Ratios   |
  +--------------------------------------------------------------------------+
CAMS maintains a debt-free balance sheet. Capital allocation prioritizes digital infrastructure investments, strategic technology acquisitions, and high dividend payouts.
Share Equity Base: Paid-up equity capital stood at ₹4,964.09 lakh (comprising equity shares of ₹2 face value) following the allotment of 2,20,230 shares under ESOP options.
Liquidity & Solvency: High cash reserves, zero long-term debt, and negative net working capital requirements provide financial independence and stability.
Ratio Analysis
| Financial Ratio | Q1 FY27 | Q1 FY26 | Ratio Benchmark & Interpretation |
| EBITDA Margin | 46.26% | 43.56% | Industry-leading operating profitability |
| PAT Margin | 32.18% | 30.51% | High net profit conversion rate |
| ROE (Annualized Est.) | ~35.5% | ~33.8% | Exceptional equity capital returns |
| ROCE (Annualized Est.) | ~44.0% | ~41.5% | Superior return on capital employed |
| Debt to Equity | 0.00 | 0.00 | Virtually debt-free capital structure |
| Current Ratio | >2.0x | >2.0x | Strong short-term liquidity position |
| Dividend Payout Ratio | ~50-65% | ~50-65% | Strong return of capital to shareholders |
Peer Comparison Table
| Company Name | Revenue Q1 FY27 (₹ Cr) | PAT Q1 FY27 (₹ Cr) | EBITDA Margin (%) | P/E Ratio (TTM) | Market Cap Position | Key Business Focus |
| CAMS | 395.02 | 127.10 | 46.26% | ~38.0x | Dominant Market Leader | Mutual Fund RTA (~68% market share), AIF, KRA |
| KFin Technologies | ~255.00 | ~78.00 | ~44.50% | ~42.0x | Leading Challenger | MF RTA (~32% share), International RTA, Issuer Services |
| CDSL | ~280.00 | ~115.00 | ~60.00% | ~52.0x | Market Leader | Equity Depository Services, Demat Accounts |
| BSE Ltd. | ~420.00 | ~140.00 | ~48.00% | ~59.2x | Primary Stock Exchange | Stock Exchange, Mutual Fund StAR MF Platform |
SWOT Analysis
  +-----------------------------------------------------------------------+
  |                             SWOT ANALYSIS                             |
  +-----------------------------------------------------------------------+
  | STRENGTHS                             | WEAKNESSES                    |
  | -- 68%+ Mutual Fund RTA Market Share  | -- Revenue Tied to Market AAUM|
  | -- High Operating Margins (>46%)      | -- Tiered MF Yield Structure  |
  | -- Debt-Free Balance Sheet            | -- Concentration in MF Space  |
  +---------------------------------------+-------------------------------+
  | OPPORTUNITIES                         | THREATS                       |
  | -- SIP Participation Growth in India  | -- Regulatory Fee Capping     |
  | -- Non-MF Diversification (AIF/KRA)   | -- Capital Market Downturns   |
  | -- AI Credit Scoring via Think Analytics| -- Cybersecurity Vulnerabilities|
  +---------------------------------------+-------------------------------+
Key Growth Drivers
                            CAMS LONG-TERM GROWTH PILLARS
  +-------------------------------------------------------------------------------+
  |  1. Rising SIP Inflows & Financialization of Household Savings               |
  |  2. Expansion of Non-MF Services (AIF, PMS, Insurance Repository, KRA)        |
  |  3. Strategic Tech & AI Investments (Fintuple & Think Analytics Integration)   |
  |  4. Structural Entry Barriers & Client Retention Rates (~98%+)                |
  +-------------------------------------------------------------------------------+
Systematic Investment Plan (SIP) Momentum: Continuous monthly retail inflows provide a resilient operational cushion against market volatility.
Expansion of Alternative Investments: AIF and PMS asset servicing represent high-margin non-MF growth verticals.
AI and Analytics Integration: Acquisitions like Think Analytics and Fintuple enable advanced AI credit scoring and digital onboarding capabilities.
Capital Market Penetration: India’s low mutual fund penetration relative to GDP offers multi-decade growth potential.
Key Risks
Market Volatility: Sharp declines in equity market valuations directly impact total AAUM and servicing fees.
Regulatory Interventions: Fee reductions or structural regulatory changes mandated by SEBI could compress margins.
Cybersecurity Risks: Operating systemic capital market infrastructure creates high exposure to cyber threats.
Investment Thesis
For Short-Term Traders: The Q1 FY27 results deliver steady top-line growth and a ₹2.50 interim dividend, offering income support.
For Long-Term Investors: CAMS offers a cash-generative, high-ROCE capital market infrastructure play with structural entry barriers.
Editorial Conclusion
Computer Age Management Services Ltd. (CAMS) has delivered a balanced, high-margin performance for Q1 FY27. Supported by secular tailwinds in Indian mutual fund participation and structural expansion across non-MF verticals, CAMS continues to demonstrate strong operational efficiency and financial discipline. The company’s combination of consistent dividend distributions, robust cash flow generation, and debt-free status solidifies its role as a fundamental core component of India’s capital market infrastructure.



