

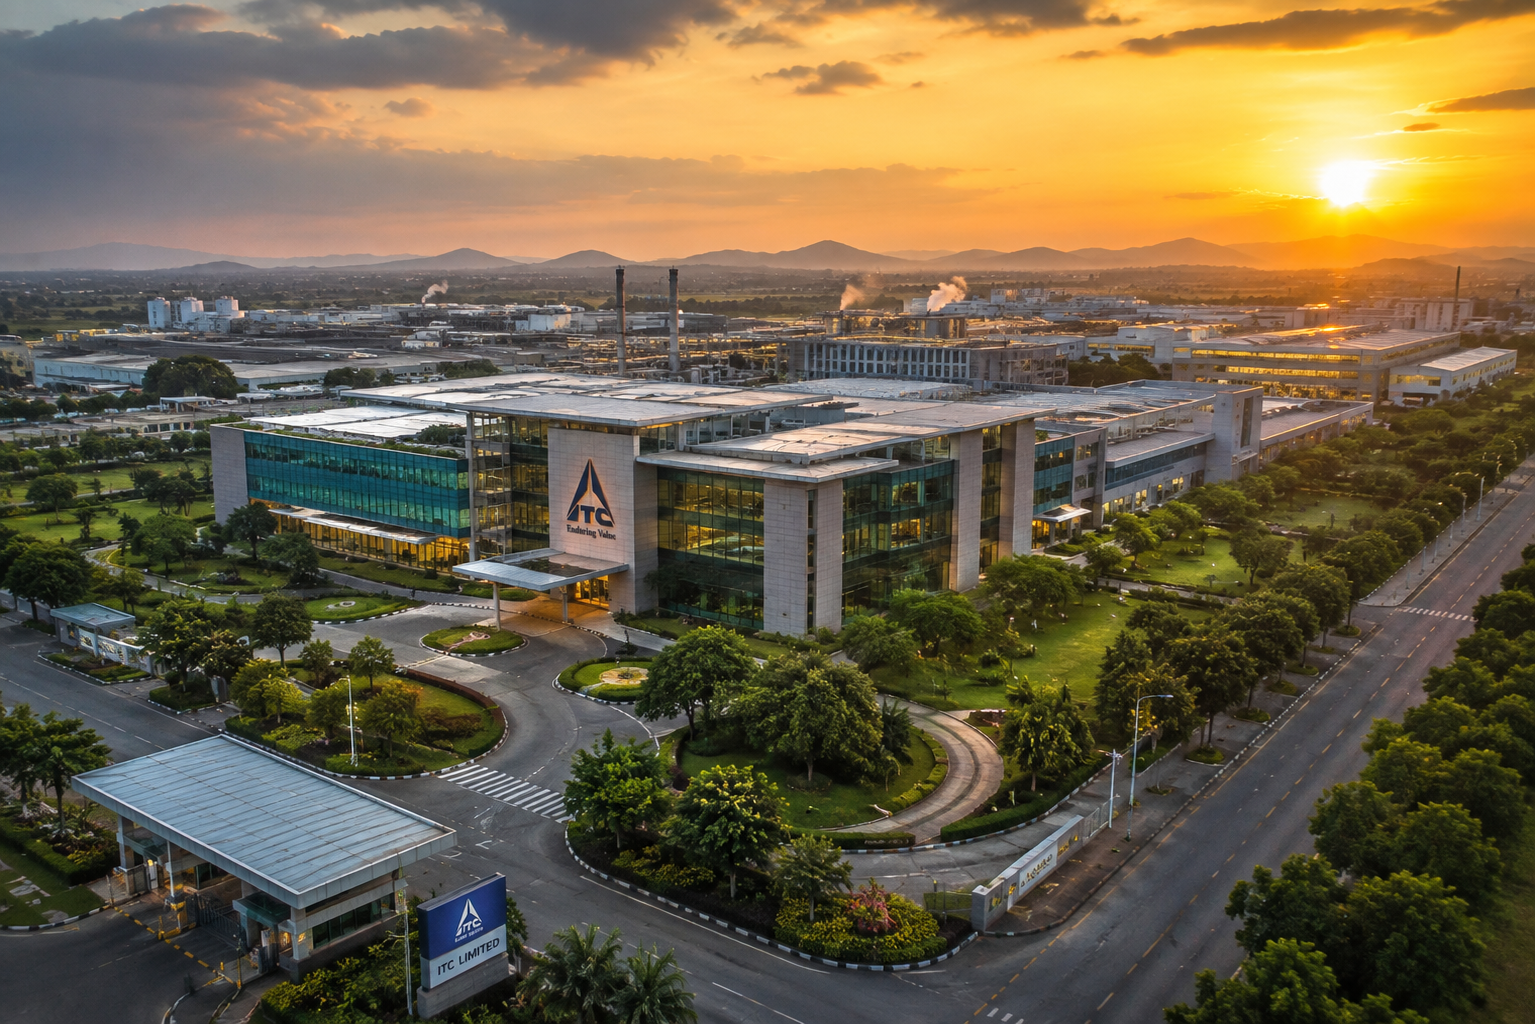
Kolkata-headquartered diversified conglomerate ITC Limited announced its unaudited standalone and consolidated financial results for the first quarter of fiscal year 2026–27 (Q1 FY27) on July 31, 2026. Operating across Fast-Moving Consumer Goods (FMCG), Cigarettes, Agri-Business, Paperboards, Paper & Packaging, and Information Technology, ITC presented a set of earnings influenced by major structural tax adjustments in its core tobacco business.
+-------------------------------------------------------------------------+
|                  ITC LTD. Q1 FY27 CONSOLIDATED FLASH                   |
+-------------------------------------------------------------------------+
| Revenue from Operations : ₹29,523.30 Cr (+27.64% YoY | +23.94% QoQ)     |
| Total Income            : ₹30,179.01 Cr (+26.74% YoY | +23.65% QoQ)     |
| Profit Before Tax (PBT) : ₹5,860.85 Cr  (-17.78% YoY | -18.29% QoQ)     |
| Consolidated PAT        : ₹4,508.79 Cr  (-15.62% YoY | -17.57% QoQ)     |
| Reported Basic EPS      : ₹3.51         (vs ₹4.19 in Q1 FY26)           |
| Exceptional Gain        : ₹405.88 Cr    (Sproutlife Re-measurement)     |
+-------------------------------------------------------------------------+
(Data Source: Official Exchange Filings under SEBI Listing Regulations, July 31, 2026)
During the quarter, Consolidated Revenue from Operations expanded by 27.64% year-on-year (YoY) to ₹29,523.30 crore (up from ₹23,129.35 crore in Q1 FY26). However, this reported revenue growth reflects a technical accounting modification. Consequent to the expiry of the GST Compensation Cess, the Government of India restructured excise duties on cigarettes effective February 1, 2026. Under Indian Accounting Standard (Ind AS 115), central excise duty is included in gross revenue, whereas GST is excluded. This structural shift led to an increase in reported excise duty expenses (reaching ₹10,408.93 crore in Q1 FY27 compared to ₹1,634.56 crore in Q1 FY26), making top-line revenue figures not strictly comparable with prior-year periods.
At the bottom line, Consolidated Profit After Tax (PAT) stood at ₹4,508.79 crore, compared to ₹5,343.41 crore in Q1 FY26. Net profit included an exceptional gain of ₹405.88 crore recognized on the fair value re-measurement of ITC’s existing stake in Sproutlife Foods Private Limited, which officially became a subsidiary effective April 1, 2026.
Key Financial Highlights & Comparison
The following tables present line-by-line financial data from ITC Limited’s standalone and consolidated statements for Q1 FY27, compared with Q1 FY26 and Q4 FY26.
1. Consolidated Financial Summary
(All values in ₹ Crore, except Per Share Data)
| Financial Parameter | Q1 FY27 (Unaudited) | Q1 FY26 (Unaudited) | Q4 FY26 (Audited) | YoY Growth (%) | QoQ Growth (%) |
| Gross Revenue from Sale of Products | ₹29,409.82 | ₹23,007.49 | ₹23,625.69 | +27.83% | +24.48% |
| Other Operating Revenue | ₹113.48 | ₹121.86 | ₹195.79 | -6.88% | -42.04% |
| Revenue from Operations | ₹29,523.30 | ₹23,129.35 | ₹23,821.48 | +27.64% | +23.94% |
| Other Income | ₹655.71 | ₹682.21 | ₹585.15 | -3.88% | +12.06% |
| Total Income | ₹30,179.01 | ₹23,811.56 | ₹24,406.63 | +26.74% | +23.65% |
| Cost of Materials Consumed | ₹6,982.15 | ₹6,238.30 | ₹6,660.03 | +11.92% | +4.84% |
| Stock-in-Trade Purchases | ₹2,865.95 | ₹3,894.19 | ₹1,818.73 | -26.40% | +57.58% |
| Inventory Changes | (₹957.34) | ₹97.99 | (₹2,720.42) | N/A | N/A |
| Excise Duty Expense | ₹10,408.93 | ₹1,634.56 | ₹5,996.80 | +536.80% | +73.57% |
| Employee Benefits Expense | ₹1,877.01 | ₹1,675.85 | ₹1,747.10 | +12.00% | +7.44% |
| Finance Costs | ₹39.78 | ₹16.47 | ₹29.18 | +141.53% | +36.33% |
| Depreciation & Amortization | ₹427.73 | ₹422.96 | ₹421.95 | +1.13% | +1.37% |
| Other Expenses | ₹3,165.74 | ₹2,771.99 | ₹3,395.01 | +14.21% | -6.75% |
| Total Expenses | ₹24,809.95 | ₹16,752.31 | ₹17,348.38 | +48.10% | +43.01% |
| Share of Profit from Associates/JVs | ₹85.91 | ₹68.76 | ₹139.57 | +24.94% | -38.45% |
| Profit Before Exceptional Items & Tax | ₹5,454.97 | ₹7,128.01 | ₹7,197.82 | -23.47% | -24.21% |
| Exceptional Items (Gain/Loss) | ₹405.88 | ₹0.00 | (₹25.20) | N/A | N/A |
| Profit Before Tax (PBT) | ₹5,860.85 | ₹7,128.01 | ₹7,172.62 | -17.78% | -18.29% |
| Tax Expense (Current + Deferred) | ₹1,352.06 | ₹1,784.60 | ₹1,702.88 | -24.24% | -20.60% |
| Consolidated PAT (Owners of Parent) | ₹4,394.13 | ₹5,244.20 | ₹5,387.97 | -16.21% | -18.45% |
| Total Consolidated PAT (Incl. NCI) | ₹4,508.79 | ₹5,343.41 | ₹5,469.74 | -15.62% | -17.57% |
| Basic Earnings Per Share (₹) | ₹3.51 | ₹4.19 | ₹4.30 | -16.23% | -18.37% |
2. Standalone Financial Summary
(All values in ₹ Crore)
| Financial Parameter | Q1 FY27 (Unaudited) | Q1 FY26 (Unaudited) | Q4 FY26 (Audited) | YoY Growth (%) |
| Gross Revenue from Operations | ₹26,794.47 | ₹20,921.78 | ₹21,463.36 | +28.07% |
| Revenue from Operations | ₹26,943.23 | ₹21,069.81 | ₹21,694.67 | +27.88% |
| Other Income | ₹645.33 | ₹662.03 | ₹652.75 | -2.52% |
| Total Income | ₹27,588.56 | ₹21,731.84 | ₹22,347.42 | +26.95% |
| Excise Duty | ₹10,035.63 | ₹1,309.07 | ₹5,644.20 | +666.62% |
| Total Standalone Expenses | ₹22,829.15 | ₹15,188.36 | ₹15,655.56 | +50.31% |
| Profit Before Tax (PBT) | ₹4,759.41 | ₹6,543.48 | ₹6,693.92 | -27.26% |
| Total Tax Expense | ₹1,180.59 | ₹1,632.75 | ₹1,580.56 | -27.69% |
| Standalone Profit After Tax (PAT) | ₹3,578.82 | ₹4,910.73 | ₹5,113.36 | -27.12% |
| Basic EPS (₹) | ₹2.86 | ₹3.93 | ₹4.08 | -27.23% |
Segment-Wise Performance Analysis
ITC Limited structures its primary business operations into four core segments: FMCG (comprising Cigarettes and Others), Agri-Business, Paperboards, Paper & Packaging, and Others (including Information Technology and specialty services).
+-------------------------------------------------------------------------+
|                  ITC LTD. Q1 FY27 SEGMENT REVENUE SHARE                 |
+-------------------------------------------------------------------------+
| FMCG - Cigarettes    : ₹16,596.67 Cr (47.27% Gross Segment Share)     |
| FMCG - Others        : ₹6,687.90 Cr  (19.05% Gross Segment Share)     |
| Agri Business        : ₹8,137.81 Cr  (23.18% Gross Segment Share)     |
| Paperboards & Pack.  : ₹2,310.27 Cr  (6.58% Gross Segment Share)      |
| Others (IT/Hotels)   : ₹1,379.50 Cr  (3.93% Gross Segment Share)      |
+-------------------------------------------------------------------------+
(Calculated from Consolidated Segment Disclosures, Q1 FY27)
Consolidated Segment Breakdowns
(All values in ₹ Crore)
| Business Segment | Q1 FY27 Segment Revenue | Q1 FY26 Segment Revenue | YoY Revenue Growth (%) | Q1 FY27 Segment Results | Q1 FY26 Segment Results | YoY Profit Growth (%) |
| FMCG – Cigarettes | ₹16,596.67 | ₹9,553.86 | +73.72% | ₹3,769.11 | ₹5,498.93 | -31.46% |
| FMCG – Others | ₹6,687.90 | ₹5,800.44 | +15.30% | ₹484.97 | ₹399.03 | +21.54% |
| Total FMCG Segment | ₹23,284.57 | ₹15,354.30 | +51.65% | ₹4,254.08 | ₹5,897.96 | -27.87% |
| Agri Business | ₹8,137.81 | ₹9,723.84 | -16.31% | ₹359.54 | ₹434.67 | -17.29% |
| Paperboards & Packaging | ₹2,310.27 | ₹2,116.62 | +9.15% | ₹216.81 | ₹151.40 | +43.20% |
| Others (IT, Hospitality, etc.) | ₹1,379.50 | ₹1,182.59 | +16.65% | ₹165.26 | ₹154.88 | +6.70% |
| Total Gross Segment Revenue | ₹35,112.15 | ₹28,377.35 | +23.73% | ₹4,995.69 | ₹6,638.91 | -24.75% |
| Less: Inter-Segment Revenue | (₹5,702.33) | (₹5,369.86) | +6.19% | — | — | — |
| Gross Revenue from Operations | ₹29,409.82 | ₹23,007.49 | +27.83% | — | — | — |
Detailed Vertical Review
1. FMCG – Cigarettes
Top-Line Dynamics: Reported segment revenue increased by 73.72% YoY to ₹16,596.67 crore. This increase was primarily driven by the inclusion of statutory central excise duty directly within gross turnover following the restructured tax regime implemented on February 1, 2026.
Profitability: Segment results stood at ₹3,769.11 crore, compared to ₹5,498.93 crore in Q1 FY26. Operating profit margins faced pressure due to higher central excise costs following the expiry of the GST Compensation Cess, alongside ongoing raw material cost adjustments in leaf tobacco.
2. FMCG – Others (Branded Packaged Foods, Personal Care, Education & Stationery)
Performance: Revenue expanded by 15.30% YoY to ₹6,687.90 crore, supported by brand investments across staples, biscuits, snacks, and personal care products.
Profitability: Segment profit increased by 21.54% YoY to ₹484.97 crore (up from ₹399.03 crore in Q1 FY26). Operating margins expanded as brand building and gestation costs scaled across mature product lines. The consolidation of Sproutlife Foods Private Limited (Yoga Bar) into this segment starting April 1, 2026, contributed to category growth.
3. Agri-Business
Performance: Agri-business turnover reached ₹8,137.81 crore, declining 16.31% YoY compared to ₹9,723.84 crore in Q1 FY26. Segment result stood at ₹359.54 crore.
Operational Drivers: Segment performance was influenced by global commodity price adjustments, regulatory restrictions on agricultural commodity exports, and strategic sourcing realignments across wheat, rice, spices, and leaf tobacco.
4. Paperboards, Paper & Packaging
Performance: Segment revenue grew 9.15% YoY to ₹2,310.27 crore, while segment results rebounded sharply by 43.20% YoY to ₹216.81 crore (up from ₹151.40 crore in Q1 FY26).
Operational Drivers: The paperboards division saw an improvement in operating margins driven by lower key input costs (wood pulp and chemicals) and operational efficiency, offsetting low-priced global imports from East Asian markets.
Strategic Corporate Actions & M&A Updates
Acquisition and Consolidation of Sproutlife Foods (Yoga Bar): Effective April 1, 2026, Sproutlife Foods Private Limited became a subsidiary of ITC Limited after ITC acquired the contractual right to nominate the majority of directors on its Board. Under Ind AS 103 (Business Combinations), ITC re-measured its pre-existing equity stake in Sproutlife at fair value, recognizing a pre-tax exceptional gain of ₹405.88 crore in the consolidated financial statements.
Expansion in Mother Sparsh Baby Care: On May 19, 2026, ITC acquired an additional 1,681 equity shares of Mother Sparsh Baby Care Private Limited. This transaction increased ITC’s total equity holding in the associate entity to 49.32% on a fully diluted basis, deepening its strategic exposure to the premium digital-first D2C baby care market.
ITC Hotels Demerger Process: The group continues its strategic alignment following the demerger process of its hospitality division into ITC Hotels Limited (listed as an associate entity). In Q1 FY27, ITC’s share of profits from associate companies reached ₹85.91 crore.
Balance Sheet, Cash Flow & Financial Health
ITC Limited maintains an unencumbered balance sheet characterized by a net debt-free capital structure, substantial liquid reserves, and consistent return metrics.
+-------------------------------------------------------------------------+
|                     ITC LTD. BALANCE SHEET ASSET BASE                   |
+-------------------------------------------------------------------------+
| Consolidated Total Assets     : ₹1,02,363.26 Cr (vs ₹95,161.34 Cr)      |
| Standalone Total Assets       : ₹95,775.64 Cr   (vs ₹90,616.02 Cr)      |
| Standalone Reserves & Surplus : ₹68,675.66 Cr   (Excl. Revaluation)     |
| Consolidated Reserves         : ₹71,254.35 Cr   (Excl. Revaluation)     |
+-------------------------------------------------------------------------+
(Data as of June 30, 2026, SEBI Filings)
Key Balance Sheet & Capital Metrics
Asset Base: As of June 30, 2026, Consolidated Total Assets stood at ₹1,02,363.26 crore, expanding from ₹95,161.34 crore reported as of June 30, 2025. Standalone total assets reached ₹95,775.64 crore.
Reserves & Equity Base: Total equity reserves (excluding revaluation reserves) stood at ₹71,254.35 crore on a consolidated basis and ₹68,675.66 crore on a standalone basis. Paid-up equity share capital was ₹1,252.95 crore (comprising ordinary shares of face value Re. 1/- each).
Capital Structure & Debt: ITC maintains a low leverage profile with a Debt-to-Equity ratio of 0.03. Finance costs for the quarter were minimal at ₹39.78 crore, yielding an Interest Coverage ratio exceeding 140x.
Return Metrics: Return on Equity (ROE) remains strong at ~28.53%.
Technical Overview & Valuation Metrics
Market Valuation Parameters
(Market data updated as of early August 2026 trading sessions)
| Valuation Parameter | Metric Value | Benchmark / Sector Context |
| Market Capitalization | ~₹3,52,015 Crore | Large-Cap Indian FMCG Benchmark |
| Current Stock Price | ~₹281.80 – ₹285.00 | Trades near 200-day moving average |
| Trailing Twelve Month (TTM) P/E | 16.75x – 18.57x | Discount to Indian FMCG Peer Avg (~38x-45x) |
| Price-to-Book (P/B) Ratio | 4.85x | Supported by high ROE (~28.5%) |
| Dividend Yield | ~5.16% | High yield within the Nifty 50 Index |
| Book Value Per Share | ₹57.87 | Net asset backing per equity share |
| 52-Week High / Low | ₹498.93 / ₹275.00 | Reflects post-demerger & tax adjustments |
Pivot Level : ₹282.27 / ₹285.73
Support 1   : ₹277.68 – ₹278.80
Support 2   : ₹274.37 – ₹276.50
Resistance 1: ₹284.50 – ₹286.68
Resistance 2: ₹288.00 – ₹292.37
14-Day RSI  : 39.87 (Neutral / Near Oversold)
200-Day SMA : ₹281.64 (Consolidation Zone)
(Source: Market Pivot & Technical Indicators, August 2026)
Peer Comparison Matrix
Comparing ITC Limited with leading domestic and global peers across consumer goods and conglomerate businesses:
| Company Name | Market Cap (₹ Cr) | TTM P/E | Operating Margin (%) | ROE (%) | Dividend Yield (%) |
| ITC Limited | ₹3,52,015 Cr | 16.75x | ~26.6% – 33.7% | 28.53% | 5.16% |
| Hindustan Unilever Ltd | ~₹5,80,000 Cr | ~52.5x | ~23.5% | 20.2% | ~1.65% |
| Nestle India Ltd | ~₹2,35,000 Cr | ~74.0x | ~22.8% | 108.5% | ~1.20% |
| Britannia Industries | ~₹1,28,000 Cr | ~54.2x | ~19.1% | 52.4% | ~1.45% |
| Dabur India Ltd | ~₹95,000 Cr | ~48.0x | ~19.8% | 19.6% | ~1.15% |
SWOT Analysis
+-------------------------------------------------------------------------+
|                        ITC LIMITED SWOT ANALYSIS                        |
+-------------------------------------------------------------------------+
| STRENGTHS                             | WEAKNESSES                      |
| • Industry leadership in cigarettes   | • High profit contribution from |
| • Widespread rural distribution setup |   heavily taxed tobacco sales   |
| • Strong balance sheet & cash flow    | • Margin pressure in paperboards|
| • Diverse brand portfolio in FMCG     |   due to cheaper global imports |
+---------------------------------------+---------------------------------+
| OPPORTUNITIES                         | THREATS                         |
| • Scaling premium D2C brands          | • Regulatory changes in central |
| • Value addition in Agri Exports      |   excise & tobacco tax rules    |
| • Expansion in paperboard packaging   | • Food inflation impacting      |
| • Scaling up Yoga Bar distribution    |   short-term demand trends      |
+---------------------------------------+---------------------------------+
Risk Factors & Strategic Challenges
Taxation and Regulatory Frameworks: Changes in central excise duties, GST rules, or local anti-tobacco regulations directly affect sales volumes and operating margins in the cigarette division.
Commodity Price Volatility: Fluctuations in agricultural commodities (wheat, edible oils, spices, leaf tobacco) and wood pulp affect input costs across the FMCG and Paperboard segments.
Cheap Import Competition in Paperboards: Low-priced paperboard imports from Asian markets put pressure on domestic realisations and industry capacity utilization.
Inflationary Demand Trends: Persistent food inflation can temporarily alter household budgets, influencing volume growth in mass-market packaged foods.
Investment Thesis & Analyst Consensus
Institutional Perspective
The Bull Case: ITC’s FMCG-Others business continues to deliver double-digit growth and expanding margins. Integration of acquired brands like Yoga Bar, combined with its distribution scale, positions ITC as a leading FMCG player. The demerger of the hotel business streamlines capital allocation, while a ~5.1% dividend yield offers downside support for value-focused portfolios.
The Bear Case: Regulatory overhangs regarding tobacco taxation remain an ongoing consideration. Margin compression in paperboards and lower margins in agri-business may constrain overall short-term earnings growth.
Consensus Rating: The institutional market consensus remains a HOLD / ACCUMULATE with long-term compounders valuing the stock’s capital allocation model and dividend distribution profile.



