

Introduction
When the leader of an industry as closely watched as paints posts its quarterly earnings, the entire consumer demand spectrum takes note. On July 29, 2026, Asian Paints Limited released its financial performance for the first quarter of the fiscal year 2026-27 (Q1 FY27). The numbers revealed a robust operational trajectory. In an environment where market participants were closely monitoring potential demand slowdowns and raw material cost fluctuations, Asian Paints delivered a comprehensive double-digit growth story across its top-line and bottom-line metrics.
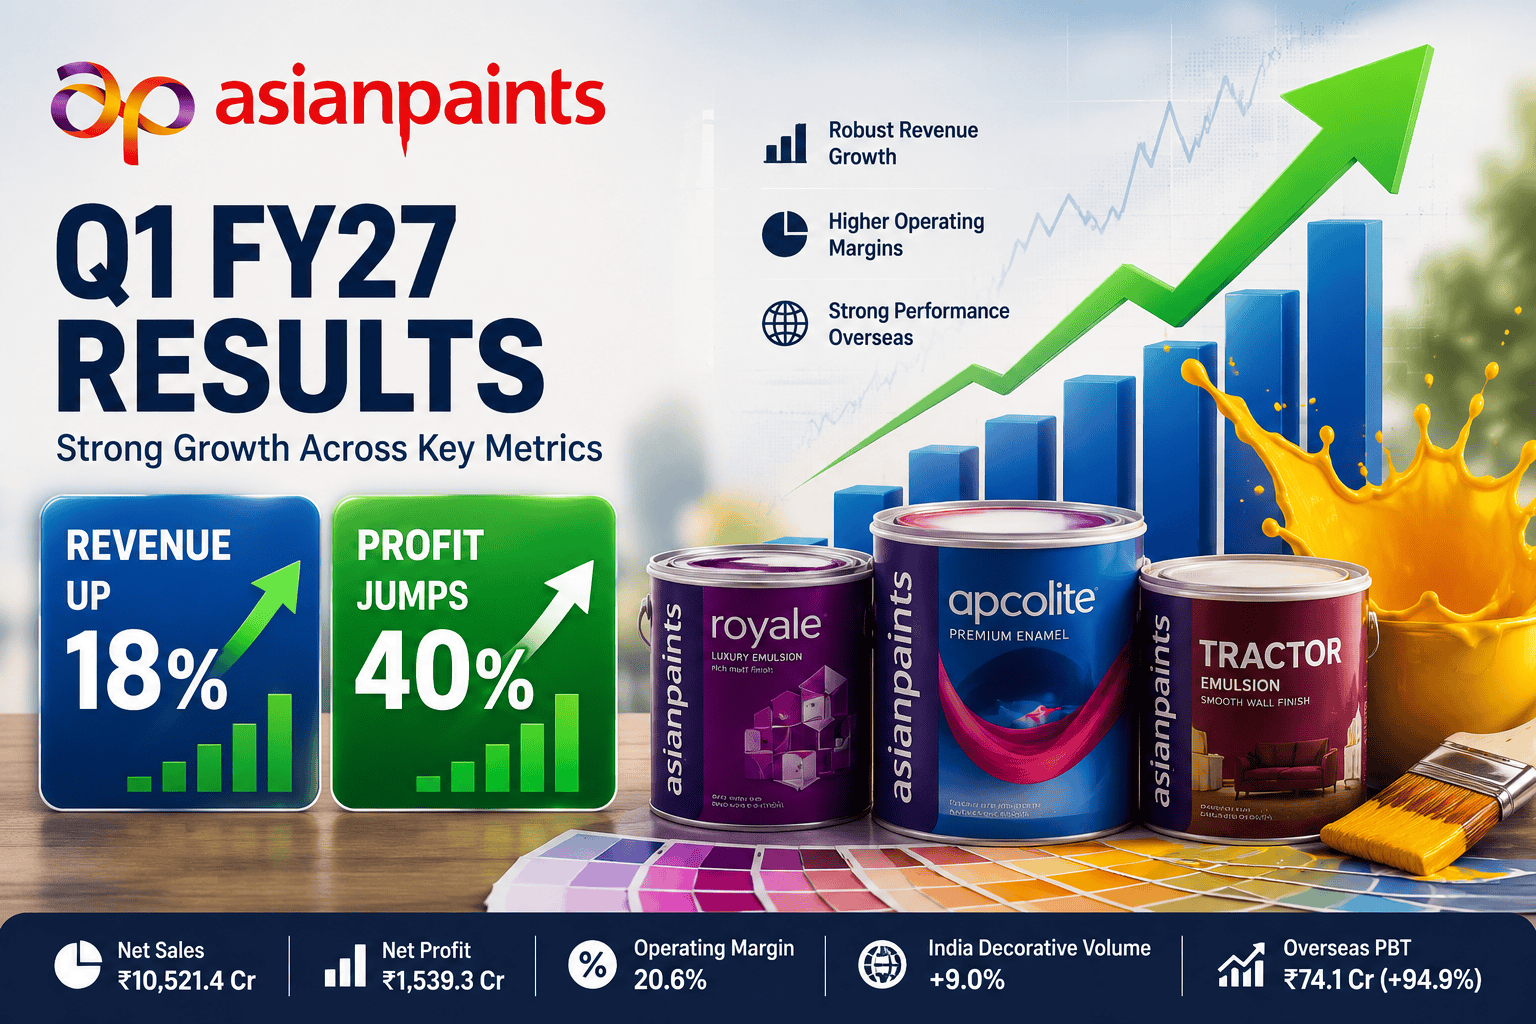
The financial results matter deeply because Asian Paints serves as an economic proxy for Indian household consumption, urban housing refurbishment, and rural market health. Over the past year, investors questioned whether intensifying industry competition—fueled by aggressive new entrants into the decorative coatings landscape—would structural erode the company’s industry-leading profitability margins. The Q1 FY27 result provided a definitive operational response. Consolidated net profit surged 40.0% to ₹1,539.3 crore, while consolidated net sales expanded 17.9% to cross ₹10,521 crore.
The biggest positive surprise came from the company’s operating leverage and pricing execution. Operating profit margins expanded by 240 basis points to 20.6% on a consolidated level, completely defying fears of immediate margin compression. Supported by a 9% volume growth in domestic decorative paints and nearly 95% profit growth in international markets, Asian Paints demonstrated that brand equity, dealer reach, and supply chain control remain formidable competitive moats. For global and domestic investors, understanding these quarterly numbers provides vital insights into the durability of India’s structural paint demand story.
Company Overview
Asian Paints Limited is India’s premier paint and décor enterprise, standing as the undisputed domestic market leader for over five decades. Founded in 1942 by four partners—Champaklal Choksey, Chimanlal Choksi, Suryakant Daniels, and Arvind Vakil—in a small garage in Mumbai, the company transformed from a modest paint manufacturing outfit into one of the top eight coatings corporations globally. Today, the group operates across 14 countries, maintains 25 state-of-the-art paint manufacturing facilities, and services consumers across more than 60 nations worldwide.
The business model of Asian Paints extends far beyond selling paint cans. It has evolved into an end-to-end “Home Décor and Improvement” ecosystem. The primary revenue generator remains the Decorative Paints segment, catering to interior wall coatings, exterior finishes, enamels, wood finishes, and specialized waterproofing solutions. Complementing decorative coatings is the Industrial Paints business, operated primarily through two long-standing joint ventures with PPG Industries USA (PPGAP and APPPG), which serve automotive OEMs, marine, and heavy industrial protective sectors. In recent years, the firm expanded into home décor, integrating modular kitchens (Sleek), bath fittings, UPVC windows (Weatherseal), decorative lighting (White Teak), and retail home design through its experiential “Beautiful Homes” network.
 Asian Paints Core Business Structure
 ├── Decorative Paints (India) ---------> Interior, Exterior, Waterproofing, Wood Finishes
 ├── Industrial Coatings (JVs) ----------> Automotive Refinish, OEM, Protective Coatings (PPGAP, APPPG)
 ├── International Operations -----------> 14 Countries (Middle East, South Asia, South Pacific)
 └── Home Décor Ecosystem --------------> Kitchens (Sleek), Bath Fittings, Lighting (White Teak), Windows
Asian Paints maintains a strong competitive position in the Indian market, holding an estimated decorative market share of over 50%. Its distribution backbone consists of over 75,000 retail dealers across urban and rural India, backed by tens of thousands of proprietary color-tinting machines installed directly at dealer premises. This physical infrastructure, combined with advanced technology, automated manufacturing plants, and consumer brands like Royale, Apex, Ultima, Tractor Emulsion, and SmartCare, forms a durable economic moat against domestic competitors.
Q1 FY27 Financial Performance
Asian Paints presented a strong financial headline for the quarter ended June 30, 2026. Operating performance showed growth across standalone and consolidated entities, driven by higher decorative volumes, calibrated pricing actions, and improved international contributions.
On a consolidated basis, Total Income for Q1 FY27 reached ₹10,782.79 crore compared to ₹9,131.34 crore in Q1 FY26, representing a growth of 18.09%. Total expenses for the quarter rose to ₹8,725.20 crore from ₹7,658.95 crore in the corresponding period of the previous fiscal. Profit Before Tax (PBT) expanded 38.91% to ₹2,095.75 crore. Total tax expenses for the consolidated entity stood at ₹536.30 crore. Net profit attributable to owners of the company came in at ₹1,539.25 crore, translating into a Basic Earnings Per Share (EPS) of ₹16.06 compared to ₹11.47 in Q1 FY26.
On a standalone basis, which reflects the core Indian operations, Revenue from Operations hit ₹9,183.44 crore. Standalone Net Profit after tax reached ₹1,478.35 crore, reflecting a 34.33% increase over the ₹1,100.52 crore recorded in Q1 FY26. Standalone PBDIT margin expanded by 259 basis points to 22.0%, proving that domestic manufacturing efficiencies and favorable product mix shifts continue to support operating profitability.
Professional Financial Summary Table (Consolidated)
| Financial Metric | Q1 FY27 (Ended 30-Jun-2026) | Q1 FY26 (Ended 30-Jun-2025) | YoY Change (%) |
| Revenue from Operations | ₹10,541.94 Cr | ₹8,938.55 Cr | +17.94% |
| Net Sales (Sales Revenue) | ₹10,521.44 Cr | ₹8,924.49 Cr | +17.89% |
| Other Operating Revenue | ₹20.50 Cr | ₹14.06 Cr | +45.80% |
| Other Income | ₹240.85 Cr | ₹192.79 Cr | +24.93% |
| Total Income | ₹10,782.79 Cr | ₹9,131.34 Cr | +18.09% |
| Cost of Materials Consumed | ₹5,449.29 Cr | ₹4,003.55 Cr | +36.11% |
| Employee Benefits Expense | ₹790.39 Cr | ₹702.96 Cr | +12.44% |
| Finance Costs | ₹47.83 Cr | ₹44.50 Cr | +7.48% |
| Depreciation & Amortization | ₹304.19 Cr | ₹300.87 Cr | +1.10% |
| Operating Profit (PBDIT) | ₹2,168.80 Cr | ₹1,625.00 Cr | +33.46% |
| PBDIT Margin (% of Net Sales) | 20.61% | 18.21% | +240 bps |
| Profit Before Tax (PBT) | ₹2,095.75 Cr | ₹1,508.71 Cr | +38.91% |
| Total Tax Expense | ₹536.30 Cr | ₹391.66 Cr | +36.93% |
| Consolidated PAT (Owners) | ₹1,539.25 Cr | ₹1,099.77 Cr | +39.96% |
| Consolidated PAT Margin (%) | 14.63% | 12.31% | +232 bps |
| Basic EPS (Face Value ₹1) | ₹16.06 | ₹11.47 | +40.02% |
| Diluted EPS (Face Value ₹1) | ₹16.05 | ₹11.47 | +39.93% |
| Domestic Volume Growth (%) | 9.0% | 12.0% (Q1FY25 Base) | Moderated Healthy |
| Domestic Value Growth (%) | 16.6% | 7.0% (Q1FY26) | Strong Expansion |
| Standalone Gross Margin (%) | 43.8% | 43.1% | +66 bps |
| Promoter Shareholding (%) | 52.63% | 52.63% | Unchanged |
| FII Shareholding (%) | 13.31% | 12.11% (Mar 26) | +120 bps QoQ |
| DII Shareholding (%) | 20.67% | 21.71% (Mar 26) | -104 bps QoQ |
| Dividend Declared | Nil (Quarterly) | Nil (Quarterly) | FY26 Final Paid |
Quarter-on-Quarter Comparison Table
Comparing performance sequentially against Q4 FY26 highlights operational momentum leading into the decorative painting season.
| Metric (Consolidated) | Q1 FY27 (Ended 30-Jun-2026) | Q4 FY26 (Ended 31-Mar-2026) | Sequential Change (%) |
| Revenue from Operations | ₹10,541.94 Cr | ₹9,246.70 Cr | +14.01% |
| Total Income | ₹10,782.79 Cr | ₹9,418.07 Cr | +14.49% |
| Total Expenses | ₹8,725.20 Cr | ₹7,829.17 Cr | +11.44% |
| PBDIT (Operating Profit) | ₹2,168.80 Cr | ₹1,787.00 Cr | +21.37% |
| PBDIT Margin (%) | 20.61% | 19.33% | +128 bps |
| Profit Before Tax (PBT) | ₹2,095.75 Cr | ₹1,614.12 Cr | +29.84% |
| Net Profit (Attributable) | ₹1,539.25 Cr | ₹1,172.12 Cr | +31.32% |
| Basic EPS (₹) | ₹16.06 | ₹12.23 | +31.32% |
Year-on-Year Comparison Table
Comparing Q1 FY27 against Q1 FY26 underlines broad-based structural growth across domestic and international operating units.
| Metric (Consolidated) | Q1 FY27 (Ended 30-Jun-2026) | Q1 FY26 (Ended 30-Jun-2025) | YoY Change (%) |
| Revenue from Sales | ₹10,521.44 Cr | ₹8,924.49 Cr | +17.89% |
| Other Operating Income | ₹20.50 Cr | ₹14.06 Cr | +45.80% |
| Other Income | ₹240.85 Cr | ₹192.79 Cr | +24.93% |
| Cost of Goods Sold (COGS) | ₹5,946.49 Cr | ₹5,123.05 Cr | +16.07% |
| Employee Expenses | ₹790.39 Cr | ₹702.96 Cr | +12.44% |
| Other Expenses | ₹1,636.30 Cr | ₹1,487.57 Cr | +10.00% |
| Finance Costs | ₹47.83 Cr | ₹44.50 Cr | +7.48% |
| Depreciation | ₹304.19 Cr | ₹300.87 Cr | +1.10% |
| Share of Profit in JVs | ₹38.16 Cr | ₹36.32 Cr | +5.07% |
| Net PAT (Owners) | ₹1,539.25 Cr | ₹1,099.77 Cr | +39.96% |
Five-Year Financial Trend Table
Evaluating Asian Paints over a five-year horizon illustrates long-term revenue expansion alongside steady profitability cycles.
| Financial Year | Sales Revenue (₹ Cr) | Operating Profit (₹ Cr) | OPM (%) | Net Profit (₹ Cr) | Basic EPS (₹) |
| FY22 | ₹29,101 Cr | ₹4,804 Cr | 16.5% | ₹3,085 Cr | ₹31.59 |
| FY23 | ₹34,489 Cr | ₹6,260 Cr | 18.2% | ₹4,195 Cr | ₹42.81 |
| FY24 | ₹35,495 Cr | ₹7,585 Cr | 21.4% | ₹5,558 Cr | ₹56.92 |
| FY25 | ₹33,906 Cr | ₹6,006 Cr | 17.7% | ₹3,710 Cr | ₹38.23 |
| FY26 | ₹35,584 Cr | ₹6,700 Cr | 18.8% | ₹4,395 Cr | ₹45.09 |
Segment-wise Revenue Analysis
Asian Paints operates across four key business segments: Domestic Decorative Paints, Industrial Coatings, International Operations, and Home Décor. In Q1 FY27, overall top-line expansion was led by domestic decorative volume gains and strong international revenues.
The Indian Decorative Paints division remains the main earnings driver, generating over 80% of total group revenues. Value growth in this segment reached 16.6%, outpacing volume growth of 9.0%. This value-volume spread indicates successful pricing execution, a richer product mix toward premium emulsions, and increased adoption of specialized exterior and waterproofing solutions.
 Q1 FY27 Revenue Growth Breakdown
 ├── Domestic Decorative Value Growth ---> +16.6% (Volume: +9.0%)
 ├── Industrial Coatings (APPPG) --------> +21.3% YoY
 ├── Industrial Coatings (PPGAP) --------> +13.5% YoY
 ├── International Net Sales (INR) ------> +27.2% YoY (Constant Currency: +20.3%)
 └── Home Décor (Kitchen Division) -------> +10.1% YoY
The Industrial Coatings business maintained strong momentum, supported by growth in commercial auto sales, industrial manufacturing, and infrastructure project construction. International business revenues surged 27.2% YoY in Rupee terms, benefiting from market share gains in the Middle East and South Asia.
Product Category Performance
Interior Paints
Interior emulsions saw healthy consumer demand during Q1 FY27, led by strong traction in economy and mid-tier product lines like Tractor Emulsion and Premium Emulsion. Luxury interiors (Royale range) continued to grow in metro and Tier 1 markets, supported by consumer interest in textured walls and anti-bacterial coatings.
Exterior Paints
Exterior wall coatings delivered solid value growth. Pre-monsoon repainting activity spurred sales of Apex and Ultima weather-proof ranges. Increased adoption of dust-resistant and heat-reflective exterior paints contributed positively to product mix realization.
Waterproofing
The SmartCare waterproofing business maintained its high-growth trajectory, expanding at a faster pace than standard decorative paints. Institutional and retail demand for pre-construction and post-construction damp-proofing solutions drove market share gains against standalone waterproofing specialists.
Wood Finishes & Adhesives
Wood coatings, including PU and luxury Italian finishes, grew steadily alongside interior renovation trends. The Viropro and TruGrip adhesive range continued expanding into wood-working channels, leveraging Asian Paints’ distribution network.
Industrial Coatings
Operated through PPG Asian Paints (PPGAP) and Asian Paints PPG (APPPG), the industrial segment performed well. APPPG recorded a 21.3% revenue jump to ₹372.9 crore, while PPGAP generated ₹651.9 crore, up 13.5% YoY. High demand for automotive OEM coatings, protective infrastructure coatings, and powder coatings supported profitability.
Domestic Business Analysis
The Indian domestic market is the primary anchor of Asian Paints’ balance sheet. In Q1 FY27, domestic decorative sales grew 16.6% in value terms and 9.0% in volume terms. Rural markets slightly outperformed urban centers, benefiting from improved agricultural liquidity and channel expansion into Tier 4, Tier 5, and rural belts.
Urban demand remained stable, supported by home renovation projects, real estate handovers, and commercial construction activity. The company expanded its distribution footprint, installing additional color-tinting machines across semi-urban and rural dealer locations. Project sales (B2B channel catering to large builders, government housing, and corporate offices) maintained strong momentum, driven by ongoing infrastructure build-outs across major Indian cities.
International Business Analysis
The International business delivered strong performance in Q1 FY27. Total overseas net sales increased 27.2% YoY in INR terms to ₹936.5 crore. In constant currency terms, international sales expanded 20.3%. Overseas Profit Before Tax (PBT) surged 94.9% YoY to ₹74.1 crore from ₹38.0 crore in Q1 FY26.
| International Region / Key Country | Key Performance Drivers | Q1 FY27 Status |
| Middle East (UAE, Oman, Bahrain) | Strong construction demand & expansion of Asian Paints Berger network | High Growth & Margin Expansion |
| Egypt (SCIB Chemicals) | Price adjustments offsetting local currency movements | Sales Recovery & Profit Contribution |
| South Asia (Nepal, Bangladesh) | Stable retail painting demand & market share gains | Positive Topline Growth |
| South Pacific (Fiji, Solomon Islands) | Steady decorative sales | Stable Profitability |
Despite ongoing geopolitical friction in parts of the Middle East, Asian Paints recorded gains across the UAE and Oman. Product re-formulations and calibrated price increases helped protect gross margins across international units.
Management Commentary
In the official press release accompanying the Q1 FY27 results, Amit Syngle, Managing Director & CEO of Asian Paints Limited, highlighted the operational drivers behind the quarter’s performance:
“We started FY27 on a good note, building on the momentum of the previous quarter and delivering a strong performance across businesses. Decorative business grew at a healthy volume growth of 9%, supported by calibrated pricing actions, translating into a robust value growth of 16.6%. Industrial coatings sustained its mid-teen growth trajectory, growing by more than 16% in value.”
“Amidst an environment that remained uncertain, the performance reflects our innovation-led strategy, deeper consumer connect and continued strengthening of our service propositions in the market… With volatility in raw material prices, we will stay agile and continue to focus on tech innovation and customer centricity to maintain our saliency in the market.”
Management expressed cautious optimism regarding full-year demand, highlighting festive season timing, monsoon progression across Indian states, and raw material cost trends as key factors to watch.
Key Growth Drivers
Urbanization and Real Estate Activity: Ongoing urban expansion and new housing completions create steady demand for initial coatings and repainting projects.
Shortening Repainting Cycles: Indian homeowners are repainting homes more frequently, shortening repainting cycles from 7–8 years to 4–5 years.
Premiumization Trend: Consumers are upgrading from basic emulsions and distempers to washable, anti-bacterial, textured, and luxury paint categories.
Expansion of Waterproofing Range: SmartCare products allow Asian Paints to capture market share in structural repair and damp-proofing.
Deepening Dealer Distribution: Unmatched logistics capabilities and tinting machine placements create entry barriers for competing paint brands.
Integrated Home Décor Offerings: The “Beautiful Homes” network cross-sells paints alongside kitchen, bath, lighting, and window products.
Challenges
Raw Material Price Volatility: Titanium Dioxide ($TiO_2$) and crude oil derivatives make up over 50% of input costs, exposing margins to global commodity swings.
New Competitors Entering the Market: The entry of well-capitalized groups like Grasim Industries (Birla Opus) is increasing market competitive intensity.
Monsoon Disruptions: An extended or uneven monsoon can disrupt outdoor painting schedules and slow Q2 sales momentum.
Geopolitical Currency Risks: Currency fluctuations in overseas markets like Egypt and Ethiopia require active pricing adjustments.
Slower Home Décor Scale-Up: Bath fittings (-4.3% sales growth) and specialty lighting continue to work toward profitability.
Margin Analysis
Asian Paints recorded operational margin expansion during Q1 FY27. Consolidated gross margin reached 43.5%, while standalone gross margin expanded 66 basis points YoY to 43.8%.
 Consolidated PBDIT Margin Trend
 ├── Q1 FY26: 18.2%
 ├── Q4 FY26: 19.3%
 └── Q1 FY27: 20.6% (+240 bps YoY)
The 240 bps expansion in consolidated PBDIT margin to 20.6% was driven by three main factors:
Calibrated Price Hikes: Strategic price adjustments taken over recent quarters helped offset raw material inflation.
Favorable Product Mix: Higher sales of premium emulsions and waterproofing products boosted realization per liter.
Supply Chain Efficiencies: Direct raw material sourcing and factory automation reduced manufacturing overheads per unit.
Cash Flow Analysis
Asian Paints maintains a cash-generative business model. Strong operating profits translate into positive free cash flow.
Operating Cash Flow: Driven by working capital management, cash flow from operations remains strong.
Investing Cash Flow: Capital deployed toward capacity expansions, brownfield debottlenecking, and technology upgrades.
Financing Cash Flow: Regular dividend distributions absorb a significant share of net profits, maintaining shareholder payout policies.
Balance Sheet Analysis
Asian Paints’ balance sheet remains strong, featuring low debt levels and a solid net worth base. Total shareholder equity (Other Equity) stood at ₹21,275.67 crore on a consolidated level as of March 31, 2026, supported by retained earnings. Consolidated debt remains low, limited to operational working capital facilities in select international subsidiaries.
Working Capital Analysis
Working capital management is an operational strength for Asian Paints. Inventory turnover remains efficient despite managing thousands of SKUs across nationwide depots. Receivables are kept tightly controlled due to cash-and-carry arrangements and short credit cycles extended to dealers. Favorable commercial terms with raw material suppliers keep payable cycles balanced, ensuring comfortable net working capital days.
Capital Allocation Strategy
The company follows a disciplined capital allocation framework:
Core Business Reinvestment: 30–40% of operating cash flows are reinvested into manufacturing expansion, R&D, and dealer network technologies.
Strategic Acquisitions: Selective M&A focused on expanding the home décor ecosystem (e.g., White Teak, Weatherseal).
Shareholder Returns: Dividend payout ratios are maintained above 50–60% of annual net profit.
CapEx Plans
To support projected demand growth through FY30, Asian Paints is executing a planned capital expenditure roadmap:
Expansion of decorative manufacturing capacity across existing greenfield and brownfield plants.
Setting up specialized chemical synthesis and vinyl acetate ethylene (VAE) emulsion facilities to secure critical raw materials internally.
Expanding modern regional distribution centers to improve order turnaround times for channel partners.
Future Growth Opportunities
 Asian Paints Strategic Growth Horizons
 ├── Horizon 1: Core Decorative & Waterproofing Dominance (Network Expansion)
 ├── Horizon 2: Home Décor Ecosystem Scaling ("Beautiful Homes" Stores)
 └── Horizon 3: Backward Integration & Industrial Coatings Expansion
Integrated Home Décor Retail: Expanding “Beautiful Homes” stores to offer complete interior design solutions.
Backward Material Integration: Localized chemical manufacturing reduces import dependencies and protects long-term margins.
Institutional and B2B Growth: Rising government infrastructure spending creates recurring demand for protective coatings.
Waterproofing Expansion: SmartCare products continue gaining market share in retail and construction channels.
Industry Analysis
The Indian paint industry is valued at over ₹70,000 crore and is projected to grow at a CAGR of 10–12% over the next decade. Growth is supported by structural tailwinds, including government housing initiatives, rising disposable incomes, and urban development.
While organized players hold roughly 75% of the market, unorganized regional players are losing share due to raw material volatility and distribution demands. The recent entry of new corporate players is expected to expand overall organized market volume, accelerating the shift away from unorganized manufacturers.
Competitor Comparison Table
Asian Paints maintains a leading market share, higher profitability, and superior return ratios compared to its domestic industry peers.
| Company Name | Q1 FY27 Net Sales (₹ Cr) | Q1 FY27 Net Profit (₹ Cr) | P/E Ratio (x) | Operating Margin (%) | Market Cap Category |
| Asian Paints | ₹10,541.94 Cr | ₹1,559.45 Cr | ~54.2x | 20.6% | Mega Cap (Leader) |
| Berger Paints | ₹2,868.03 Cr | ₹335.25 Cr | ~53.6x | 17.5% | Large Cap |
| Kansai Nerolac | ₹1,953.71 Cr | ₹109.89 Cr | ~27.9x | 13.2% | Mid Cap |
| Akzo Nobel India | ₹883.30 Cr | ₹125.70 Cr | ~37.4x | 15.8% | Mid Cap |
| Indigo Paints | ₹397.91 Cr | ₹57.34 Cr | ~35.2x | 16.1% | Small Cap |
SWOT Analysis Table
| Strengths | Weaknesses |
• Market share (>50% in decorative) • Network of 75,000+ dealers & tinting machines • High brand equity and pricing power • Consistently high ROCE (>25%) and ROE (>20%) | • High dependence on the Indian decorative market • Margin sensitivity to crude oil and $TiO_2$ prices • Slow profitability turnaround in bath fittings |
| Opportunities | Threats |
• Cross-selling through Beautiful Homes network • Market expansion in waterproofing & adhesives • Industry volume growth accelerating unorganized shift • Strategic backward integration into raw materials | • Intense price competition from new market entrants • Geopolitical conflicts affecting currency in key overseas markets • Extended monsoons delaying painting demand |
Porter Five Forces Analysis
       [Threat of New Entrants: MODERATE-HIGH]
       (Well-capitalized corporate entrants)
                          │
                          ▼
[Supplier Power: MODERATE] ──► [INDUSTRY RIVALRY: HIGH] ◄── [Buyer Power: LOW-MODERATE]
(Raw material volatility)      (Asian Paints leads)        (Retail distribution depth)
                          ▲
                          │
      [Threat of Substitutes: VERY LOW]
      (Paints remain essential for walls)
Threat of New Entrants (Moderate to High): While capital requirements are high, well-funded corporate groups are entering the sector, increasing market competition.
Bargaining Power of Suppliers (Moderate): Key inputs like Titanium Dioxide and crude derivatives are globally traded commodities, limiting long-term pricing influence.
Bargaining Power of Buyers (Low to Moderate): Individual consumers have low bargaining power, though dealers hold moderate leverage regarding trade terms.
Threat of Substitutes (Very Low): Surface coatings and paints remain essential for structural protection and aesthetics.
Competitive Rivalry (High): Incumbent players compete actively on dealer incentives, advertising, and product innovation.
Risk Analysis
Input Cost Risk: Unfavorable movements in crude oil derivatives can narrow gross margins if retail price adjustments are delayed.
Competitive Pricing Pressure: Increased market promotional spend may elevate customer acquisition costs.
Macroeconomic slowdown: Softer residential real estate transactions could impact initial painting demand.
Overseas Currency Devaluation: Geopolitical shocks in developing markets can affect overseas earnings conversions.
ESG Performance
Asian Paints incorporates Environmental, Social, and Governance (ESG) principles across its operational strategy:
Water Positivity: Achieving water-positive status across major manufacturing plants through rainwater harvesting and effluent recycling.
Renewable Energy Integration: Over 60% of total electricity consumption at manufacturing facilities is sourced from renewable energy (wind and solar).
Sustainable Product Innovation: Developing low-VOC (Volatile Organic Compounds), non-toxic, and water-based eco-friendly paint lines.
Shareholding Pattern Analysis
Asian Paints maintains a stable ownership structure led by its founding promoter families.
| Shareholder Category | Holding (% as of Jun 2026) | Holding (% as of Mar 2026) | QoQ Change |
| Promoter & Promoter Group | 52.63% | 52.63% | Unchanged |
| Foreign Institutional Investors (FII) | 13.31% | 12.11% | +1.20% |
| Domestic Institutional Investors (DII) | 20.67% | 21.71% | -1.04% |
| Mutual Funds | 10.09% | 11.42% | -1.33% |
| Retail & General Public | 13.39% | 13.54% | -0.15% |
| Total | 100.00% | 100.00% |
Institutional Investors Analysis
During Q1 FY27, Foreign Institutional Investors (FIIs) increased their stake in Asian Paints from 12.11% to 13.31%, reflecting growing international interest following the company’s operating performance. Conversely, Domestic Institutional Investors (DIIs) slightly trimmed their holdings to 20.67%, rebalancing portfolios across the broader consumer sector. Major mutual fund holders include schemes from SBI Mutual Fund, ICICI Prudential, and HDFC Mutual Fund.
Brokerages View
Following the Q1 FY27 financial disclosure, equity research firms offered updated target prices and commentary:
Morgan Stanley: Maintained “Overweight” stance with a Target Price of ₹3,150, citing volume growth and margin resilience.
CLSA: Retained “Outperform” rating, setting a Target Price of ₹3,050, highlighting strong international recovery and pricing strategy.
Motilal Oswal: Issued a “Neutral” rating with a Target Price of ₹2,900, noting strong current execution while monitoring long-term competition risks.
Valuation Analysis
Asian Paints trades at a premium valuation relative to the broader market, reflecting its high return ratios, earnings track record, and market share.
 Asian Paints Valuation Multiples Summary
 ├── Trailing P/E Multiple -------> ~54.2x - 58.7x
 ├── Price-to-Book (P/B) Ratio ---> ~11.9x - 12.7x
 ├── Enterprise Value/EBITDA ------> ~32.5x
 └── ROCE / ROE Ratios -----------> 26.3% / 21.8%
Price-to-Earnings (P/E): Currently trading at a trailing P/E of approximately 54x–58x, in line with its 5-year historical average of 55x.
EV/EBITDA: Enterprise Value to EBITDA stands at ~32.5x, reflecting strong operating cash flow generation.
Price-to-Book Value (P/B): Trades at approximately 12x book value, supported by high return on capital metrics (ROCE ~26.3%).
Technical Analysis
Asian Paints’ stock price reflected positive momentum following the Q1 FY27 earnings announcement.
Current Market Price (CMP): Trading around ₹2,760–₹2,780 per share post-results.
52-Week Range: 52-Week High of ₹2,985.70; 52-Week Low of ₹2,115.00.
Moving Averages: The stock moved above its 20-day and 50-day Exponential Moving Averages (EMA), indicating near-term technical support.
Relative Strength Index (RSI): RSI stands at ~58, indicating neutral to moderately bullish momentum without entering overbought territory.
Key Support Levels: Immediate support is located at ₹2,685–₹2,650; major long-term support sits at ₹2,580.
Key Resistance Levels: Immediate resistance is placed at ₹2,830; a breakout above this level opens technical room toward ₹2,985.
Is Asian Paints Overvalued or Undervalued?
Determining whether Asian Paints is overvalued or fairly valued depends on an investor’s investment horizon.
At ~54x trailing earnings, the stock reflects a valuation premium relative to historic market averages. However, this premium is supported by business fundamentals, including market dominance, high return ratios (ROCE > 26%), consistent dividend payouts, and strong pricing execution.
Investors seeking deep-value opportunities may view current multiples as rich. Conversely, long-term compound investors often view Asian Paints as a quality core holdings asset, where earnings growth and steady execution support market valuation over time.
Investment Thesis
Bull Case
Domestic decorative volume growth accelerates into double digits, supported by festive demand and rural consumption. Raw material input prices remain stable, keeping operating margins above 21%. The home décor ecosystem reaches operational scale, unlocking valuation upside.
Base Case
Decorative volume grows at 8–10% annually, with value growth ranging between 11–13%. EBITDA margins stabilize within the 19–21% target range. Asian Paints maintains its dominant market position while absorbing new competitive capacity, delivering low-to-mid double-digit earnings growth.
Bear Case
Intense market competition forces higher trade discounts, compressing operating margins below 17%. A sharp increase in crude oil prices pushes up input costs, while overseas currency volatility limits international earnings contributions.
Long-Term Outlook (FY27–FY30)
Asian Paints remains well-positioned to benefit from India’s structural economic growth over the coming decade. Key long-term factors include:
Rising Per Capita Paint Consumption: India’s per capita paint consumption (~4.5 kg) remains below global averages (~9.5 kg), providing long-term market expansion room.
Distribution Scale: Deep distribution coverage and tinting machine placements create high entry barriers across Tier 3, Tier 4, and rural markets.
Evolution into Home Décor: Transitioning from wall paints to an integrated décor provider expands the company’s total addressable market.
Key Risks Investors Should Monitor
Margin Compression: Raw material inflation alongside price competition from new market entrants.
Monsoon Disruptions: Severe weather events impacting painting schedules during peak quarters.
Overseas Markets: Foreign exchange fluctuations and economic conditions in international subsidiaries.
Important Dates
Q1 FY27 Result Date: July 29, 2026.
Investor Conference Call: July 29, 2026, at 5:00 PM IST.
FY26 Final Dividend Payment Date: July 13, 2026.
Conclusion
Asian Paints’ Q1 FY27 financial performance highlights the company’s execution capabilities and operational strength. Delivering 17.9% sales growth and a 40.0% net profit surge, the company demonstrated that brand strength, distribution scale, and supply chain efficiency remain durable competitive moats. While competitive dynamics and raw material prices require ongoing monitoring, Asian Paints’ initial quarter for FY27 underscores its leadership position within India’s consumer paint and home décor landscape.
Disclaimer
This article is for informational and educational purposes only and does not constitute financial, investment, or legal advice. Stock market investments are subject to market risks. Read all scheme-related documents carefully. Readers should consult a qualified financial advisor before making any investment decisions.



