

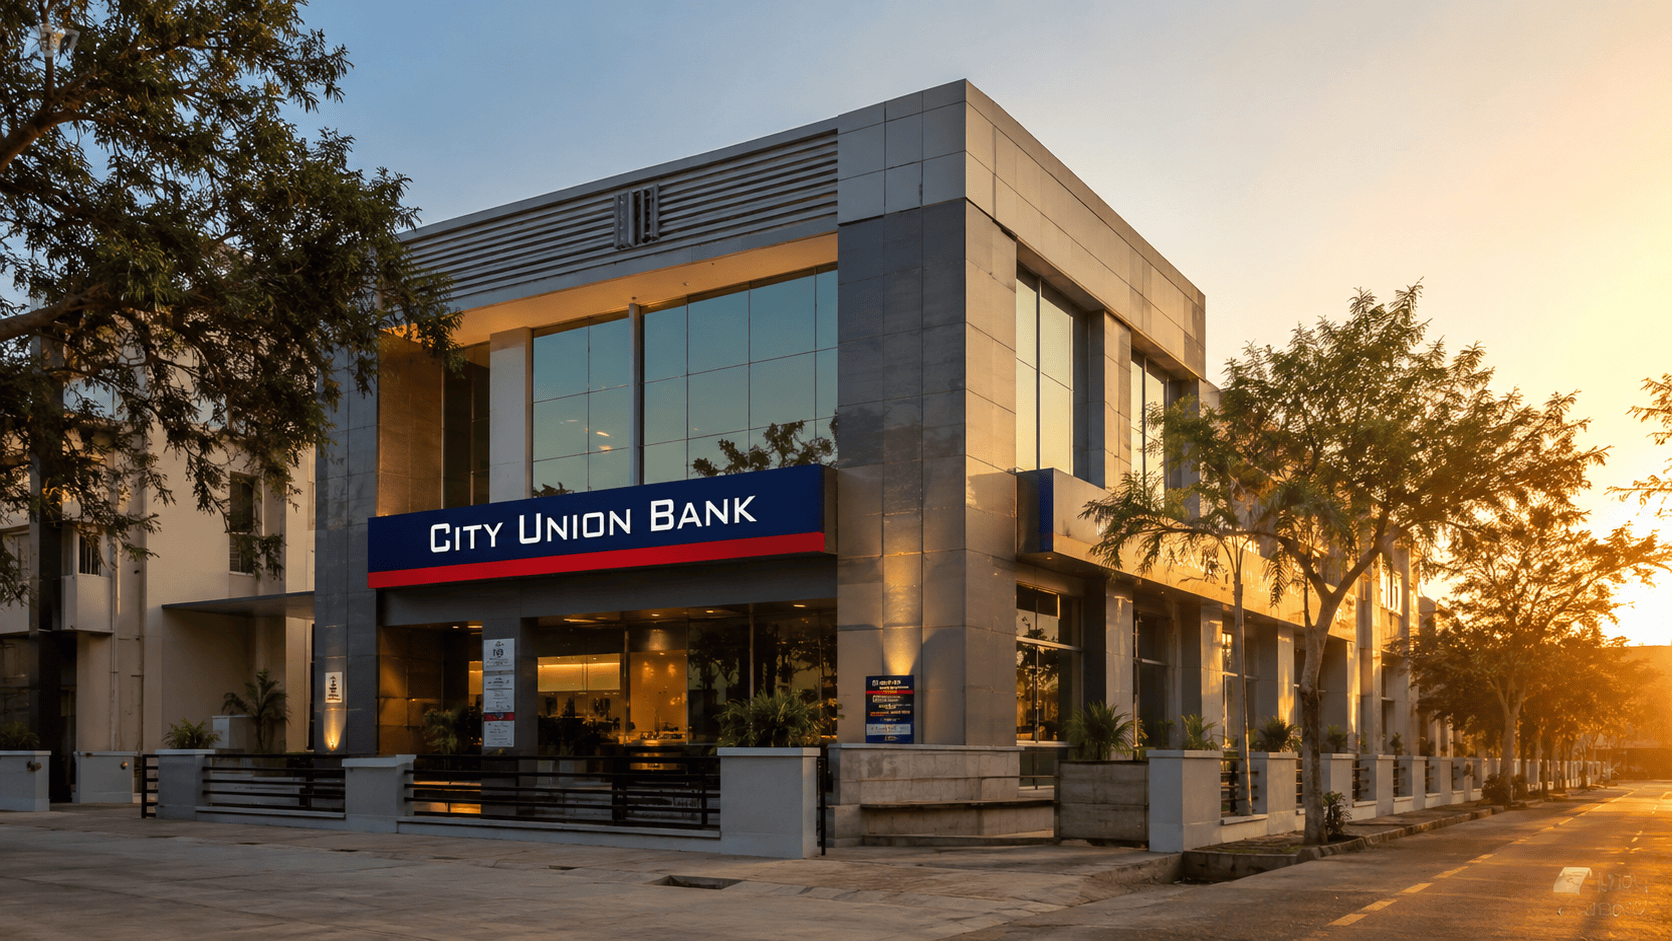
Kumbakonam-headquartered City Union Bank Limited (NSE: CUB | BSE: 532210) officially published its unaudited standalone financial results for the first quarter of fiscal year 2026–27 (Q1 FY27) on July 28, 2026. The oldest private sector bank in India delivered a robust financial performance characterized by strong bottom-line growth, sustained margin resilience, and a dramatic structural improvement in its asset quality profile.
Driven by steady credit demand across its core Micro, Small, and Medium Enterprise (MSME) and retail loan books, City Union Bank reported a standalone Net Profit of ₹382.57 crore for Q1 FY27, representing a compelling 25.06% year-on-year (YoY) increase compared to ₹305.92 crore in Q1 FY26. Sequentially, net profit expanded by 6.40% from ₹359.56 crore recorded in Q4 FY26.
The headline story of the quarter was the bank’s decisive asset quality cleanup. Gross Non-Performing Assets (GNPA) dropped by 126 basis points YoY to 1.73% of total advances, while Net Non-Performing Assets (NNPA) declined to 0.61%, reflecting multi-year operational bests. Supported by a comfortable Basel III Capital Adequacy Ratio (CAR) of 21.73% and an annualised Return on Assets (ROA) of 1.57%, City Union Bank continues to execute its strategy of conservative balance sheet expansion alongside digital transformation.
Following the earnings announcement during market hours, investors responded enthusiastically. The bank’s stock surged 7.65% to close at ₹238.40 on the National Stock Exchange (NSE), touching an intraday 52-week high of ₹245.38.
What Happened in Q1 FY27: Strategic Overview
The first quarter of FY27 served as an operational inflection point for City Union Bank. Over the past few years, the lender had intentionally recalibrated its underwriting algorithms, focused on recoveries from legacy stressed accounts, and invested in building out an automated digital journey for secured working capital loans. The fruits of these multi-year internal initiatives are now clearly visible across all major financial parameters.
During Q1 FY27, total income grew by 20.52% YoY to reach ₹2,228.57 crore, driven by a 23.65% surge in Interest Earned, which stood at ₹1,984.99 crore. Net Interest Income (NII)—the primary difference between interest generated from loans and interest disbursed to depositors—expanded by 23.57% YoY to ₹820.13 crore, providing a strong foundation for core operating profit.
CITY UNION BANK Q1 FY27 AT A GLANCE
=============================================================================
* Net Profit After Tax : ₹382.57 Cr  (+25.06% YoY | +6.40% QoQ)
* Net Interest Income  : ₹820.13 Cr  (+23.57% YoY | +4.36% QoQ)
* Operating Profit     : ₹580.57 Cr  (+28.75% YoY | +0.17% QoQ)
* Gross NPA Ratio      : 1.73%       (Down 126 bps YoY | Down 18 bps QoQ)
* Net NPA Ratio        : 0.61%       (Down 59 bps YoY  | Down 7 bps QoQ)
* Capital Adequacy     : 21.73%      (Basel III Framework)
* Return on Assets     : 1.57%       (Annualised)
=============================================================================
Operating efficiency remained tightly controlled despite inflationary pressures and elevated technology expenditure. Operating expenses for the quarter rose by 15.52% YoY to ₹483.15 crore, allowing Pre-Provision Operating Profit (PPOP) to expand 28.75% YoY to ₹580.57 crore.
Financial Performance Breakdown
Total Income & Net Interest Income (NII) Analysis
City Union Bank’s top-line performance witnessed balanced contributions across both interest and fee-based revenue streams. Total income for Q1 FY27 surged to ₹2,228.57 crore from ₹1,849.20 crore in Q1 FY26 and ₹2,146.09 crore in Q4 FY26.
Interest earned on advances and bills grew to ₹1,629.06 crore, up 26.26% YoY from ₹1,290.22 crore in Q1 FY26. This growth was driven by higher loan disbursements and steady yield realizations in the bank’s core working capital portfolio. Income on treasury investments also expanded from ₹286.41 crore in Q1 FY26 to ₹314.81 crore in Q1 FY27.
Interest Earned vs Interest Expended Trajectory (₹ in Crore)
-----------------------------------------------------------------------------
Q1 FY26:  [Interest Earned: 1,605.33]  =======>  [Interest Expended: 980.04]
Q4 FY26:  [Interest Earned: 1,855.62]  =======>  [Interest Expended: 1,069.78]
Q1 FY27:  [Interest Earned: 1,984.99]  =======>  [Interest Expended: 1,164.85]
-----------------------------------------------------------------------------
Interest expended increased to ₹1,164.85 crore in Q1 FY27, up 18.86% YoY from ₹980.04 crore, as term deposit repricing stabilized across the banking sector. Consequently, Net Interest Income (NII) expanded to ₹820.13 crore, demonstrating that the bank successfully protected its lending spreads against competitive pressures.
Other Income & Non-Interest Revenue
Other income—comprising non-fund-based banking fees, commission, treasury gains, ATM sharing fees, and recoveries from written-off accounts—stood at ₹243.59 crore in Q1 FY27. While marginally lower than the previous year’s ₹243.88 crore and Q4 FY26’s ₹290.48 crore (which benefited from seasonal Q4 fee realizations), the quality of fee income improved significantly due to rising customer adoption of digital payment channels and higher cross-selling of insurance and mutual fund products.
Operating Expenses & Cost-to-Income Dynamics
Total operating expenditure for Q1 FY27 was recorded at ₹483.15 crore. Employee costs rose to ₹234.73 crore, up 17.02% YoY from ₹200.60 crore in Q1 FY26, driven by annual increments and staff additions in tech-focused roles. Other operating costs grew by 14.14% YoY to ₹248.42 crore due to IT infrastructure upgrades, cybersecurity additions, and branch modernization efforts.
Despite absolute expenditure growth, the bank’s operational efficiency improved, as evidenced by the robust growth in operating profit. The ratio of operating expenses to total revenue dropped, enabling operating profit before provisions to reach ₹580.57 crore.
Comprehensive Financial Comparison Tables
To provide institutional and retail investors with absolute data transparency, the tables below break down City Union Bank’s Q1 FY27 standalone financial filings against comparative historical periods:
Table 1: Year-on-Year (YoY) Financial Comparison (Q1 FY27 vs Q1 FY26)
| Financial Parameter (₹ in Crore) | Q1 FY27 (Unaudited) | Q1 FY26 (Unaudited) | YoY Absolute Change | YoY Growth (%) |
| Interest Earned | 1,984.99 | 1,605.33 | +379.66 | +23.65% |
| – Interest/Discount on Advances | 1,629.06 | 1,290.22 | +338.84 | +26.26% |
| – Income on Investments | 314.81 | 286.41 | +28.40 | +9.92% |
| – Interest on RBI/Interbank Funds | 40.95 | 26.34 | +14.61 | +55.47% |
| – Others | 0.16 | 2.36 | -2.20 | -93.22% |
| Other Income | 243.59 | 243.88 | -0.29 | -0.12% |
| Total Income | 2,228.57 | 1,849.20 | +379.37 | +20.52% |
| Interest Expended | 1,164.85 | 980.04 | +184.81 | +18.86% |
| Net Interest Income (NII) | 820.13 | 625.29 | +194.84 | +23.57% |
| Operating Expenses | 483.15 | 418.24 | +64.91 | +15.52% |
| – Employee Benefits Expense | 234.73 | 200.60 | +34.13 | +17.02% |
| – Other Operating Expenses | 248.42 | 217.65 | +30.77 | +14.14% |
| Total Expenditure (Excl. Provisions) | 1,648.00 | 1,398.28 | +249.72 | +17.86% |
| Operating Profit (PPOP) | 580.57 | 450.92 | +129.65 | +28.75% |
| Provisions & Contingencies | 78.00 | 70.00 | +8.00 | +11.43% |
| Profit Before Tax (PBT) | 502.57 | 380.92 | +121.65 | +31.94% |
| Tax Expenses | 120.00 | 75.00 | +45.00 | +60.00% |
| Net Profit After Tax (PAT) | 382.57 | 305.92 | +76.65 | +25.06% |
(Source: Official City Union Bank Exchange Filing dated July 28, 2026)
Table 2: Sequential (QoQ) Financial Comparison (Q1 FY27 vs Q4 FY26)
| Financial Parameter (₹ in Crore) | Q1 FY27 (Unaudited) | Q4 FY26 (Audited) | QoQ Absolute Change | QoQ Growth (%) |
| Interest Earned | 1,984.99 | 1,855.62 | +129.37 | +6.97% |
| Other Income | 243.59 | 290.48 | -46.89 | -16.14% |
| Total Income | 2,228.57 | 2,146.09 | +82.48 | +3.84% |
| Interest Expended | 1,164.85 | 1,069.78 | +95.07 | +8.89% |
| Net Interest Income (NII) | 820.13 | 785.84 | +34.29 | +4.36% |
| Operating Expenses | 483.15 | 496.74 | -13.59 | -2.74% |
| Operating Profit (PPOP) | 580.57 | 579.56 | +1.01 | +0.17% |
| Provisions & Contingencies | 78.00 | 120.00 | -42.00 | -35.00% |
| Profit Before Tax (PBT) | 502.57 | 459.56 | +43.01 | +9.36% |
| Tax Expenses | 120.00 | 100.00 | +20.00 | +20.00% |
| Net Profit After Tax (PAT) | 382.57 | 359.56 | +23.01 | +6.40% |
(Source: Official City Union Bank Exchange Filing dated July 28, 2026)
Segment-Wise Performance Analysis
City Union Bank operates primarily across three core business segments: Retail Banking, Corporate/Wholesale Banking, and Treasury Operations. A granular review of segment reporting reveals how each division contributed to the bottom line during the quarter:
Segment Revenue Contribution (Q1 FY27 Breakdown)
=============================================================================
Retail Banking           : ₹1,321.65 Cr  (59.30% of Total Revenue)
Corporate Banking        : ₹475.99 Cr    (21.36% of Total Revenue)
Treasury Operations      : ₹408.30 Cr    (18.32% of Total Revenue)
Other Banking Operations : ₹22.63 Cr     (1.02% of Total Revenue)
=============================================================================
1. Retail Banking (MSME & Personal Loans)
The Retail Banking division remains the chief growth engine for City Union Bank, comprising its dominant MSME working capital loans, trader advances, agricultural credit, and personal retail products.
Segment Revenue: Surged to ₹1,321.65 crore in Q1 FY27, up 24.58% YoY from ₹1,060.89 crore in Q1 FY26.
Segment Results (EBIT): Expanded 63.59% YoY to ₹259.81 crore compared to ₹158.82 crore in the corresponding prior quarter.
Segment Assets: Advanced to ₹50,372.00 crore as of June 30, 2026.
2. Corporate & Wholesale Banking
City Union Bank maintains a selective and risk-calibrated approach toward corporate lending, prioritizing working capital advances backed by tangible collateral.
Segment Revenue: Rose 22.61% YoY to ₹475.99 crore from ₹388.21 crore in Q1 FY26.
Segment Results (EBIT): Stood at ₹100.65 crore, reflecting a 29.80% YoY increase from ₹77.54 crore in Q1 FY26 and a significant jump from ₹45.87 crore in Q4 FY26.
3. Treasury Operations
The Treasury division manages the bank’s statutory liquidity requirements (SLR), bond portfolio, and interbank money market placements.
Segment Revenue: Reached ₹408.30 crore in Q1 FY27 compared to ₹377.19 crore in Q1 FY26.
Segment Results (EBIT): Generated ₹200.61 crore in profit, compared to ₹194.24 crore in Q1 FY26, providing steady earnings stability.
Table 3: Segment Reporting Summary (Q1 FY27 vs Q1 FY26 vs Q4 FY26)
| Segment Particulars (₹ in Lakh) | Q1 FY27 (Unaudited) | Q4 FY26 (Audited) | Q1 FY26 (Unaudited) | YoY Growth (%) |
| Segment Revenue | ||||
| a) Treasury | 40,830 | 36,867 | 37,719 | +8.25% |
| b) Corporate / Wholesale Banking | 47,599 | 41,085 | 38,821 | +22.61% |
| c) Retail Banking | 132,165 | 130,479 | 106,089 | +24.58% |
| — Digital Banking | 120 | 150 | 81 | +48.15% |
| — Other Retail Banking | 132,045 | 130,329 | 106,008 | +24.56% |
| d) Other Banking Operations | 2,263 | 6,178 | 2,291 | -1.22% |
| Total Segment Revenue | 222,857 | 214,609 | 184,920 | +20.52% |
| Segment Results (Profit/Loss) | ||||
| a) Treasury | 20,061 | 24,750 | 19,424 | +3.28% |
| b) Corporate / Wholesale Banking | 10,065 | 4,587 | 7,754 | +29.80% |
| c) Retail Banking | 25,981 | 22,753 | 15,882 | +63.59% |
| d) Other Banking Operations | 1,950 | 5,866 | 2,032 | -4.04% |
| Total Operating Profit | 58,057 | 57,956 | 45,092 | +28.75% |
(Source: Official City Union Bank Exchange Filing dated July 28, 2026)
Asset Quality: Multi-Year Improvement
The single most pivotal narrative from City Union Bank’s Q1 FY27 results is the multi-year improvement in asset quality. Historically, the bank experienced elevated stress in its MSME loan book during the post-pandemic cycle. However, aggressive resolution strategies, higher write-offs, improved cash recoveries, and enhanced pre-disbursement risk modeling have restored balance sheet cleanliness.
Gross NPA & Net NPA Percentage Compression Trend
-----------------------------------------------------------------------------
Q1 FY26:  [GNPA: 2.99%]  ===========================>  [NNPA: 1.20%]
Q4 FY26:  [GNPA: 1.91%]  =================>            [NNPA: 0.68%]
Q1 FY27:  [GNPA: 1.73%]  ===============>              [NNPA: 0.61%]
-----------------------------------------------------------------------------
Gross and Net NPA Trajectory
Absolute Gross NPAs dropped to ₹1,169.74 crore as of June 30, 2026, representing a massive decline from ₹1,616.98 crore in Q1 FY26 and ₹1,273.08 crore in Q4 FY26. In percentage terms:
Gross NPA (%) declined to 1.73% in Q1 FY27 from 2.99% in Q1 FY26 (a compression of 126 basis points) and 1.91% in Q4 FY26.
Net NPA (%) dropped to 0.61% from 1.20% in Q1 FY26 (down 59 bps) and 0.68% in Q4 FY26. Absolute Net NPAs stood at ₹405.20 crore.
Provisioning & Coverage Ratios
Provisions (other than tax) and contingencies for Q1 FY27 stood at ₹78.00 crore, compared to ₹70.00 crore in Q1 FY26 and ₹120.00 crore in Q4 FY26. The Provision Coverage Ratio (PCR) calculated under Reserve Bank of India guidelines was maintained at a robust 85% (including technical write-offs) and 65% (excluding technical write-offs) as of June 30, 2026. This high coverage buffer insulates the bank’s future earnings against unanticipated credit slippages.
Table 4: Asset Quality Metrics Comparison
| Asset Quality Parameter | Q1 FY27 (June 30, 2026) | Q4 FY26 (March 31, 2026) | Q1 FY26 (June 30, 2025) | YoY Trend |
| Gross NPA (₹ in Crore) | 1,169.74 | 1,273.08 | 1,616.98 | Down ₹447.24 Cr (-27.66%) |
| Net NPA (₹ in Crore) | 405.20 | 449.42 | 634.55 | Down ₹229.35 Cr (-36.14%) |
| Gross NPA Ratio (%) | 1.73% | 1.91% | 2.99% | -126 bps |
| Net NPA Ratio (%) | 0.61% | 0.68% | 1.20% | -59 bps |
| Provision Coverage Ratio (incl. Write-offs) | 85.00% | 85.00% | 83.00% | +200 bps |
| Credit Cost (Annualised %) | ~0.55% | ~0.85% | ~0.65% | -10 bps |
(Source: Official City Union Bank Exchange Filing dated July 28, 2026)
Balance Sheet & Capital Adequacy
Capital Structure & Basel III Compliance
City Union Bank remains one of the best-capitalized mid-sized private banks in the country, operating comfortably above the mandatory regulatory capital thresholds set by the RBI.
As of June 30, 2026, the bank’s Capital Adequacy Ratio (CAR) under Basel III regulations stood at 21.73%, compared to 23.10% in Q1 FY26 and 21.92% in Q4 FY26. The Tier-1 capital ratio remains exceedingly strong, allowing the lender to fund internal growth without requiring near-term equity dilution.
Capital Adequacy & Net Worth Evolution (₹ in Crore)
=============================================================================
Net Worth (Q1 FY26) : ₹9,685.51 Cr   | Capital Adequacy (Q1 FY26) : 23.10%
Net Worth (Q4 FY26) : ₹10,458.24 Cr  | Capital Adequacy (Q4 FY26) : 21.92%
Net Worth (Q1 FY27) : ₹10,905.23 Cr  | Capital Adequacy (Q1 FY27) : 21.73%
=============================================================================
Net Worth & Book Value
The bank’s total Net Worth expanded to ₹10,905.23 crore as of June 30, 2026, up 12.59% YoY from ₹9,685.51 crore.
During the quarter, the bank executed a Bonus Share Issue in the ratio of 1:3 (issuing 24,76,96,809 equity shares by capitalizing the share premium account). Consequently, total paid-up equity share capital expanded from ₹74.30 crore to ₹99.08 crore (with face value of Re 1 per share). Earnings per share (EPS) for comparative historical quarters have been restated to give retrospective effect to the bonus share allotment.
Table 5: Key Financial Metrics & Ratios Snapshot
| Financial Metric / Ratio | Q1 FY27 (June 30, 2026) | Q4 FY26 (March 31, 2026) | Q1 FY26 (June 30, 2025) |
| Return on Assets (ROA – Annualised) | 1.57% | 1.56% | 1.55% |
| Return on Equity (ROE – Annualised) | 14.20% | 13.80% | 12.85% |
Basic EPS (Restated – ₹) | 3.86 | 3.63 | 3.09 |
Diluted EPS (Restated – ₹) | 3.85 | 3.62 | 3.08 |
| Capital Adequacy Ratio (CAR %) | 21.73% | 21.92% | 23.10% |
| Total Debt to Total Assets (%) | 5.25% | 5.49% | 2.19% |
| Debt-to-Equity Ratio | 0.16 | 0.18 | 0.09 |
| Net Worth (₹ in Crore) | 10,905.23 | 10,458.24 | 9,685.51 |
(Source: Official City Union Bank Exchange Filing dated July 28, 2026)
Important Corporate & Regulatory Announcements
Bonus Shares Allotment: In line with the approval granted by shareholders, City Union Bank allotted 24,76,96,809 bonus equity shares of face value Re 1 each during Q1 FY27.
ESOP Shares Allotment: The bank allotted 43,166 equity shares during the quarter pursuant to the exercise of employee stock options.
Regulatory Penalty: The Reserve Bank of India, vide letter dated May 22, 2026, levied a minor penalty of ₹10.10 lakh on the bank for non-compliance with certain directions regarding Priority Sector Loan (PSL) accounts and reporting of Self-Help Group (SHG) data to credit bureaus during the supervisory inspection for FY25. The bank confirmed that corrective procedural steps have been fully implemented.
Investment Fluctuation Reserve (IFR) Realignment: Following the RBI’s updated Second Amendment Directions on investment portfolios dated May 18, 2026, the bank discontinued maintaining an IFR and transferred the accumulated reserve of ₹165.68 crore to the General Reserve.
Loan Portfolio Assignment: During Q1 FY27, the bank acquired non-default secured loans worth ₹74.70 crore and unsecured loans worth ₹74.52 crore through assignment routes. The bank did not transfer any Special Mention Accounts (SMA) or NPAs to Asset Reconstruction Companies (ARCs) during the quarter.
Management Commentary & Strategy
During the post-earnings investor interactions, R. Vijay Anandh, Managing Director & CEO, alongside senior leadership, outlined the strategic roadmap for the remainder of FY27:
CEO Perspective on Operations:
“Our Q1 FY27 results clearly reflect the fundamental strengthening of City Union Bank. Achieving a 25% growth in net profit alongside an NII growth of over 23% underlines the core strength of our credit franchise. Most importantly, bringing our Gross NPA down to 1.73% and Net NPA to 0.61% demonstrates that asset quality issues are now firmly in the rearview mirror.”
Core Strategic Focus Areas
Accelerating MSME Working Capital Disbursal: The bank aims to expand loan growth into double digits (targeting 12–14% credit growth for FY27) by leveraging automated underwriting platforms for MSMEs.
Expansion in Non-South Geographies: While Tamil Nadu and neighboring southern states remain the core fortress (representing ~70% of branches), CUB is strategically scaling its presence in industrial clusters across Gujarat, Maharashtra, and Central India.
Co-Lending & Digital Onboarding: Investing heavily in API-based integrations to partner with high-quality NBFCs for co-lending in gold loans and micro-housing segments.
Peer Comparison
To gauge City Union Bank’s competitive positioning, the table below compares its key operational metrics against leading South India-focused and mid-sized private sector banks:
Table 6: Peer Group Comparison (Q1 FY27 / Latest Available Data)
| Metric / Parameter | City Union Bank | Karur Vysya Bank | Federal Bank | South Indian Bank | DCB Bank |
| Quarterly Net Profit (₹ Cr) | 382.57 | 756.00 | ~680.00 | ~310.00 | ~155.00 |
| NII Growth (YoY %) | +23.57% | +31.80% | +12.50% | +10.20% | +11.80% |
| Gross NPA Ratio (%) | 1.73% | 0.74% | 2.11% | 4.50% | 3.25% |
| Net NPA Ratio (%) | 0.61% | 0.19% | 0.60% | 1.40% | 1.15% |
| Capital Adequacy (CAR %) | 21.73% | 18.61% | 16.20% | 16.80% | 16.50% |
| Return on Assets (ROA %) | 1.57% | 2.11% | 1.28% | 0.95% | 0.92% |
| Price-to-Earnings (P/E) | ~14.5x | ~13.5x | ~12.2x | ~11.2x | ~10.8x |
| Price-to-Book (P/B) | ~1.95x | ~2.10x | ~1.45x | ~1.10x | ~0.95x |
Key takeaway: City Union Bank commands superior capital adequacy (21.73%) and asset quality (GNPA 1.73%) compared to most regional private sector peers, positioning it for potential valuation re-rating.
Share Price & Technical Analysis
Following the earnings release on July 28, 2026, City Union Bank’s stock witnessed strong buying momentum:
SHARE PRICE SUMMARY (As of July 28, 2026 - NSE)
=============================================================================
Current Market Price (CMP) : ₹238.40  (+7.65% Day Gain)
Intraday High / 52-Wk High : ₹245.38  (Touched on Jul 28, 2026)
Intraday Low               : ₹221.10
52-Week Low                : ₹142.00
Market Capitalization      : ₹18,971 Crore
14-Day RSI                 : 68.4 (Bullish Zone)
50-Day Simple Moving Avg   : ₹212.50 (Trading above 50-DMA)
200-Day Simple Moving Avg  : ₹188.20 (Trading above 200-DMA)
=============================================================================
Technical Indicators & Price Targets
Resistance Levels: Immediate hurdle sits at ₹248.00, followed by the psychological ₹260.00 zone.
Support Levels: Strong baseline support is established at ₹222.00 (previous breakout level) and ₹205.00 (50-DMA cushion).
Chart Structure: The stock has formed a classic higher-high, higher-low pattern on the daily candlestick chart, accompanied by a surge in trading volumes (~2.4 million shares).
Shareholding Pattern
City Union Bank is a professionally managed bank without a single promoter entity. The equity is broadly distributed among domestic institutions, foreign portfolio investors, and retail shareholders:
Table 7: Shareholding Structure (As of June 30, 2026)
| Shareholder Category | Holding Percentage (June 2026) | Holding Percentage (March 2026) | QoQ Shift |
| Promoter & Promoter Group | 0.00% | 0.00% | No Change |
| Domestic Institutional Investors (DIIs) | 44.85% | 40.74% | +4.11% |
| – Mutual Funds | 32.10% | 29.40% | +2.70% |
| – Insurance Companies / Banks | 12.75% | 11.34% | +1.41% |
| Foreign Institutional Investors (FIIs) | 18.65% | 23.37% | -4.72% |
| Public & Retail Shareholders | 36.50% | 35.89% | +0.61% |
(Source: NSE/BSE Shareholding Disclosures)
Notable Shift: Domestic Mutual Funds increased their allocation in CUB during Q1 FY27, absorbing supply from foreign portfolio investors rebalancing global emerging market allocations.
Brokerage Recommendations & Analyst Views
Institutional brokerages have responded favorably to the Q1 FY27 earnings report:
Table 8: Consensus Brokerage Ratings & Target Prices
| Brokerage Firm | Stance / Rating | Target Price (₹) | Implied Upside (%) | Key Rationale |
| JM Financial | BUY | ₹295 | +23.7% | Strong asset quality cleanup, robust CAR (21.73%), credit growth acceleration. |
| Analyst Consensus | BUY | ₹285 | +19.5% | Consistent 1.5%+ ROA delivery, lower credit cost, MSME demand. |
| ICICI Securities | NEUTRAL / HOLD | ₹275 | +15.3% | Fair valuation at current P/B multiples; watch for regional deposit competition. |
SWOT Analysis
+-----------------------------------------------------------------------------------+
|                               CITY UNION BANK SWOT                                |
+---------------------------------------------------+-------------------------------+
| STRENGTHS                                         | WEAKNESSES                    |
| - Industry-leading CAR (21.73%)          | - Geographic concentration    |
| - Low Net NPA (0.61%) & High PCR (85%)  |   in Tamil Nadu & South India |
| - Strong MSME relationship franchise               | - Moderate CASA ratio (~20%)  |
+---------------------------------------------------+-------------------------------+
| OPPORTUNITIES                                     | THREATS                       |
| - Scaling digital co-lending partnerships         | - Intense competition for low-|
| - Expanding outside traditional South territory    |   cost retail deposits        |
| - Credit re-rating driving higher P/B multiple    | - Macro risks affecting MSMEs |
+---------------------------------------------------+-------------------------------+
ESG Overview
City Union Bank is steadily embedding Environmental, Social, and Governance (ESG) standards across its operational footprint:
Environmental: Scaled up green energy financing (solar rooftop working capital lines) and paperless digital onboarding, reducing branch carbon emissions.
Social: Strong emphasis on Priority Sector Lending (PSL), with significant allocation to self-help groups, micro-farmers, and women-led small enterprises.
Governance: Professionally run board with independent directors comprising over 60% of total board strength and zero promoter interference.
Investment Perspective & Final Verdict
Long-Term Investment Case (Pros & Cons)
Pros:
Clean Balance Sheet: Gross NPA at 1.73% and Net NPA at 0.61% eliminate asset quality headwinds.
Capital Comfort: CAR at 21.73% ensures strong growth capability without dilution risk.
Consistently High ROA: Annualised ROA of 1.57% places CUB among the top quartile of mid-sized private banks.
Cons:
Deposit Cost Pressures: Industry-wide tightness in low-cost CASA deposits could place a ceiling on Net Interest Margins (NIM) over upcoming quarters.
Regional Concentration: Heavy dependence on South Indian industrial belts leaves loan growth vulnerable to regional economic shifts.
Final Verdict
City Union Bank has delivered an exemplary Q1 FY27 financial scorecard. The combination of 25% net profit growth, 23.6% NII expansion, and a drop in Net NPA to 0.61% validates management’s structural turnaround execution.
For long-term investors, CUB represents a high-quality, conservative private banking play with superior return ratios (ROA >1.5%) and strong capital buffers. The stock offers an attractive risk-reward profile for core portfolio allocation.



